



I. INTRODUCTION
a) Background of the Study
The problem of electricity supply in Nigeria by the Nigerian power sector is as a result of its inability to provide adequate electricity supply to domestic household and industrial producers despite a rapidly growing economy, irrespective of the country's large deposit of natural resources which can be harness and utilize for power generation. This deficiency has adverse effect on agricultural and industrial development which in turns impedes Nigeria's ongoing economic growth.
Power generation and distribution have continue to be problematic in Nigeria for decades in spite of efforts by successive government to improve supply and boost access to energy in Africa's most populous country and ensure viability of investment in the optimum benefits of electricity supply either for domestic usage or industrial production, as a result most households and businesses are left with no choice than to run fueled generators to supplement the intermittent supply which in turns brings about rise in cost of production (Ewald & Mohammad, 2008).
Electrical Power Quality is the degree of any deviation from the nominal values of the voltage magnitude and frequency. Power Quality problems concerning frequency deviation and voltage magnitude deviation is as a result of the presence of harmonics and voltage fluctuations. Other voltage problems are the voltage sags, short interruptions and transient over voltages. The power quality issues such as voltage sags, swells, harmonics, transients and their mitigation techniques that are suitable for different types of voltage sags, filter deign for reducing harmonic distortion and surge arrester sizing for location of transients (Madrigal&Acha,2000).
Any interruption of the power quality would cost the efficiency of the system. In most of the cases, control of the power quality refers to the control of the voltage only. This is because in most cases voltage can be controlled more easily than current. More specifically, the quality of power can be described by some parameters such as continuity of service, variation in voltage magnitude, transient voltages and currents, harmonic content (for AC) etc..To describe the importance of power quality issues, we can say that poor power quality leads to unnecessary wastage of power and economy. It creates financial burden on the suppliers and consumers. Unstable voltage and frequency often creates disturbance in the power flow through transmission line (Pohjanheimo &Lakervi, 2000).
b) Statement of the Problem
The increasing emphasis on all power system has resulted in continued growth in the application of devices such as high efficiency adjustable speed motor drives and shunt capacitors for power factor correction, to reduce losses, resulting in increasing harmonic levels in power systems. The end users have an increased awareness of power quality issues which has led to the following:
Voltage fluctuation due to over/under voltage flickering of lightning causes load switching.
Voltage sag due overloading problems, intermittent lock-up causes faults in the system excessive network loading and source voltage variation.
Voltage swell due to data loss, damage of equipments causes start/start of heavy loads, inrush current and inadequate wiring.
Long time voltage interruption due to malfunction in data processing equipment causes failure of protection devices and insulation failures or control malfunction.
c) Aim of the Study
The research is aimed at Improving the Power Supply at Igbo-Etche Rumoukwurusi Area of Port Harcourt, Rivers State using Dynamic Voltage Restorer (DVR) method.
d) Objective of the Study
The objectives of this research work are:
- To investigate the suitable mitigation techniques used to improve the power supply using Dynamic Voltage Restorer (DVR) method by determining the following factors:
a. The capacitive power of the network.
b. The% reduction in power loss of the network c. The cable cross-section of the network
d. The compensation of the network e. The losses in the distribution system of the network
f. The reduction of voltage drop of the network g. The faults behind the transformer of the network
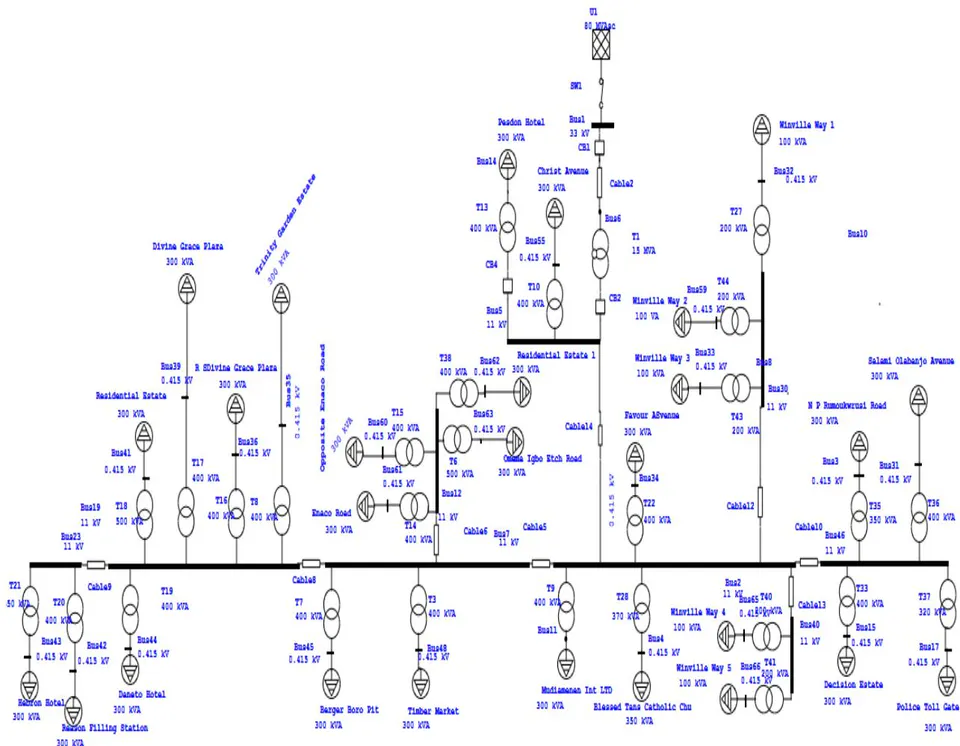
- Prepare the single-line diagram using Electrical Transient and Analysis Program Software (ETAP version 12.6) use in analyzing the possible solutions to improved power supply.
e) Scope of the Study
The scope of this research work shall be limited to 33kV distribution network in Igbo-Etche Rumoukwurusi area of Port Harcourt, and to find a suitable technical solution to the factors that has adversely affected the reliability and quality of power supply to the distribution system. The scope of this research is limited to areas covered by power supply system at Igbo-Etche Rumoukwurusi Township 33KV distribution network, Rivers State. The study focuses on the Bus input and line input data as well as the power supply capacity of the distribution transformer rating in the Network. The capacity condition on the distribution transformers are needed by the Elelenwo Substation in charge of electrical power distribution in the study zone
f) Significant of the Study
The Significance of the research work are as follows:
To investigate the mentioned power quality problems.
How they can be mitigated with the custom power device introduced.
More details about the mitigation device would also be given, in terms of their composition and design; and also how they will be configured in an electrical system.
II. LITERATURE REVIEW
a) Power Quality Production
Power quality is anything that affects the voltage, current and frequency of power being supplied to the customers. Constant voltage is the prime requirement of the customer because if the voltage is lower than the tolerable limits it will cause over heating of the equipment and less illuminating power to the lighting load. If it is higher than the limit it cause material insulation break down, reduces the life of lighting load etc. Lightening (transient over voltages), switching over voltages (i.e capacitor switching, disconnection of lines), short circuit faults (such as voltage sags) and short interruptions are the main causes for voltage deviations which lead to permanent damage of the equipments. Power system frequency is related to the balance between power generation and the load(Ray, 2001). When this balance changes, small change in frequency occurs. The frequency variations that go beyond acceptable limits for normal steady state operation of power system are normally caused by fault on the transmission lines, large portion of load being disconnected, or a large source of generation being isolated. Drop in frequency could result high magnetizing currents in induction motors and transformers, causing problem of overheating and saturation. Off nominal frequency will cause damage to turbine and generator due to high vibration of turbine blades which causes protection to trip out. Therefore it is essential requirement to maintain frequency of the system within the tolerable limits.
As stated by Wang & Mamishev, (2003), nowadays due to more sensitive nature of loads use of custom power devices/custom controllers (electronics based) to maintain power quality has become essential. As custom power controllers are used for current interruptions and voltage regulations, their utilization in the industry saves its equipments from voltage sags and interruptions which lead to loss of production (Madrigal, & Acha, 2000).
b) Protective Devices
Power systems contain protective devices to prevent injury or damage during failures. The quintessential protective device is the fuse. When the current through a fuse exceeds a certain threshold, the fuse element melts, producing an arc across the resulting gap that is then extinguished, interrupting the circuit. Given that fuses can be built as the weak point of a system, fuses are ideal for protecting circuitry from damage. Fuses however have two problems: First, after they have functioned, fuses must be replaced as they cannot be reset. This can prove inconvenient if the fuse is at a remote site or a spare fuse is not on hand. And second, fuses are typically inadequate as the sole safety device in most power systems as they allow current flows well in excess of that that would prove lethal to a human or animal (Acha, Agelidis, Anaya-Lara, & Miller, 2001).
c) Power Generation Companies in Nigeria
| S/N | Power station | Location | Source | Capacity |
| 1 | Kainji power station | Niger | Hydropower | 760MW |
| 2 | Jebba Power station | Niger | Hydro power | 576.8MW |
| 3 | Shiroro Power station | Niger | Hydro power | 600MW |
| 4 | Egbin Power Plant | Lagos | Gas Steam | 1320MW |
| 5 | Sapele Power station | Delta | Gas Steam | 1020MW |
| 6 | Trancorp Ughelli Power Station | Delta | Gas Steam | 972MW |
| 7 | Afam I-V Power Plant | Rivers | Gas Turbine | 977MW |
| 8 | Geregu I power station | Kogi | Gas Turbine | 414MW |
| 9 | Omotosho I power station | Ondo | Gas turbine | 335MW |
| 10 | Papalanto (Olorunsogo) power station | Ogun | Gas turbine | 335MW |
| 11 | Kwale Okpai power station | Delta | Gas turbine | 480MW |
| 12 | Afam VI | Rivers | Gas turbine | 642MW |
| 13 | Ibom Power Station | Akwa Ibom | Gas turbine | 190MW |
| 14 | AES Barge | Lagos | Gas turbine | 270MW |
| 15 | Omoku Power plant | Rivers | Gas turbine | 150MW |
| 16 | Trans-Amadi Power plant | Rivers | Gas turbine | 136MW |
| 17 | Rivers Power plant | Rivers | Gas turbine | 180MW |
| 18 | Aba power generator | Abia | Gas turbine | 140MW |
| 19 | Geregu II power plant | Kogi | Gas turbine | 434MW |
| 20 | Sapele power station | Delta | Gas turbine | 450MW |
| 21 | Olorunsogo power plant | Ogun | Gas turbine | 675MW |
| 22 | Egbema power generator | Imo | Gas turbine | 338MW |
| 23 | Calabar power station | Cross river | Gas turbine | 561MW |
| 24 | Ihovbor power station | Edo | Gas turbine | 450MW |
| 25 | Azura power plant | Edo | Gas turbine | 450MW |
d) Overhead Transmission
High voltage overhead conductors are not covered by insulation. The conductor material is nearly always an aluminum alloy, made into several strands and possibly reinforced with steel strands. Copper was sometimes used for overhead transmission, but aluminum is lighter, yields only marginally reduced performance and costs much less. Overhead conductors are a commodity supplied by several companies worldwide. Improved conductor material and shapes are regularly used to allow increased capacity and modernize transmission circuits. Conductor sizes range from to with varying resistance and current-carrying capacity. Thicker wires would lead to a relatively small increase in capacity due to the skin effect (which causes most of the current to flow close to the surface of the wire). Because of this current limitation, multiple parallel cables (called bundle conductors) are used when higher capacity is needed. Bundle conductors are also used at high voltages to reduce energy loss caused by corona discharge.
Today, transmission level voltages are usually considered to be 132 kV and above. Lower voltages, such as 66 kV and 33 kV, are usually considered subtransmission voltages, but are occasionally used on long lines with light loads. Voltages less than 33 kV are usually used for distribution. Voltages above 765 kV are considered extra high voltage and require different designs compared to equipment used at lower voltages (Guarnieri, 2013).
Since overhead transmission wires depend on air for insulation, the design of these lines requires minimum clearances to be observed to maintain safety. Adverse weather conditions, such as high wind and low temperatures, can lead to power outages. Wind speeds as low as 23 knots (43 km/h) can permit conductors to encroach operating clearances, resulting in a flashover and loss of supply. Oscillatory motion of the physical line can be termed gallop or flutter depending on the frequency and amplitude of oscillation.
e) Voltage Sag
IEEE definition of voltage sag is sudden and short duration reduction in RMS value of the voltage at the point of electrical system between 0.1 to 0.9 Pu with duration from 0.5 cycles to 1 minute. The amplitude of voltage sag is the remaining value of the voltage during sag. Voltage sags are considered the most severe disturbances to industrial equipment (Acha et al., 2001). In case of semiconductor industry, voltage sag of 75% (of the nominal voltage) with duration shorter than
100ms results in material loss in the range of thousands of U.S dollars (Wang& Mamishev, 2003).
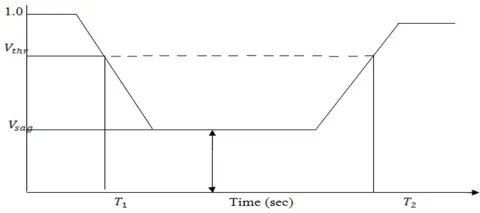
Figure 2.1 shows an rms representation of the voltage sag; sag starts when the voltage falls below the threshold voltage (0.9 Pu) at . Sag continues to at which the voltage reaches to a value above the threshold value. Duration of the sag is and its magnitude is .
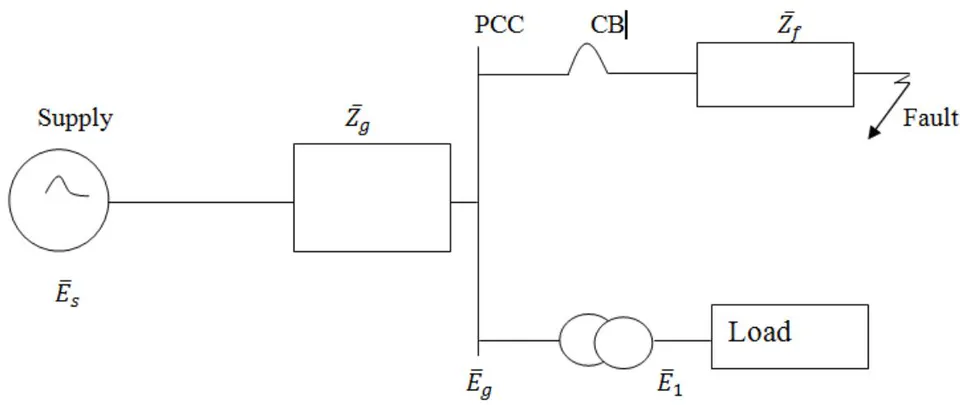
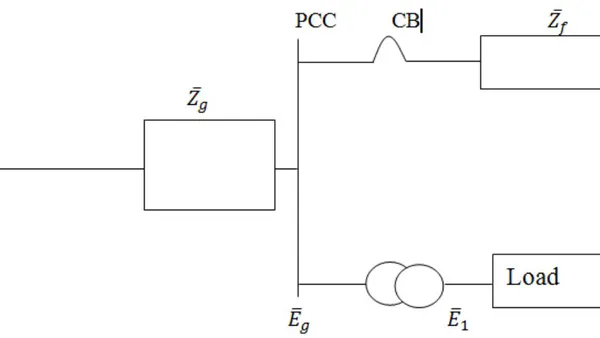
Voltage divider model as shown in figure 2.2, is used for the calculation of voltage sag magnitude in case of sag due faults at the point of common coupling (PCC) in the radial system.
III. MATERIALS AND METHODS
This chapter explained the various procedures and techniques adopted in carrying out this research work.
a) Materials Used in the Analysis
1. Injection transformer
2. Harmonic/Passive filter
3. Storage devices/Energy storage systems
4. Voltage source converter
5. DC charging set
6. Nominal rating of distribution transformers.
7. Electrical Transient and Analysis Program (ETAP Version 12.6)
- Igbo-Etche Rumoukwurusi Road load data from Port Harcourt Electricity Distribution Total Energy Limited (PHED).
9. Igbo-Etche Rumoukwurusi Road Distribution Network single line diagram
b) Description of Igbo-EtcheRumoukwurusi Road 33kV Distribution Network
The Igbo-Etche Rumoukwurusi distribution network is fed by Elelenwo Substation (132KV/33KV), the substation consists of two 60MVA transformers (2 x 60MVA transformer).
The substation is fed by Afam 132KV power line from Afam generation station, Afam, Rivers state. Presently only one of the two 60MVA transformer is in use while the other one is on SOAK, which is powered without being loaded.
The 132KV/33KV substation station has six feeders viz:
1. Onne Feeder
2. Bori Feeder
3. RST Feeder
4. Timber Feeder
5. Igbo-Etchee Feeder
6. Old Oyigbo Feeder
Two sets of incoming 132KV power lines from Afam Power Generation Station are fed through the Red, Yellow and Blue Jumper Drop into the Isolator – circuit breaker Isolator combination which is then transferred into the Main Bus. The power from the main bus is fed into a 60MVA transformer which steps the voltage to 33KV. The power is then fed into 33KV bus from which six different load feeders tap.
In the process the surge impedance loading of 132KV and 33KV lines was calculated and it was used to estimate the maximum power that can be transferred by the transmission line.
Starting from the generating station to the end users, voltage is needed to be stepped up and down several times in various substations, this ensures efficient transmission of power and minimizes the power losses.
At the substation, power factor is corrected and voltage is stepped down to 33KV which is then transferred to the distribution system (feeders). (TCN 2019).
c) Operating Principle of Dynamic Voltage Restorer method (DVR)
The single phase DVR is employed for low power loads while three phase DVR is employed for all practical high power applications as in industrial loads and domestic loads. The basic function of the DVR is to inject a dynamically controlled voltage VDVR generated by a force commutated converter in series to the bus voltage by means of a boost transformer. The momentary amplitudes of the three injected phase voltages are controlled such as to eliminate any detrimental effects of a bus fault to the load voltage . This means that any differential voltages caused by transient disturbances in the ac feeder will be compensated by an equivalent voltage generated by the converter and injected on the medium voltage level through the boost transformer. The DVR works independently of the type of fault or any event that happens in the system, provided that the whole system remains connected to the supply grid, i.e. the line breaker does not trip. For most practical cases, a more economical design can be achieved by only compensating the positive and negative sequence components of the voltage disturbance seen at the input of the DVR. This option is reasonable because for a typical distribution bus configuration, the zero sequence part of a disturbance will not pass through the step down transformer because of infinite impedance for this component. The DVR has two modes of operation which are: standby mode and boost mode. In standby mode(VDVR=0), the boost transformer's low voltage winding is shorted through the converter. No switching of semiconductors occurs in this mode of operation, because the individual converter legs are triggered such as to establish a short-circuit path for the transformer connection. Therefore, only the comparatively low conduction losses of the semiconductors in this current loop contribute to the losses. The DVR will be most of the time in this mode. In boost mode(VDVR>0), the DVR is injecting a compensation voltage through the booster transformer due to a detection of supply voltage disturbance.
d) Case Study of Different Feeder
Scenario 1: To Determine the Capacitive Power of the Network
A load has an effective power of P = 4250kW at 415V and the power factor is to be compensated from to .
The capacitive power can be determinate when the power and current before and after compensation is required:
The power and current before compensation are:
The power and current after compensation are:
Therefore, the capacitive power is calculated as:
Where:
P = Effective power pf = Power factor is to be compensated from to .
Scenario 2: To Determine the % Reduction in Power Loss of the Network
% Reduction in power loss
Scenario 3: To Determine the Cable Cross-Section of the Network
A three phase power of 4250kW, with , at 50 is to be transmitted over a cable 80m in length, the voltage drop must not exceed 4% = 16.6V. The power factor is to be increased from to .
Where:
The current consumption before compensation is:
The current consumption after compensation is:
The effective resistance per unit length before compensation for 7.04 A is
The effective resistance per unit length after compensation for 6.49 A is
e) Voltage Divider Model
Voltage divider model is used for the calculation of voltage sag magnitude in case of sag due faults at the point of common coupling (PCC) in the radial system. In this case voltage during fault can be expressed as;
Where:
is the impedance of the grid
is the impedance between the PCC and the fault including fault and line impedances
is the supply voltage
Voltage sag is also related to the changes in voltage phase angle. This change in phase angle is also called as phase angle jump (i.e the phase angle between during sag and pre-sag voltages) and is obtained by taking argument of the complex of voltage .
Assuming the load voltage and current in pre-fault conditions equal to 1 Pu, the injected power by the device during voltage sag mitigation is equal to
The Euler identity can be written as , applying to (3.2) we get
Power absorbed by the load will be given by
Therefore, active and reactive power injected by DVR are given by
The purpose of showing equations (3.5) and (3.6) is to show the dependency of active and reactive power injection by DVR on certain factors. These equations show that these powers depends on sag depth, phase angle jump, load angle and load active and reactive powers.
f) Voltage Controller
In this section the outer loop proportional voltage controller will be derived. Some basic assumptions before deriving is that the injected voltage is equal to the voltage across the capacitors of the VSC output filter, i.e. the injection transformer is considered ideal with a 1:1 turn ratio, therefore
and is the same for other two phases
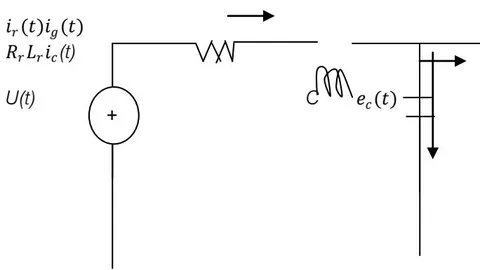
Now by applying Kirchhoff's Current Law to the LC filter in figure 3.3, we get the following differential equations in 3- phase.
By applying Clarke's transformation we can transform these 3-phase equations (3.9), (3.10) and (3.11) into 2-phase -coordinate System without any loss of information. Only off course under the assumption that there is no zero sequence component.
With a PLL synchronized with the grid voltage vector we can transform from to dq coordinate system, which will give us the dc values in steady state and thus easier to implement a control system. This is the basic tool of vector control.
Now taking Laplace transform of equation (3.15) and removing the cross coupling and the feed forward terms because they can be added later, we can have an expression to be used for voltage controller.
We get the equation that is the plant for which we want to design a controller. As the plant is a first order system, so we will use first order Low Pass Filter (LPF) response for the design of the voltage controller.
g) An unbalanced 3-phase system
An unbalanced 3-phase system consists of positive, negative, and zero sequence fundamental and harmonic components. The system voltage can be expressed as in equation (3.17):
Here subscripts +, -, and 0 represent positive, negative and zero sequence components respectively. The seriesconverter compensates for the following components of voltage:
Control system automatically controls the series converter so that the output converter voltage is V0(t). The nonlinear load current (equation (3.9)) with distortion can be expressed as:
The shunt converter provides compensation of the load harmonic currents to reduce voltage distortion. Output current with harmonic, negative and zero sequence currents controls the shunt converter so that load current distortions can be nullified. The current component which is compensated by the shunt converter is given by equation (3.20),
Equation (3.18) and equation (3.20) establish the basic principles of an ideal Unified Power Quality Controller (UPQC).
h) Determination of power and current after compensation
The power and current after compensation are:
The required capacitive power is:
% Reduction in power loss =
Determination of cable cross-section
A three phase power is given with in respect of the rated voltage, frequency is to be transmitted over a cable with different length, the voltage drop is given and must not exceed some percentage level. The power factor is to be increased between the existing pf and improved pf.
The power is expressed mathematically;
Where:
The current consumption before compensation is:
The current consumption after compensation is:
The effective resistance per unit length before and after compensation is expressed as,
A single phase load is fed from an AC supply with an Input AC of a given voltage with frequency in Hz and a base impedance. It is to be realized as a unity power factor load on the AC supply system using shut connected lossless passive element (L or C).
The load current before compensation is given as the supply voltage per load impedance, which is expressed mathematically,
The reactive current is
Where:
The compensating capacitor should supply the same reactive current as the load, hence,
i) How Installing Power Capacitors Improve System Operating Characteristics (Reduce Line Losses)
Improving Pf at the load point shall relieve the system of transmitting reactive current. Less current shall mean lower losses in the distribution system of the facility since losses are proportional to the square of the current. Therefore, the fewer kW-hr needed to be purchased from the utility.
An estimation of the power losses can be made using the following:
% reduction in power losses
The value of the capacitor for power factor correction is expressed as;
The supply current after compensation is expressed as;
Note: The snippet has been corrected for balance, but the excessive use of \left and \right without corresponding delimiters is still present in the original LaTeX/math syntax. For proper rendering, a correct delimiter should be added after \right\} or the \left. and \right\} should be removed if not needed. However, as per instructions, only the balance issue was addressed.
The equivalent resistance of the compensated load is expressed as;
Determination of Losses in the Distribution System
A single phase AC Voltage controller is used to control the heating of packing element in a machine at a given power with respect to voltage which is fed from a single-phase AC mains at a frequency of 50Hz. Feeder conductors have the resistance of where is fed from the network.
Determination of Reduction of Voltage Drop The drop of the line-line voltage in
Reduction of Voltage Drop = I (R cos )
(3.38)
Where;
The load resistance is
The rms voltage across the load is
The supply rms current is
Losses in the distribution system are
Ratio of losses without and with a compensator is
Determination of active power component of load current After the compensation, the Pf is corrected to unity of the AC mains by a shunt compensator.
The new supply current is the rms value of the fundamental active power component of load current,
Determination of Voltage Divider Model for a Voltage Sag Voltage divider model for a voltages ag
Where it has been assumed that the pre-event voltage is exactly 1 pu, thus E = 1. We see from equation (3.46) the sag becomes deeper for faults electrically closer to the customer (when become smaller), and for systems with a smaller fault level (when becomes larger).
Equation (3.47) can be used to calculate the sag magnitude as a function of the distance to the fault. Therefore we have to write , with z the impedance of the feeder per unit length and l the distance between the fault and the pee, leading to:
Determination of Fault Levels
It is possible to calculate the sag magnitude from the fault levels at the and at the fault position. Let be the fault level at the fault position and at the point-of-common coupling. For a rated voltage therelations between fault level and source impedance are as follows:
with equation (3.47) the voltage at the pcc can be written as:
j) Newton-Raphson Power Flow Technique (N-R)
Newton-Raphson technique is used for solving power flow solution. The technique uses Taylor series expansion with terms limited to first approximation. The technique was used in this research due to its powerful convergence characteristics compared to other techniques.
Complex power at the ith node on the distribution line is given by
Where:
i is node 1,2,3,4,5,6,7+..... on the distribution line
is real power injected in the node
is reactive power injected in the node
is power factor angle for the load current in the node
Determination of Injected Real and Reactive Power
From (3.52) the current entering the power system is giving by
Separating (3.62) into real and imaginary parts we have,
Where:
is the admittance matrix
is the injected real power
is the injected reactive power.
IV. RESULTS AND DISCUSSION
a) Description of the Research Work
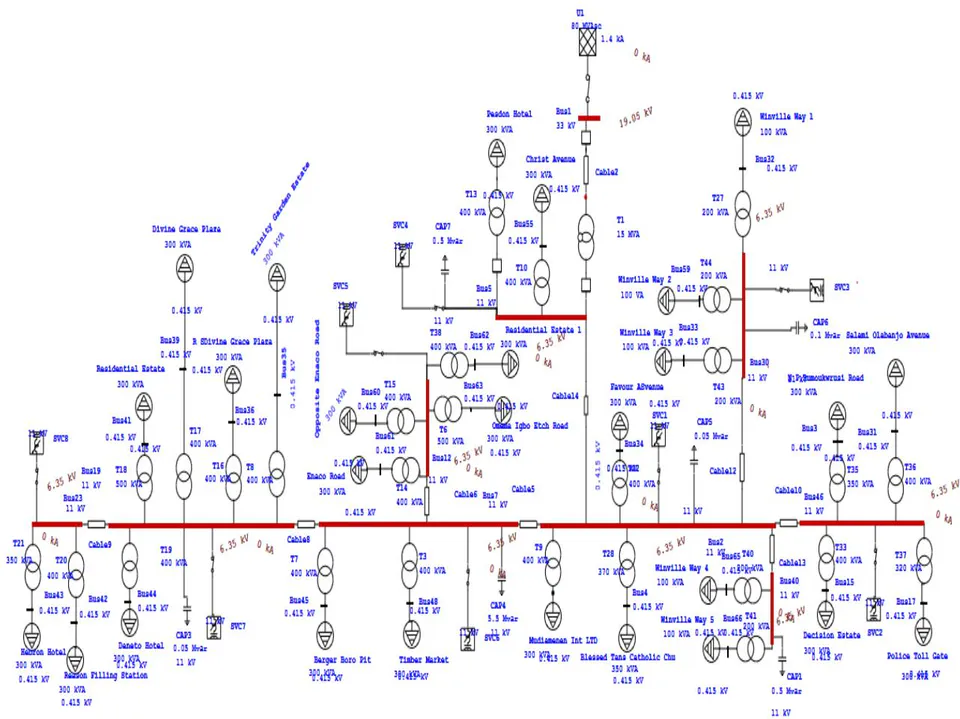
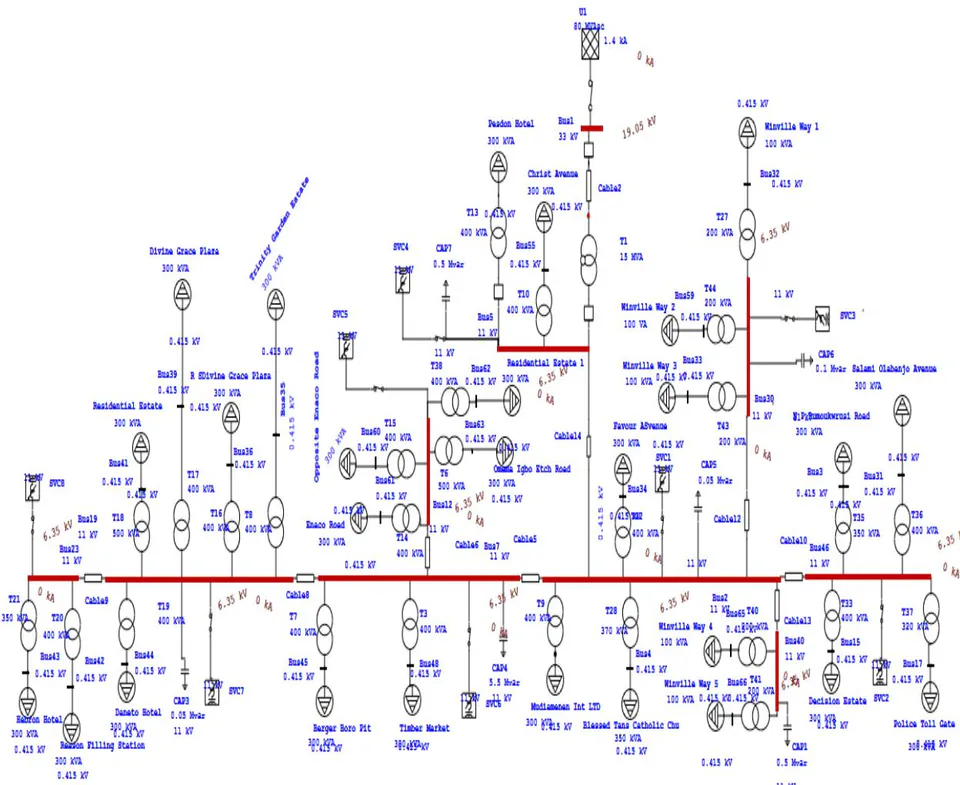
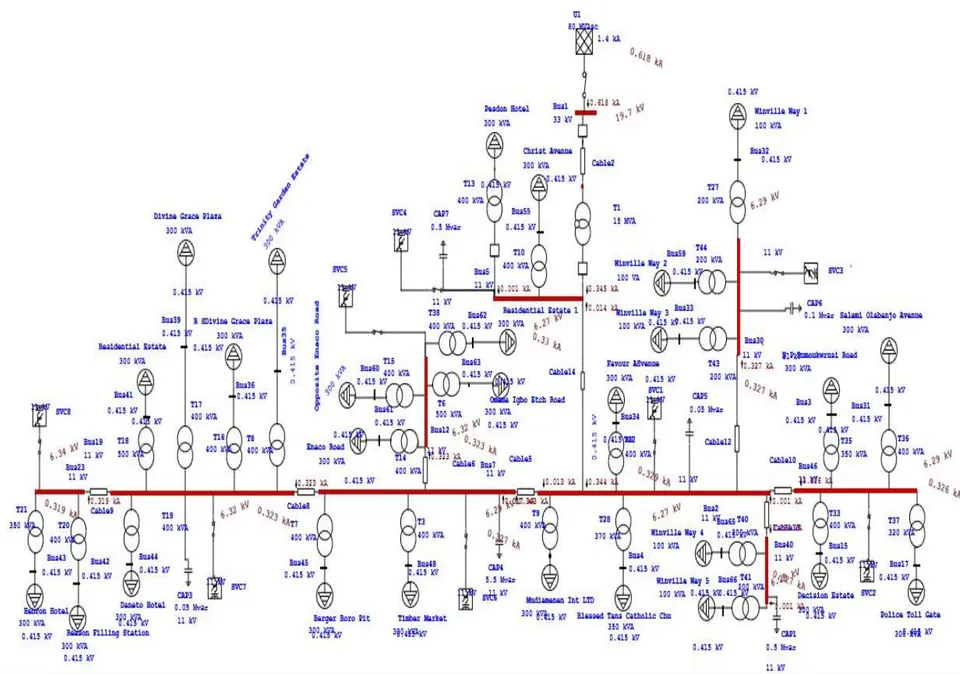
This chapter analyses the performance of the Dynamic Voltage Restorer (DVR) with different techniques by determining the capacitive power of the network,% reduction in power loss of the network, cable cross-section of the network, compensation of the network, losses in the distribution system of the network, reduction of voltage drop of the network, faults behind the transformer of the network. The different techniques were analyzed in tabular form and bar chart was used to discuss results of the scenarios. The use of Electrical Transient and Analysis Program Software (ETAP version 12.6) was used in analyzing the possible solutions to improved power supply.
b) Post-Upgrade Network Simulation

c) Discussion of Tables and Interpretation of the Results
This section discusses the tables and interpretation of the results in a concise ways by showing the full details through bar-charts.
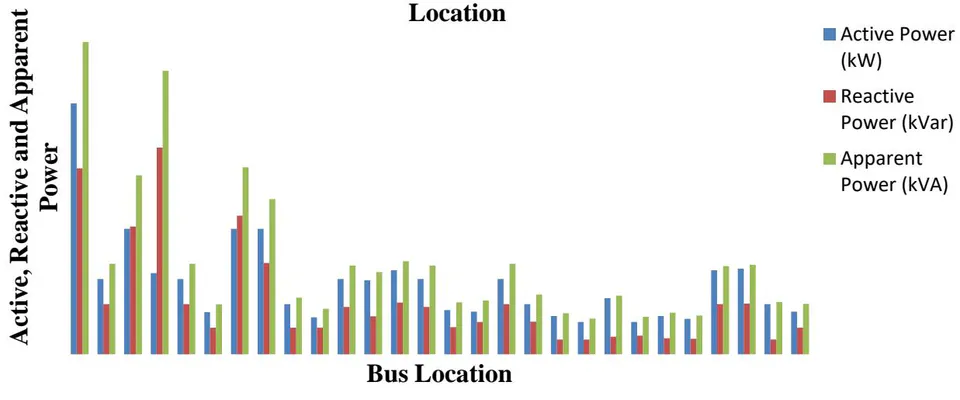
The figure indicates the variation of active, reactive and apparent power with respect to Bus location. For active power, Total Energy Limited has the highest value of the active power of 4250 kW, followed by Dane to Hotel with active power of 2125 kW. While Winderville 1 and Winderville 3 have the lowest values of 550 kW respectively.
For the reactive power, Residential Estate I has the highest value of the active power of 3500 kVAR, followed by Total Energy Limited with active power of
3150 kVAR. While Favour Avenue has the lowest values of 250.50kVAR.
For the apparent power, Total Energy Limited has the highest value of the active power of 5290.09 kVA, followed by Residential Estate I with active power of 4803.33kVA. While Winderville 1 has the lowest values of 604.38kVA.
Therefore for active power Winderville 1 and Winderville 3 should be upgraded and the active power should be increased.
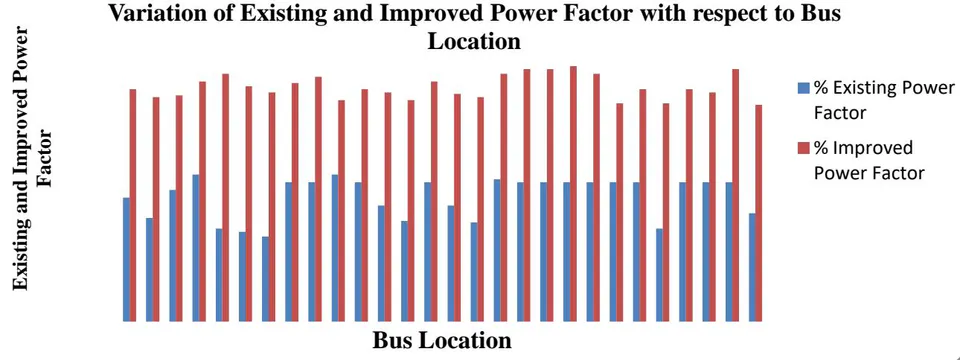
The figure indicates the variation of the existing and improved power factor with respect to Bus location. For existing power factor, Residential Estate I and Mudiamenen International Limited have the highest value of 85.5 respectively. Followed by Blessed Tansi Catholic Church with the value of 85.2. While Mecho Estate/Trinity Garden Estate has lowest value of 81.5.
For improved power factor, Winderville 1 has the highest value of 92.5. Followed by New Pipeline Rumoukwurusi, Favour Avenue and Ngre Oil Filling Station with the value of 92.3 respectively. While Mecho Estate/Trinity Garden Estate and Police Toll Gate have lowest value of 90 respectively.
Mecho Estate/Trinity Garden Estate should be upgrade to the standard power factor as 85.0 since it is a residence area.
V. CONCLUSION AND RECOMMENDATIONS
a) Conclusion
This research work critically examined the improvement of power supply at Igbo-Etche Rumoukwurusi Area of Port Harcourt, Rivers State using Dynamic Voltage Restorer (DVR) method.
Based on the results obtained, it can be concluded that load flow analysis is very vital for understanding the operational nature of a network and the following area were considered vigorously; the capacitive power, power before compensation, power after compensation, current before and after compensation,% reduction in power loss, voltage drop, current consumption before and after compensation, load current before compensation, reactive current, capacitive for pf correction, current after compensated load and resistance of the compensated load, Supply r ms Current, Voltage across the load, Load Resistance, Supply current after compensation, Losses(fixed) in the distribution system, Losses(variable) in the distribution system and Ratio of losses without and with a compensator.
Similarly, distance between the fault, source impedance, transformer impedance, rated voltage, fault level at the fault position, point of common coupling and the voltage sag with respect to Bus Location were considered.
However, the use of Electrical Transient and Analysis Program (ETAP Version 12.6) and was used for simulation of the case study. Post-upgrade simulation was conducted on the network to ascertain the improvement of power supply on the network and the results were significantly positive.
b) Contribution to Knowledge
While other works focused on various power quality problems faced by the utilities such as harmonic distortion and different disturbances, other devices like D-STATCOM (distribution static compensator) which is represented by FACTS devices is used in power system as power electronic shunt device that absorbs and provides reactive power to solve power quality problems in power distribution systems, this work has considered the Power quality is the combination of voltage quality and current quality. Power quality is the set of limits of electrical properties that allows electrical systems to function in their intended manner without significant loss of performance or life.
c) Recommendations
Based on the findings of this work, the following recommendations are made to ensure the overall improvement in the operation of the network:
Mecho Estate/Trinity Garden Estate should be upgrade to the standard power factor as 85.0 since it is a residence area.
New Pipeline Rumoukwurusi current and capacitive power should be compensated and upgraded while Winderville 1 percentage (%) reduction in power loss should be upgraded.
Total Energy Limited has the highest value of voltage drop of 4.12V, it should be upgraded and reduced to the barest value since it is a construction company.


