INTRODUCTION
Oysters are a very important malacological resource in Senegal (Diadhiou 1995, Diop 2024). In the Casamance estuary in southern Senegal, they remain the main bivalve mollusc harvested. Their harvesting is a very ancient activity in this area (Cormier-Salem 1990). This activity is an integral part of the local culture and economy, with local communities having taken advantage of the natural resources of their marine environment, particularly oysters, to meet their food and economic needs for centuries (Diatta 2018). Despite their importance, biometric and ecophysiological data on Crassostrea tulipa remain limited in the Casamance estuary compared to other Senegalese estuarine systems such as the Sine Saloum. This lack of quantitative information limits the development of sustainable management strategies based on scientific evidence. Oysters are one of the most exploited mollusc species in this area of Senegal. The harvesting activity is mainly carried out by women, providing them with a fairly significant source of income (Diatta 2018). Harvesting is mainly artisanal, but it is becoming more professionalised with the support of local populations for bag culture in certain localities of the Saloum estuary (Thiao 2024). However, for better management of this resource, knowledge of the environment and its influence on biometrics remains essential. Understanding how environmental parameters such as salinity and temperature influence growth, recruitment and physiological condition is fundamental for predicting population dynamics and ensuring sustainable exploitation. The objective of this study was therefore to analyse the influence of seasonal and spatial environmental variability on the biometric characteristics (size structure, size–weight relationship and condition index) of Crassostrea tulipa in the southern part of the Kalone-Bliss-Kassa Marine Protected Area.
MATERIALS AND METHODS
Study site
This study was conducted on the Bliss Kassa islands located in the Casamance River estuary, specifically in the municipality of Kafountine, in the administrative region of Ziguinchor. Four collection sites (Hitou, Diogué, Haere, Niomoune) were chosen for sampling (Figure 1). This natural region of Lower Casamance belongs to the coastal South Sudanese climate zone (Sagna, 2005), dominated by a dense and highly hierarchical hydrographic network with waterways that sustain mangrove forests. The four sites were selected to represent different positions along the estuarine gradient and varying degrees of exposure to tidal flushing and freshwater influence. Niomoune and Diogué are located in the middle estuary, characterized by relatively stable salinity regimes, whereas Haere and Hitou are positioned further inland and may experience stronger seasonal fluctuations.
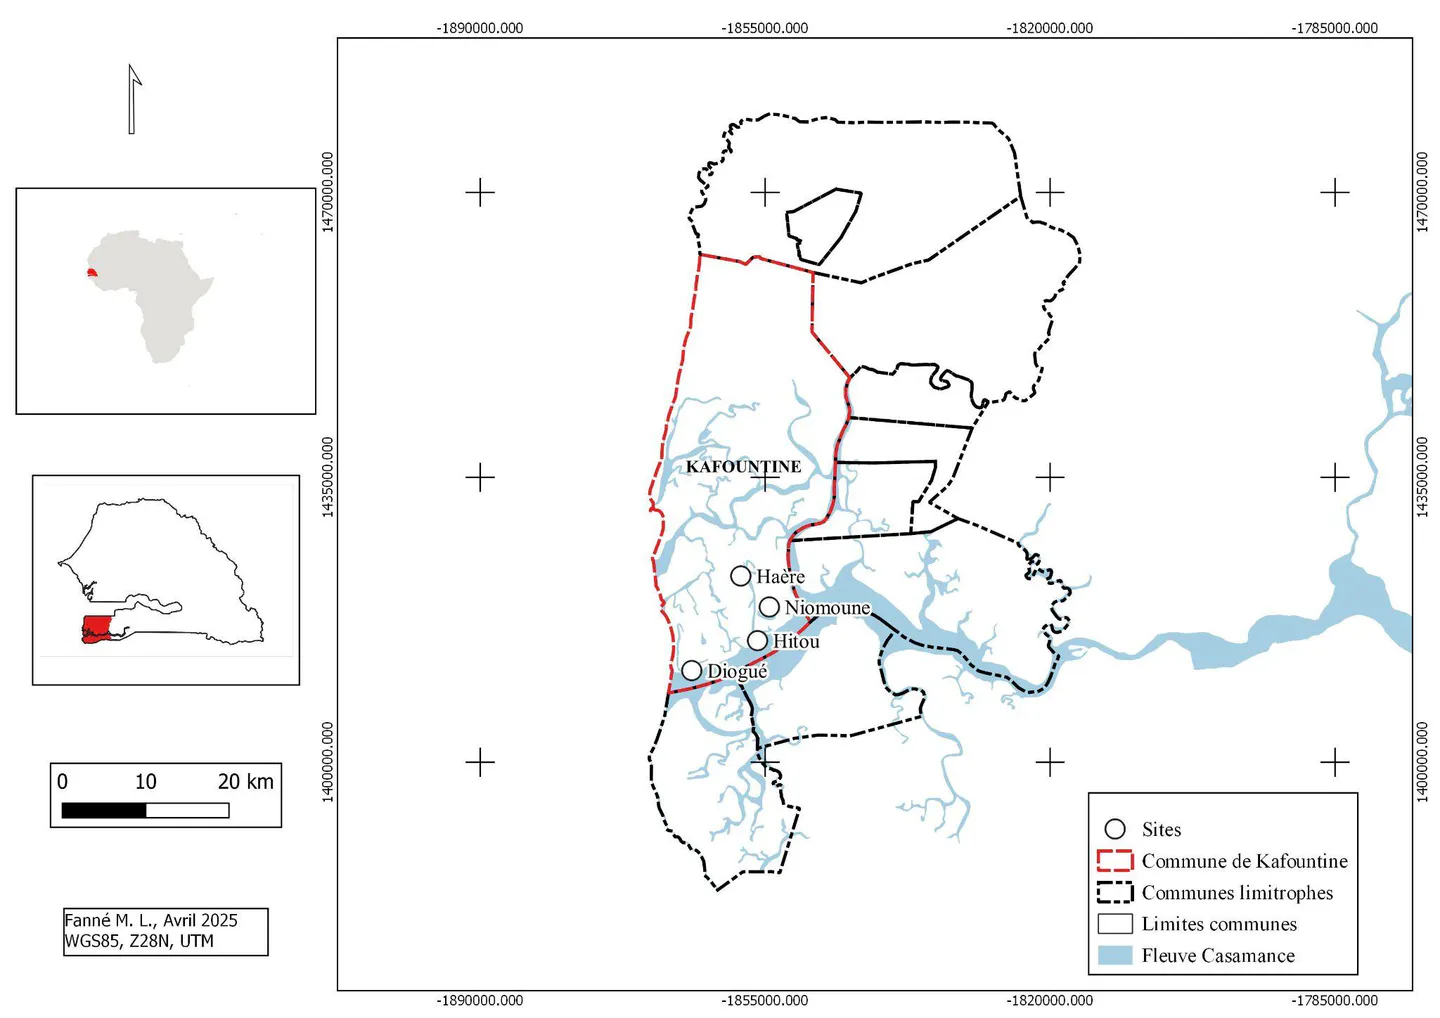
Location of the study area
Sampling protocol
Monthly collections were carried out between November 2021 and November 2023 at the four sites. The collection protocol used is that described in the participatory monitoring guide for shellfish exploited in West Africa by Diouf et al 2009. At each site, three linear metres of mangrove (A, B, C) 30 metres apart were used as reference points for sampling. On each linear metre, oyster samples were taken from the most heavily loaded root, the moderately loaded root and the least heavily loaded root. The individuals sampled were counted, measured (height) using a calliper (0.01 mm accuracy) and weighed on a precision scale accurate to 0.01 g. At the same time, temperature and salinity measurements were also taken after each sampling.
Size frequency
To determine the size frequencies of the shells, the measurements were divided into size classes at 10 mm intervals. The following formula was used to calculate the size frequencies:
Where is the frequency (%), is the number of individuals in a given class, and is the total number of individuals.
Size-weight relationship
In many fish species, weight () is related to size () (represented here by height) by a non-linear relationship of the form . The coefficient is often close to 3. It expresses the relative shape of the species’ body. When it is equal to 3, growth is said to be isometric. When it is different from 3, growth is allometric. A coefficient greater than 3 indicates better growth in weight than in length, and vice versa if is less than 3 (Ricker, 1980).
Condition index
The condition index is a biometric index widely used in fisheries biology. In shellfish farming, it is commonly used to indicate the degree of shell filling in animals (Merzouki et al., 2009). In other words, it is an index that reflects the variation in the amount of tissue in an animal (Bodoy et al., 1986). For this study, the condition index was calculated for individuals taller than 30 mm. The choice of this height range refers to studies by Oates (2013), Martinez et al. (2012) and Octaviana Sionaloa et al. (2013), which found that the size at first sexual maturity is around 30 mm. The formula used for this calculation is the AFNOR variability index (Soletchnika et al 2001), which is as follows:
is the condition index,
corresponds to the wet weight of the flesh,
corresponds to the total weight. This formula also corresponds to the equation of yield per recruit () proposed by Freeman (1974).
RESULTS
Inter-site biometrics
Size class distribution by site
The size class distribution was unimodal, centred on the 30–50 mm size classes, with maximum relative abundance in the 30–40 mm class (~29%) followed by the 40–50 mm class (26%) for all sites (Figure 2A). Classes smaller than 20 mm and larger than 70 mm were poorly represented. Only the Hitou site recorded individuals belonging to the size class (100–110 mm) with 0.01% of the total (Figure 2B). The average size during this sampling was 40.07±12.62 mm. The Hitou site had the highest average size with 42.56±13 mm, followed by the Haere site with an average of 41±13.12 mm. The Niomoune and Diogué sites had the lowest average sizes, at 38.68±11.04 mm and 38.02±13.05 mm, respectively.
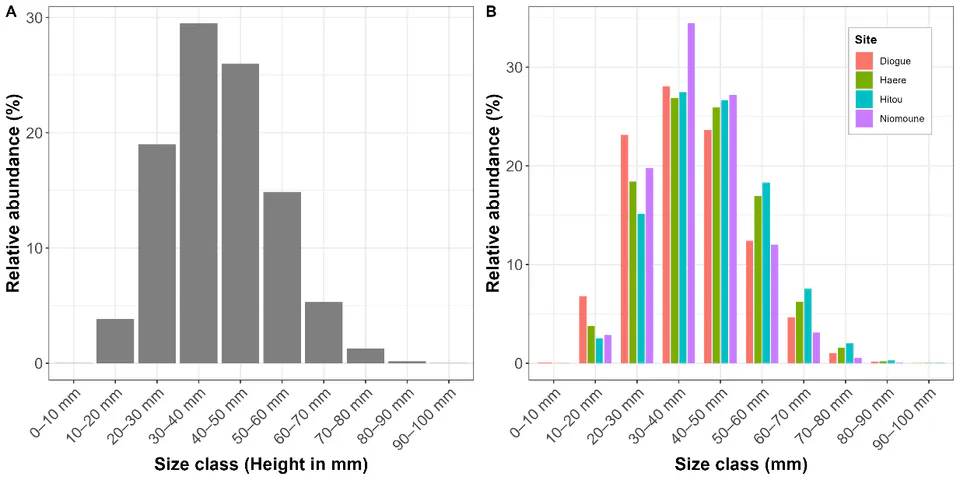
Relative distribution of size classes by site
Seasonal variation in abundance between villages
Figure 3 illustrates the variation in relative abundance (%) between villages and seasons, using box plots grouped by climatic period: cold-to-warm transition (CHT), cold season (CS), warm-to-cold transition (HCT), and warm season (HS). There is clear heterogeneity in both time and space. The cold-to-warm transition (CHT) had the highest median values, particularly in Niomoune (13%), followed by Haere and Hitou (11% each), while Diogué had a slightly lower median (9%). This period was also marked by the largest interquartile range, with maximum values reaching up to 35%, particularly in Niomoune.
During the cold season (CS), a general decrease in relative abundance was observed. Medians fell to around 6% for Diogué and Haere, 7% for Hitou, and remained slightly higher in Niomoune (11%). During the hot-cold transition (HCT), abundance levels remained relatively low but showed a slight recovery, particularly in Diogué (11%) and Niomoune (9%). Hitou and Haere had medians of around 7% and 6%, respectively. The hot season (HS) was characterised by moderate abundance, with medians around 6% in Diogué and Haere, 10% in Hitou, and around 7% in Niomoune. However, maximum values remained high in Niomoune (>35%).
From a spatial perspective, Niomoune stood out throughout the year as the village with the highest relative abundances and the widest dispersions. In contrast, Haere maintained low medians across all seasons, with reduced variability. Diogué and Hitou showed intermediate trends, with occasional peaks depending on the season.
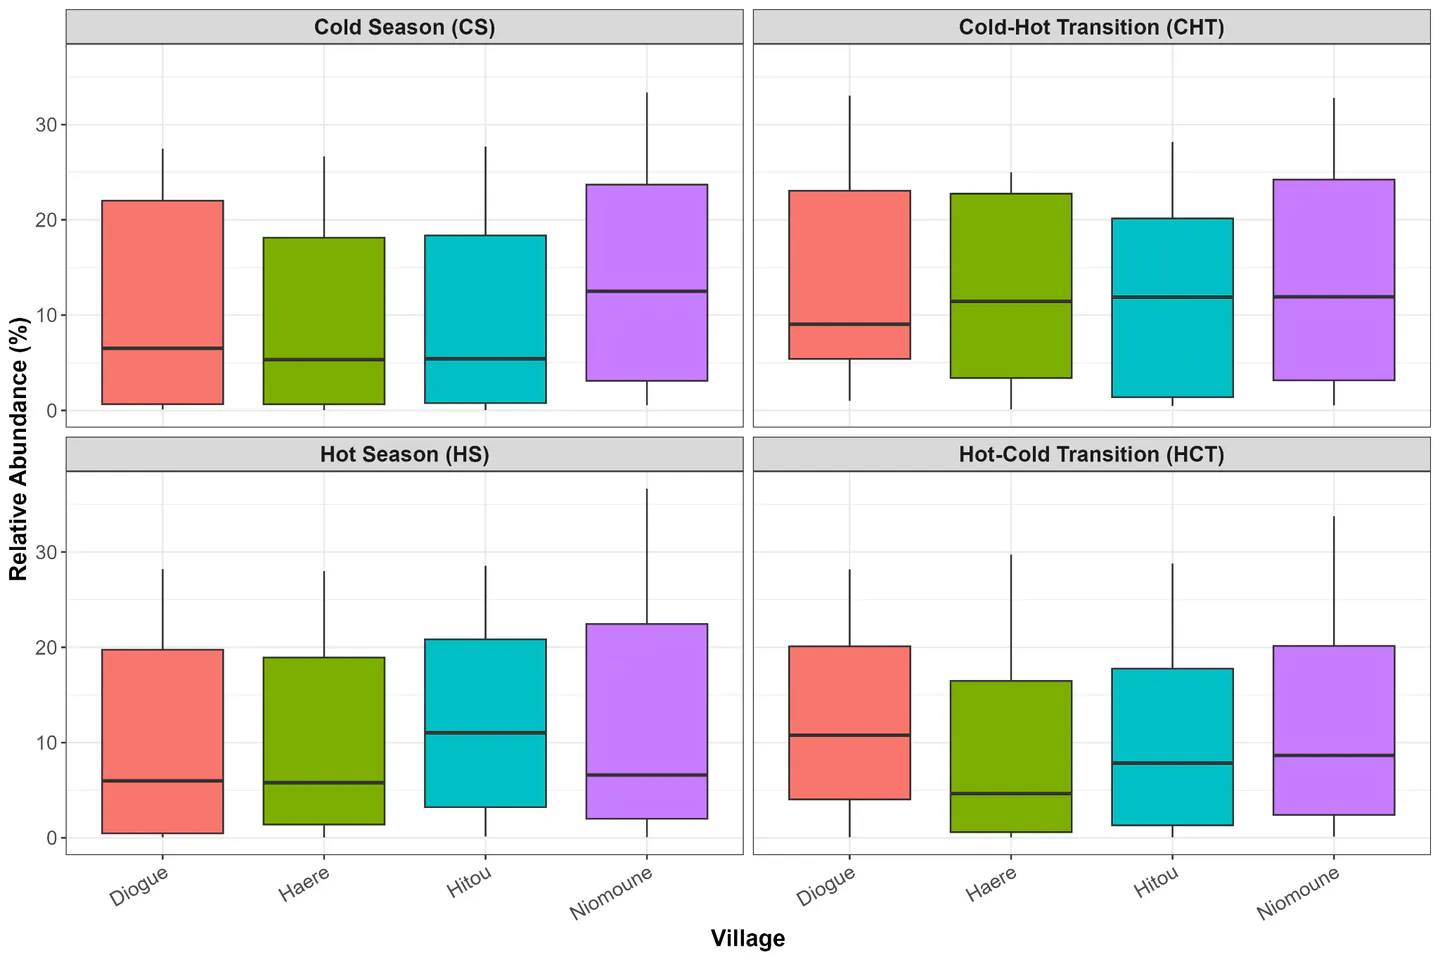
Variation in relative abundance between villages and seasons (CS), hot seasons (HS), transition seasons (HCT) and cold-hot transition seasons and villages.
Annual variation in relative abundance
Figure 4 highlights the spatial and temporal variation in relative abundance (%) over three consecutive years (2021, 2022, and 2023) for four villages (Diogue, Haere, Hitou, and Niomoune), while distinguishing between seasons in 2022 and 2023. The transition seasons (CHT and HCT) had the highest relative abundances, particularly in 2022 and 2023. Spatially, Niomoune consistently stood out with the highest and most consistent abundances, while Haere often had lower and more dispersed values.
In 2021, only the hot season (HS) was represented, and it showed relatively high abundance levels, particularly in Diogué (median = 10%, IQR [5–23%]) and Niomoune (median = 9%, IQR [4–23%]). Haere had the lowest median (5%), with a narrower distribution (IQR [2–17%]). Abundance remained relatively homogeneous between villages, with maximum values reaching 30%.
The year 2022 revealed a clearer seasonal pattern. In Diogué, medians ranged from 6% (CS) to 13% (CHT), indicating marked seasonal dynamics. In Haere, the cold-to-hot transition (CHT) and the hot season (HS) had the highest medians (11%), while the cold season (CS) dropped to 6%. Hitou showed relatively stable levels, with medians ranging between 9% and 11% depending on the season. Niomoune maintained relatively high abundances throughout the year, with a maximum median observed during the HCT (13%).
In 2023, abundance remains relatively stable compared to 2022, although medians increase slightly in some localities. In Diogué, values ranged from 9% (CS) to 14% (CHT). In Haere, an increase was noticeable, with a maximum median reaching 13% in the hot season (HS). Hitou showed high seasonal variability with a median peak of 14% in CHT, while Niomoune maintained the highest and most consistent medians (12–15% depending on the season), demonstrating interannual stability.
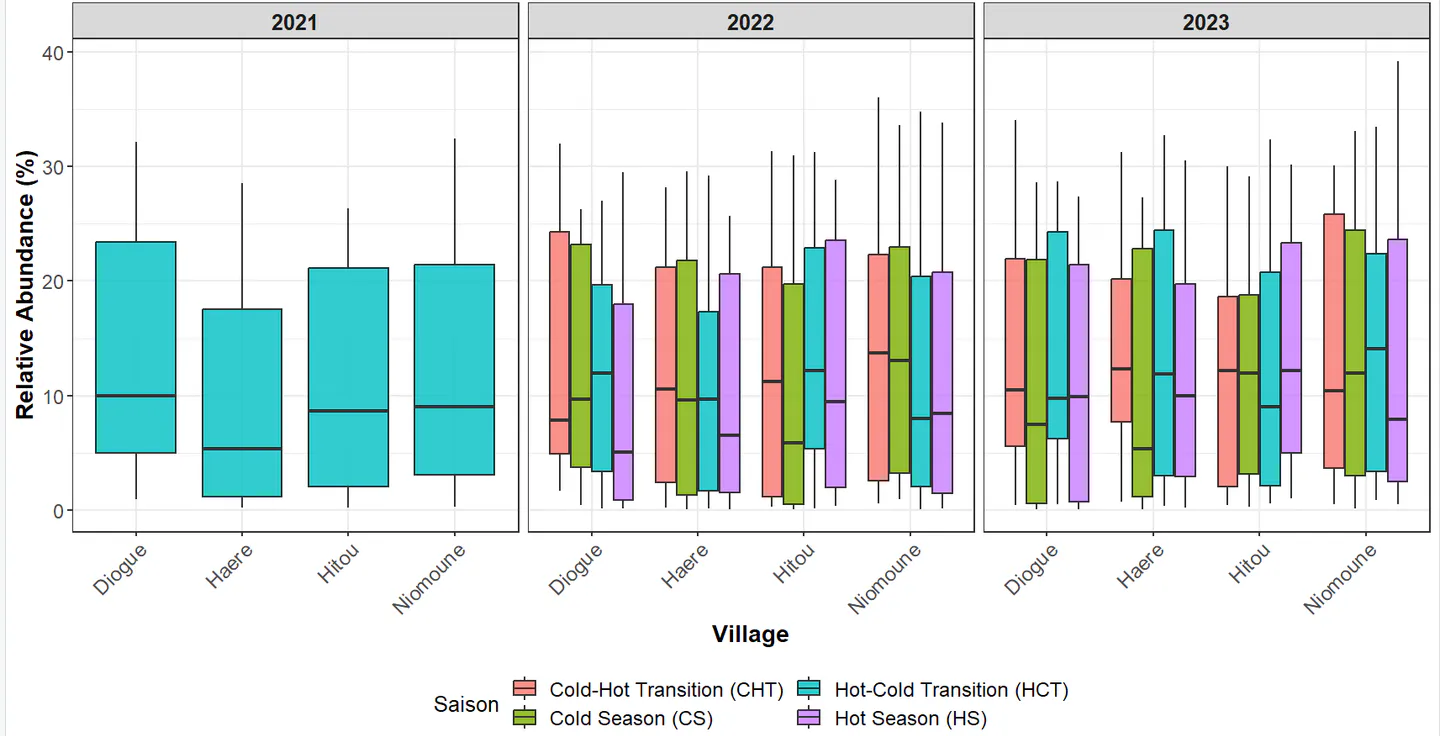
Seasonal and interannual variations in the relative abundance (%) of bivalves in four villages in the Saloum Delta (2021–2023)
Overall height-weight ratio
The overall size-weight relationship in the southern part of the Kalone-Bliss-Kassa MPA showed a minor allometry with an allometry coefficient . The coefficient of variation was positive , indicating a positive correlation between size and weight. The size-weight relationship was non-linear and monotonic. Spearman’s coefficient with a p-value less than 2.2e-16 shows that there is a very strong correlation between size and weight (Figure 5).
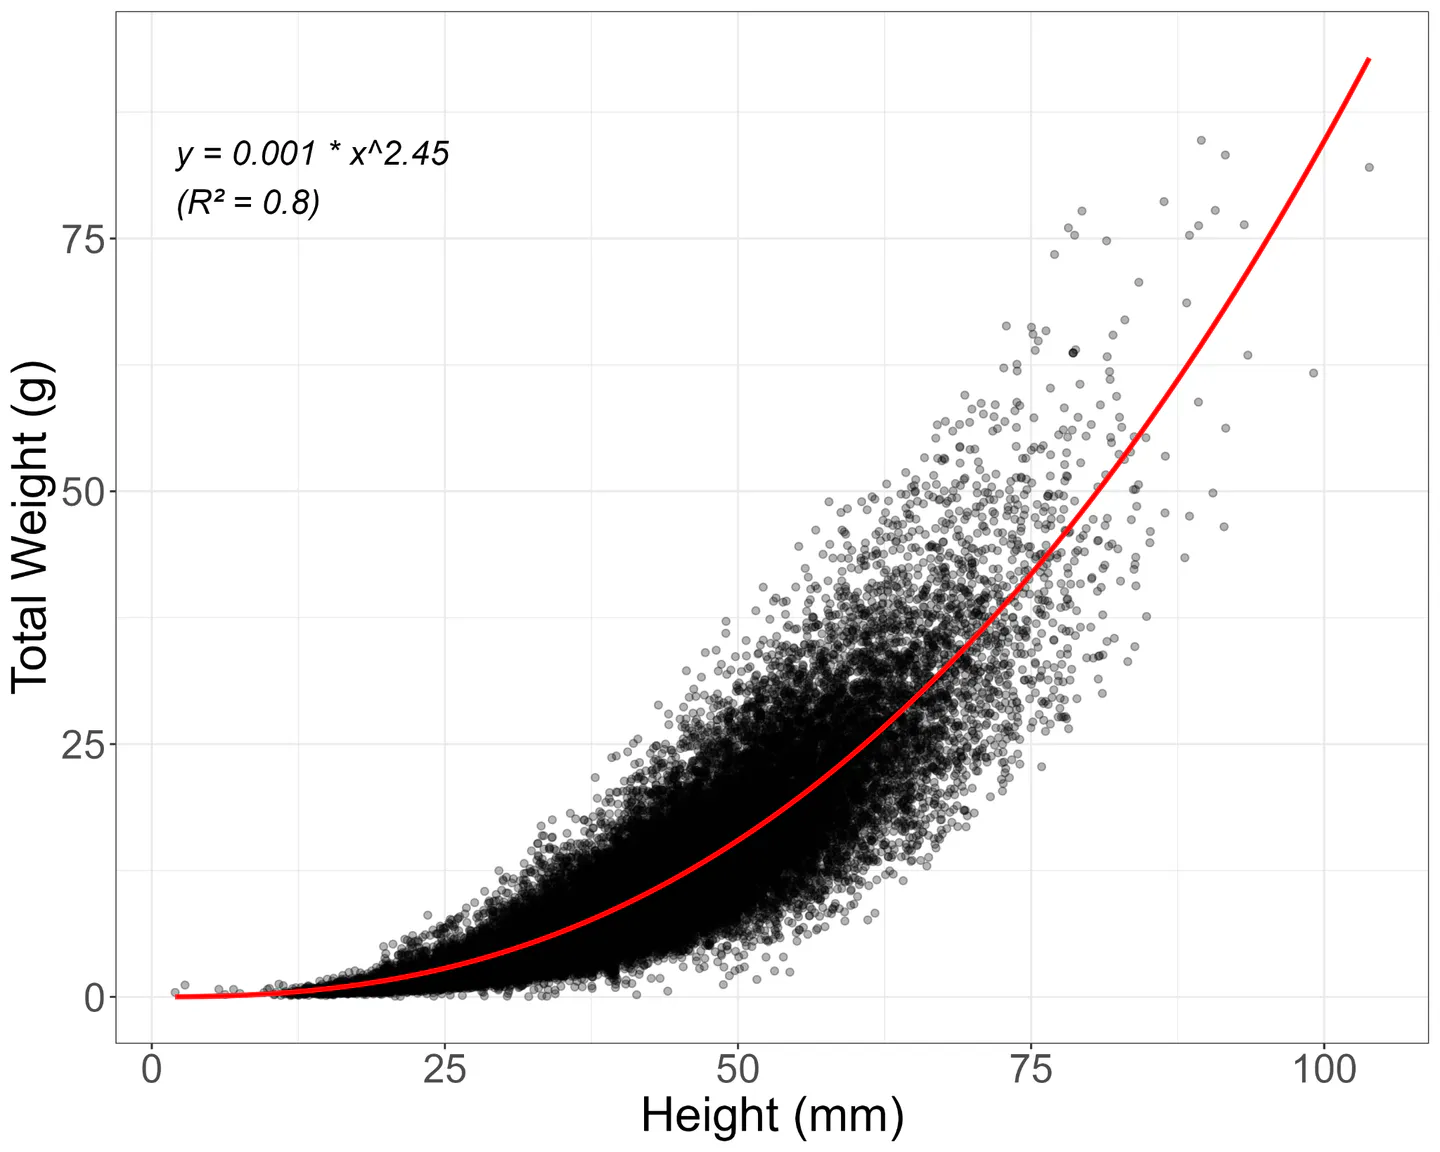
Overall height-weight relationship
Height-weight ratio by site
The size-weight relationship is a monotonic non-linear relationship at all four sites. At all four sites, the allometry coefficients were lower than expected, with at Diogué, at Haère, at Hitou, and at Niomoune. Spearman’s correlation coefficients were very high: (p-value < 2.2e-16) in Diogué, (p-value < 2.2e-16) in Haère; (p-value < 2.2e-16) in Hitou and (p-value < 2.2e-16) in Niomoune. The coefficients of variation were positive, indicating a positive correlation between height and weight (Figure 6).
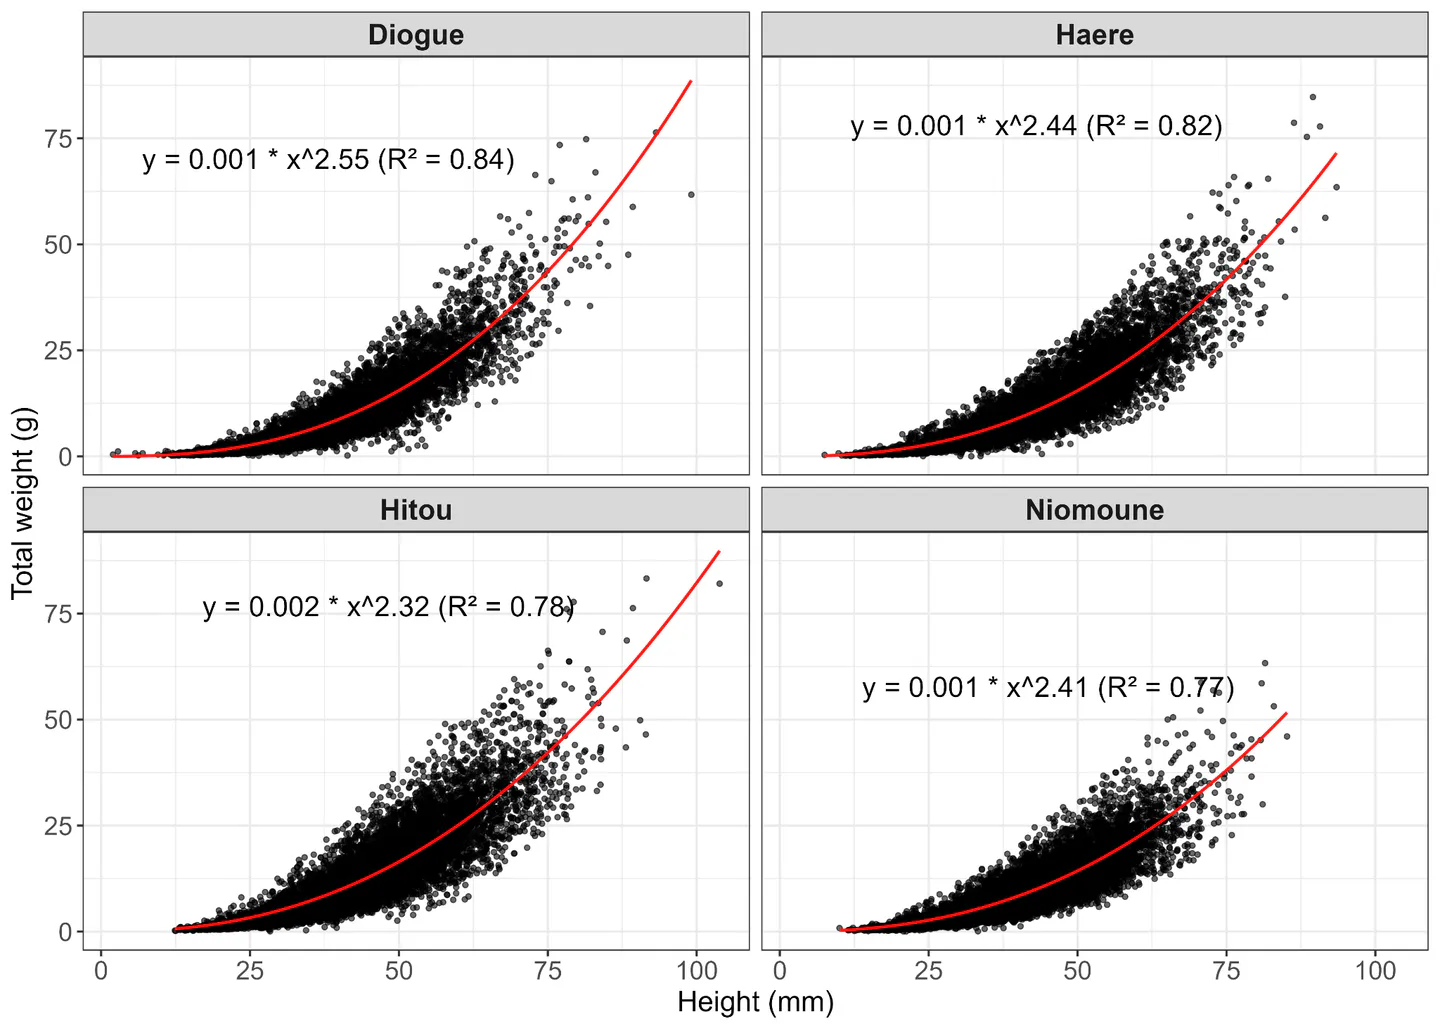
Size-weight relationship by site
Height-weight ratio according to season
The allometric relationship between the size and weight of individuals in Diogué remained strong throughout the year ( between 0.82 and 0.86). The curves show significant allometric growth in all seasons, with a higher exponential rate in the warm season (). The lowest allometric coefficient was observed during the cold season (CS), with a value of (Figure 7).
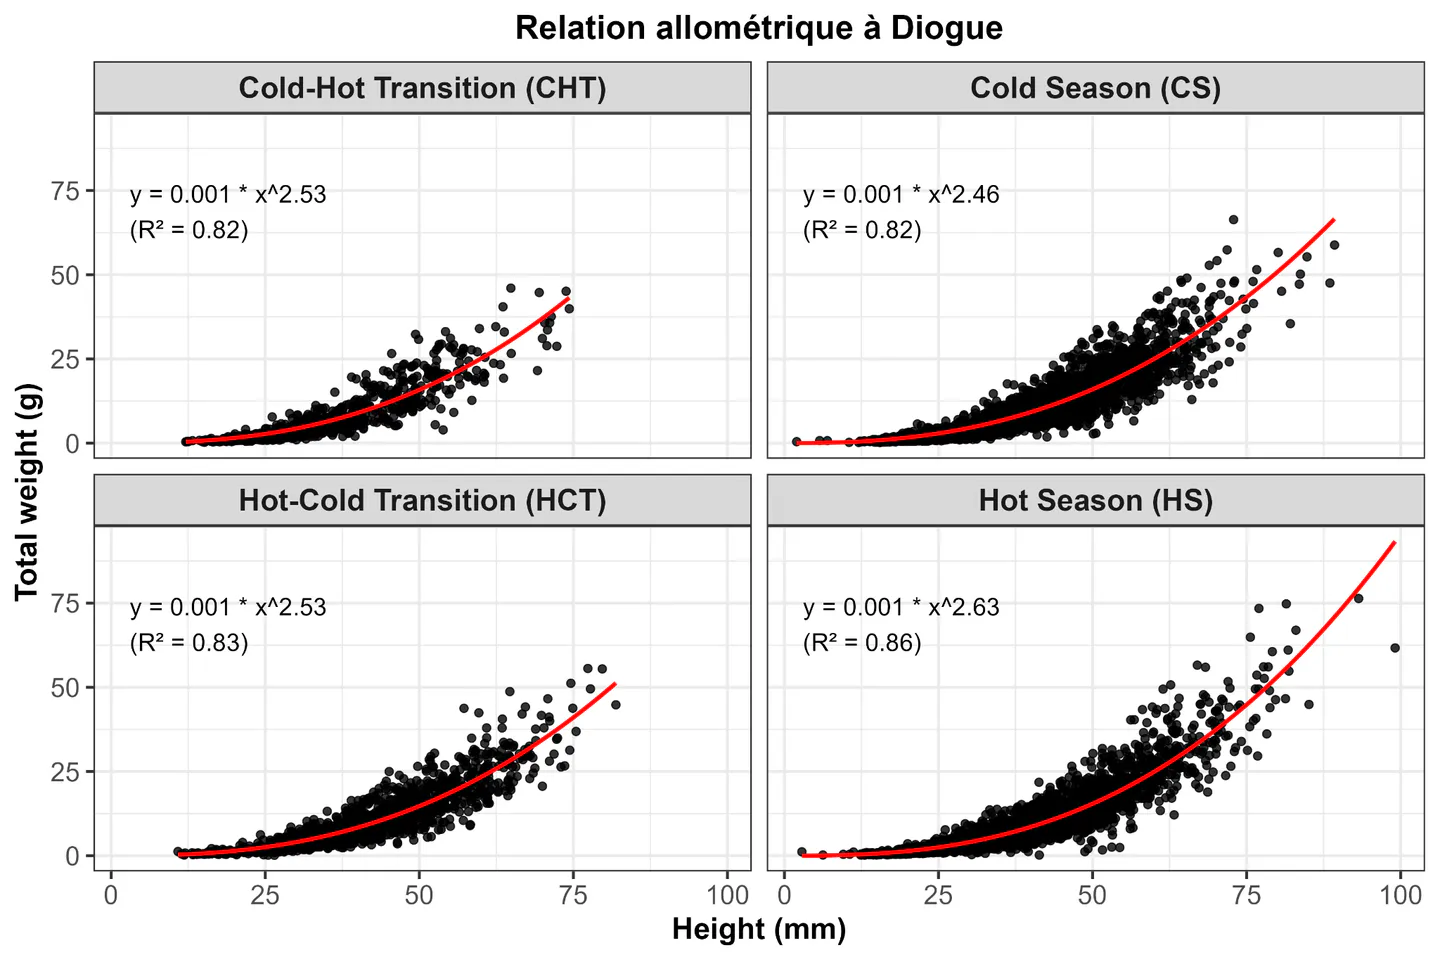
Seasonal variation in the size-weight relationship at Diogue
The allometric analysis carried out at the Haere site showed that the cold-to-hot transition season (CHT) had the strongest model fit with an and a coefficient of 2.53 (Figure 8). In contrast, the cold season (CS) had the lowest coefficient (2.40) and the lowest (0.81).
The hot-cold transition (HCT) and hot seasons (HS) had coefficients of 2.44 and 2.50 respectively, with values of 0.82 and 0.83.
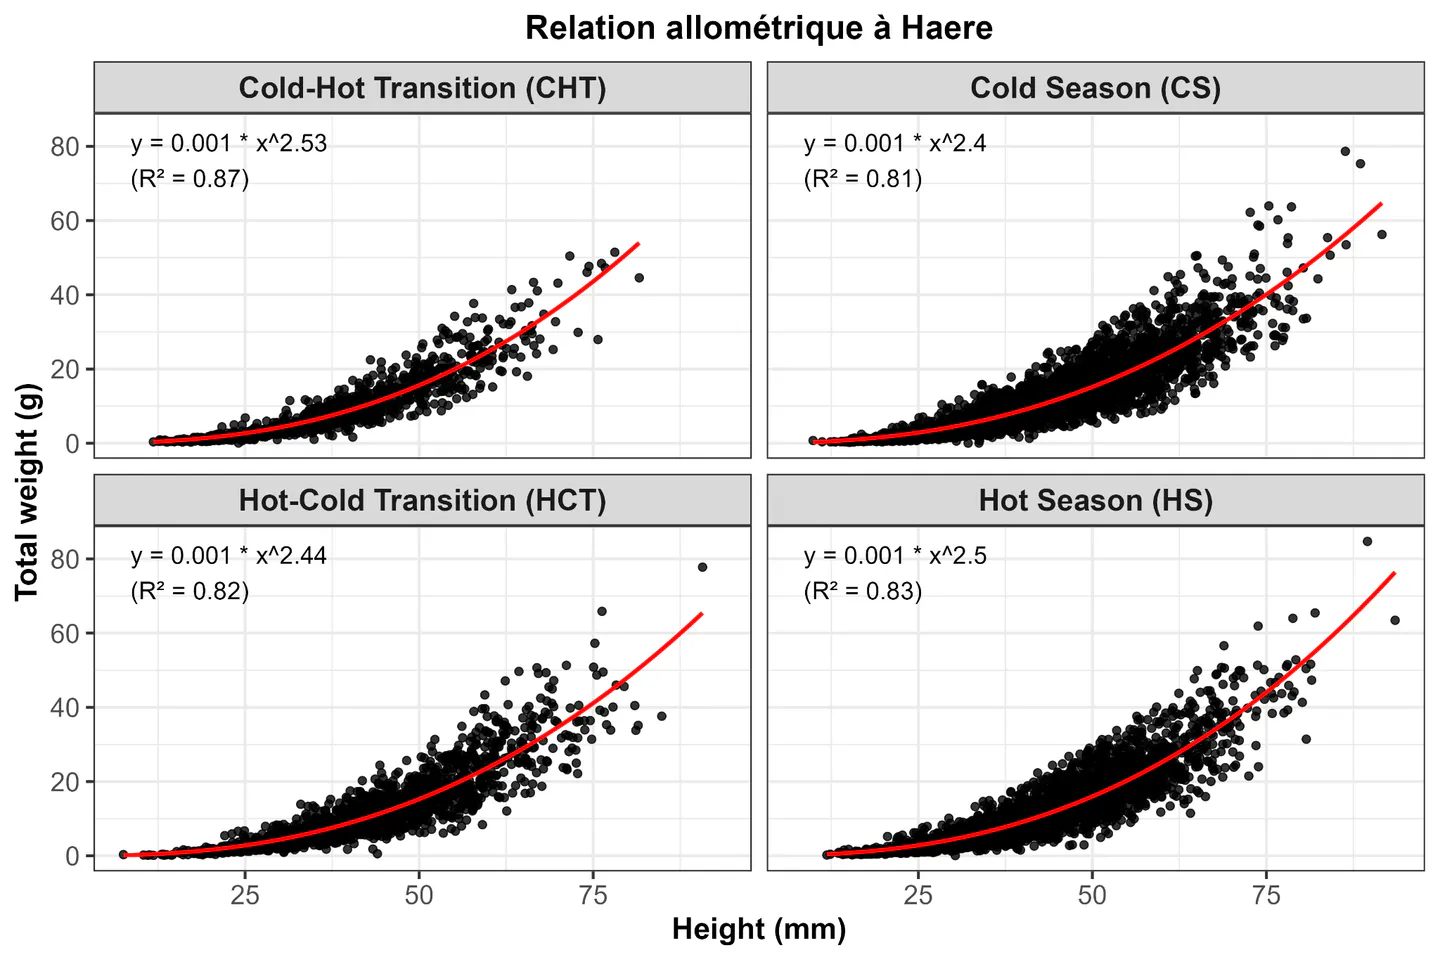
Seasonal variation in the size-weight relationship at Haere
The allometric relationships observed at Hitou revealed a significant correlation between height and total weight of individuals during different seasons. The adjusted models had coefficients of determination () ranging from 0.76 to 0.80, indicating a slightly lower fit than at the other sites studied (Haere, Diogué), but nevertheless statistically robust. The allometric coefficients ranged from 2.26 to 2.36.
The lowest coefficient (2.26) was recorded during the cold-to-warm transition (CHT), accompanied by an of 0.79. In contrast, the cold (CS), warm (HS) and warm-to-cold transition (HCT) seasons all had a coefficient of 2.32 to 2.36. The highest (0.80) was observed in the warm season (HS) (Figure 9).
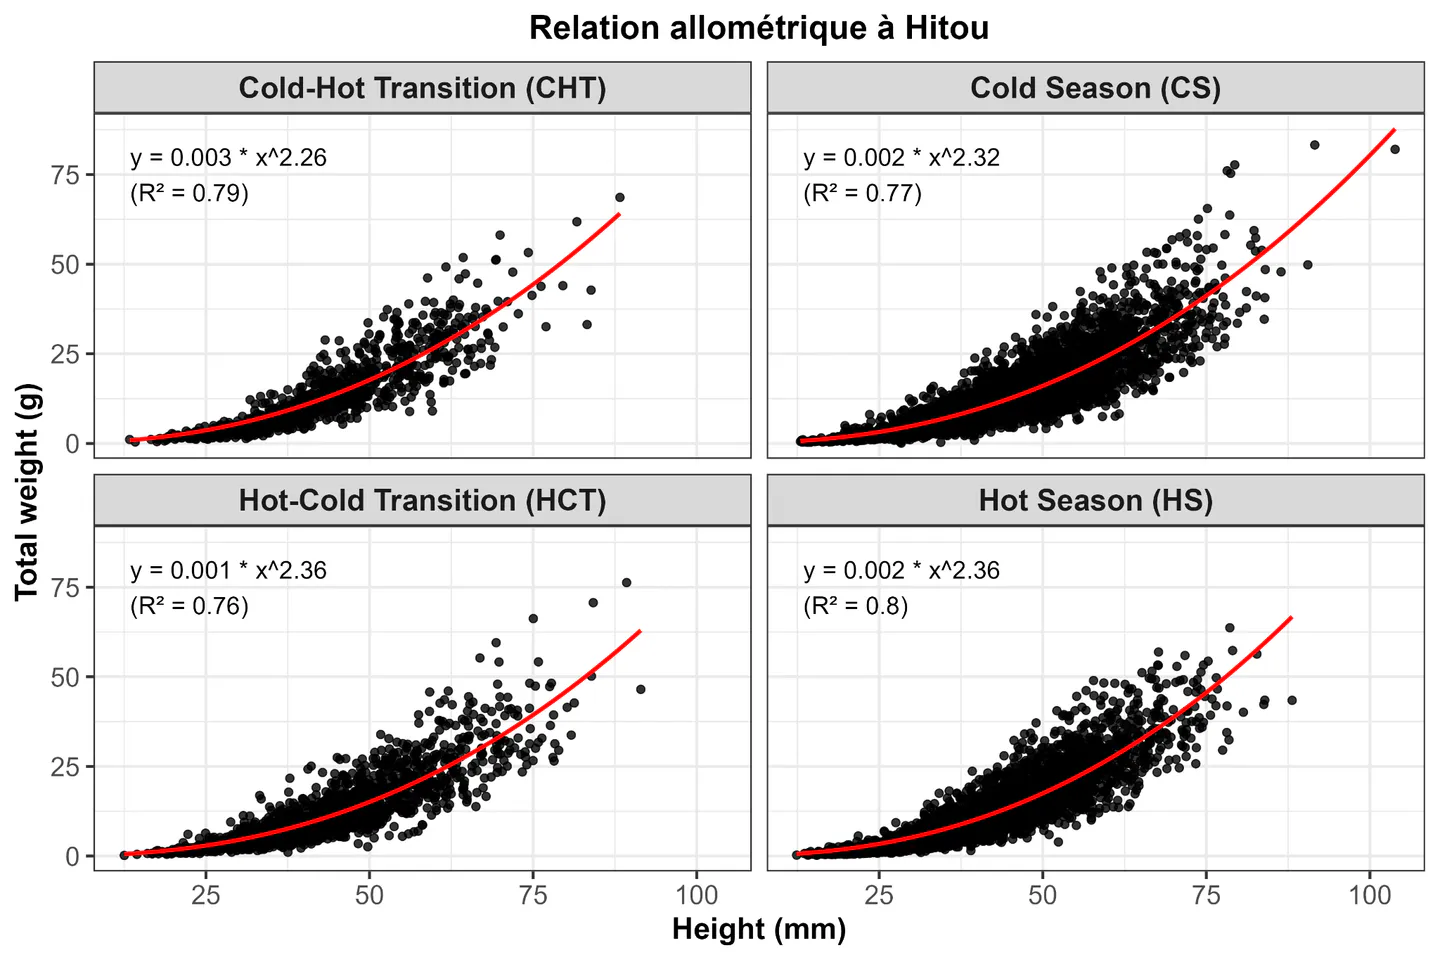
Seasonal variation in the size-weight relationship at Hitou
The allometric relationships between size and total weight of individuals collected at Niomoune showed that the allometric coefficients varied between 2.38 (during the cold season and the cold-to-warm transition) and 2.44 (during the warm season and the warm-to-cold transition) (Figure 10). The lowest coefficient (2.38) was observed during the cold-to-warm transition (CHT) and the cold season (CS). Conversely, the highest values () were observed during the warm season (HS) and the warm-to-cold transition (HCT).
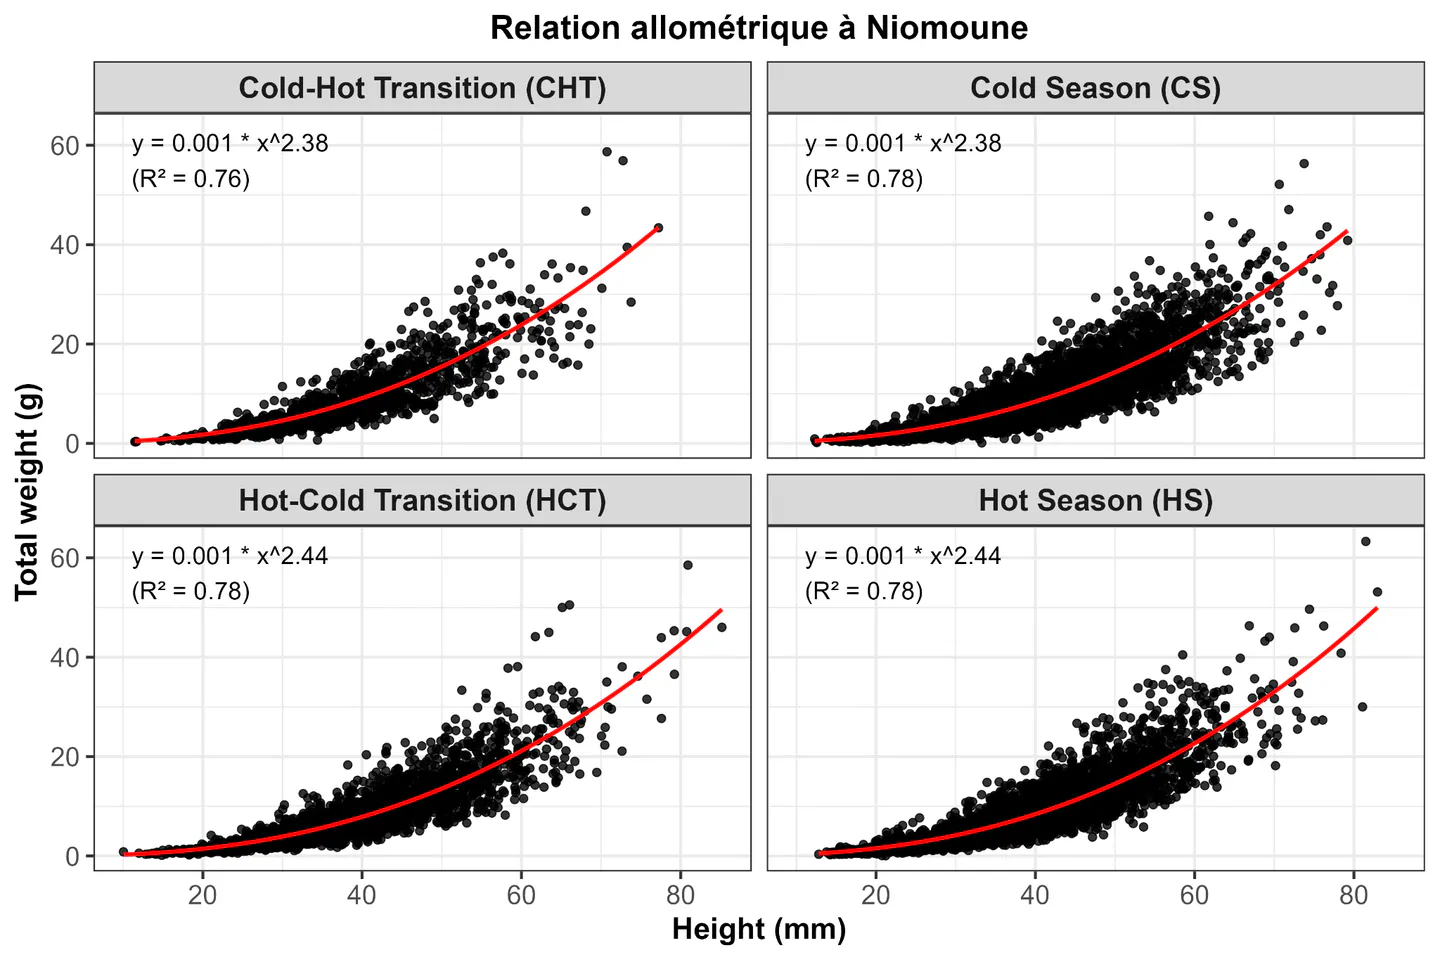
Seasonal variation in the size-weight relationship at Niomoune
Seasonal variation in temperature and salinity
The average temperature was 28.7±3.63°C and varied between 22 and 40.5‰. The lowest average temperatures were recorded during the warm-cold transition between 2021 and 2022, with 24.76±1.61 and 26.49±1.63°C, respectively. The highest average temperature was recorded during the warm-cold transition in 2023, with 34.01±4.56°C. The result of the Kruskal-Wallis test (, , p-value = 5.905e-07) showed that there is at least one significant difference in temperature between the different seasons. The results of the Dunn test show that the temperatures of the warm season of 2023 were significantly different from those of the cold seasons of 2022, 2023, and the warm-cold transition of 2021 and 2022. The temperatures of the cold season of 2022 were significantly different from those of the cold-to-warm transition of 2021 and the warm-to-cold transition of 2023. The temperatures of the 2021 warm-cold transition were significantly different from those of the 2021 cold-warm transition and the 2023 cold-warm transition.
The salinity values collected ranged from 15 to 38.6; the average salinity during this study was 29.47±6.49‰. The lowest average salinity was recorded during the warm season of 2022 at 23.15±5.33‰. The highest average salinity was recorded during the cold season of 2023 at 35.13±2.38‰ (Figure 11).
The result of the Kruskal-Wallis test (, , p-value = 4.134e-10) showed that there is at least one significant difference in salinity depending on the water season. The results of the Dunn test showed that salinity during the hot season of 2022 was significantly different from salinity during the cold season of 2022 and 2023; salinity during the hot season of 2023 was also significantly different from salinity during the cold season of 2022 and 2023. Furthermore, the salinity levels recorded during the warm-to-cold transition in 2022 were significantly different from the salinity levels in the cold season of 2022 and 2023. Otherwise, there were no significant differences.
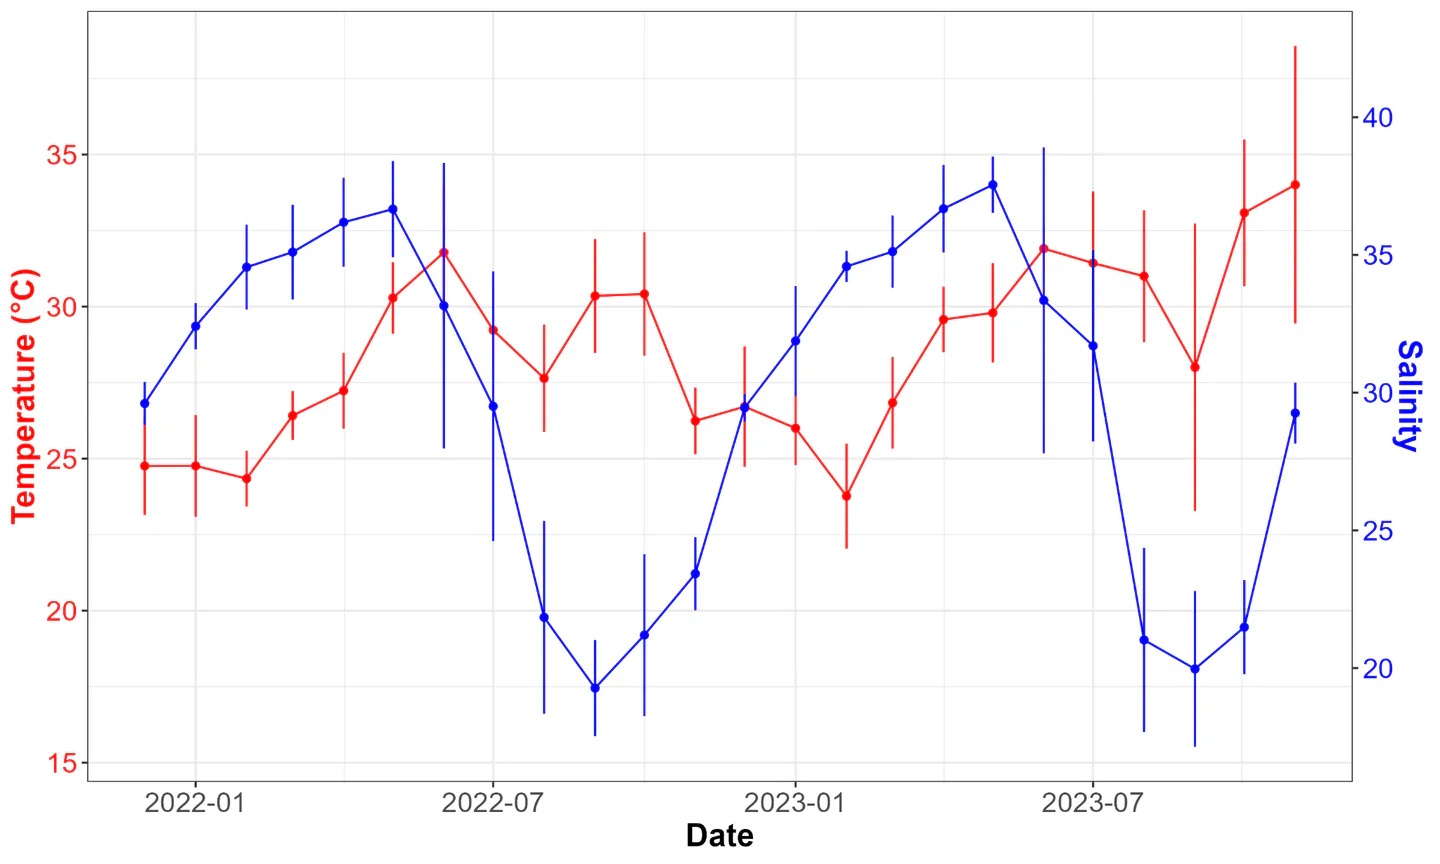
Overall seasonal variations in temperature and salinity
Spatial comparison of temperature and salinity
The seasonal variation in salinity observed in this study follows virtually the same curve at the four sampling sites, with a slight deviation at the Haere site. The site with the lowest average salinity was Haere, with 28.76±7.1‰; while Niomoune recorded the highest average salinity at 30.59±6.9‰. The result of the Kruskal-Wallis test (, , p-value = 0.6427) showed that there were no significant differences in salinity between the four sampling sites.
In terms of temperature, the Niomoune site recorded the lowest average temperature at 28.41±2.6°C, while the highest average temperature was recorded at the Diogué site at 29.19 ± 3.86°C. The results of the Kruskal-Wallis test (, , p-value = 0.7344) showed that there was no significant difference in temperature between the different sites (Figure 12).
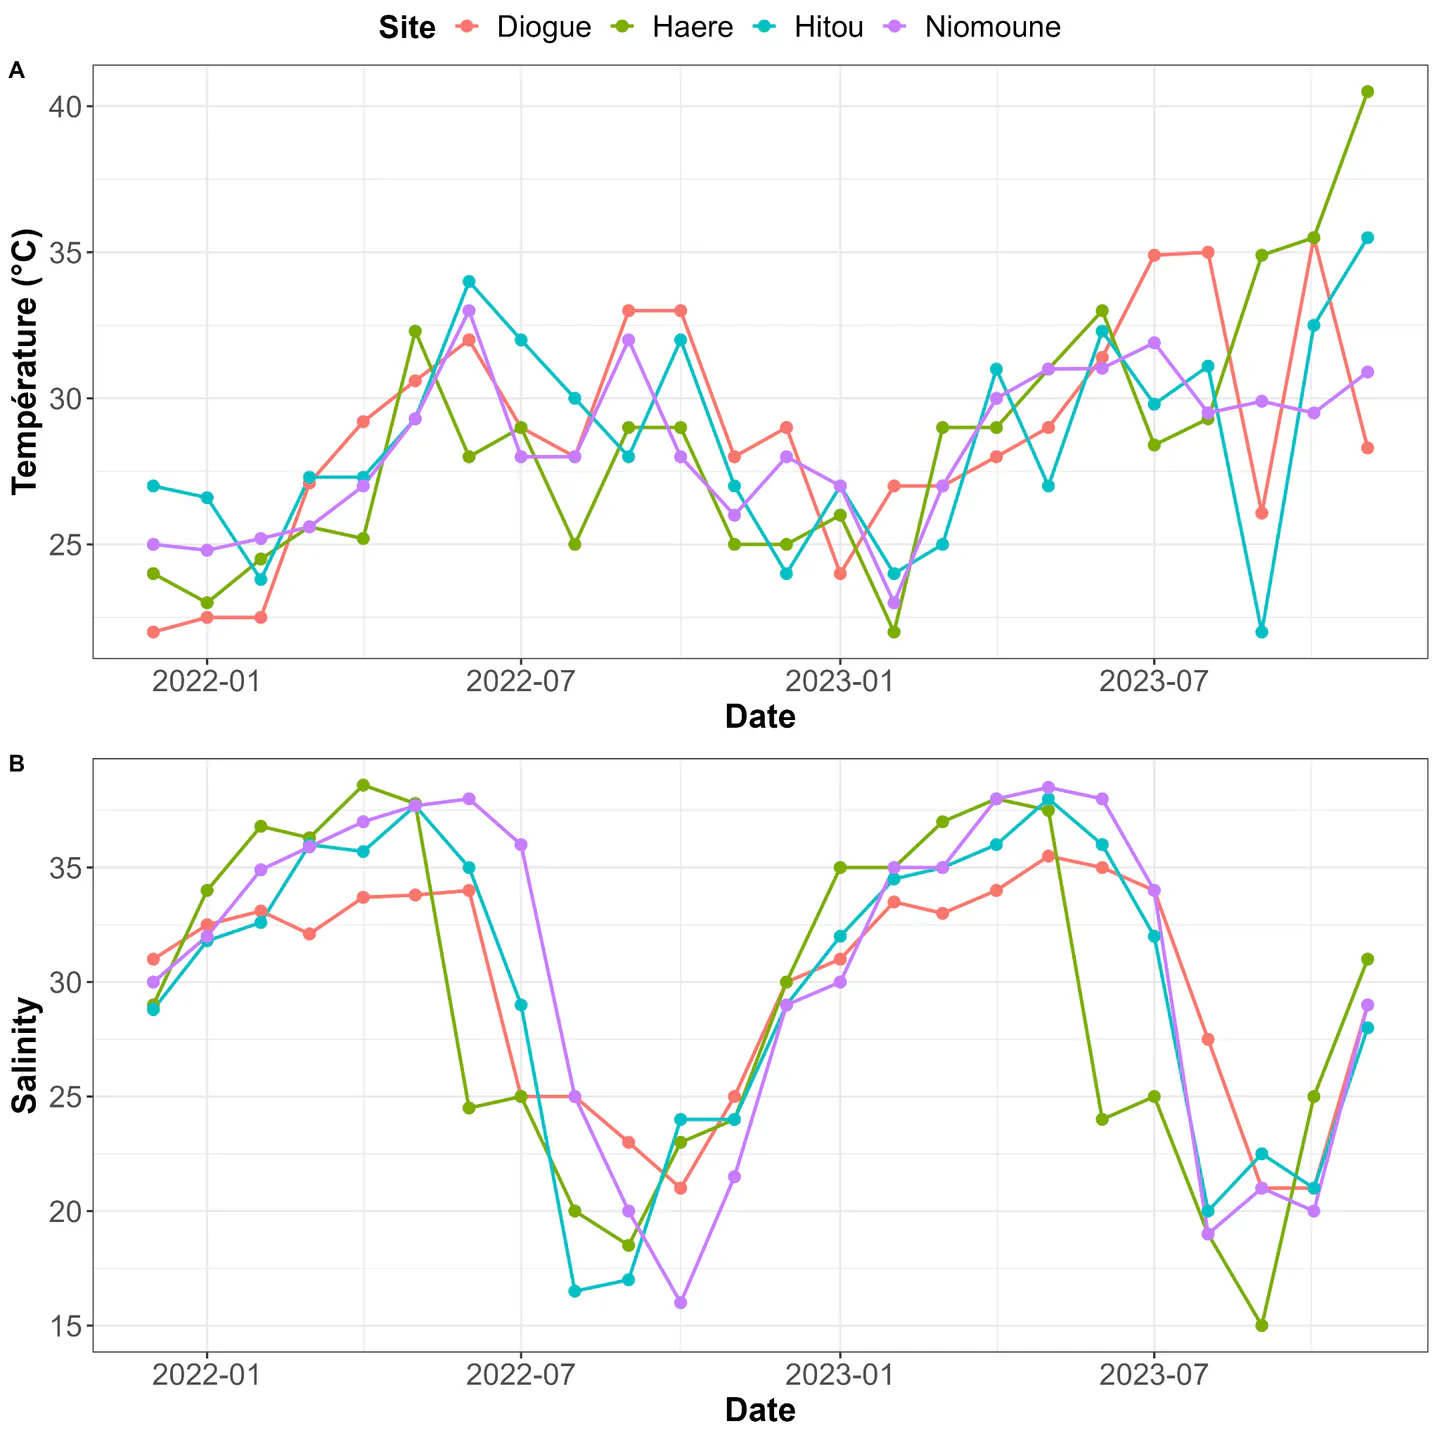
Seasonal variations in temperature and salinity by location
Overall change in the condition index (CI)
The condition index (CI) showed significant variations between different season-year combinations. The median CCI values ranged from a minimum of approximately 6.5 to a maximum of nearly 17.5. The highest value was observed during the warm-to-cold transition of 2023 (HCT-2023), with an estimated median CCI of 17.3, which was statistically significantly different from all other groups. In contrast, the lowest values were recorded for the CHT-2022 and HS-2022 groups, with respective medians close to 7.2 and 6.7. However, the difference is not significant in the Dunn test (Figure 13). A year-on-year comparison also showed that CI values were generally higher in 2023 than in 2022, across all seasons. The cold season (CS) appeared relatively stable between 2022 and 2023, with little variation in CI.
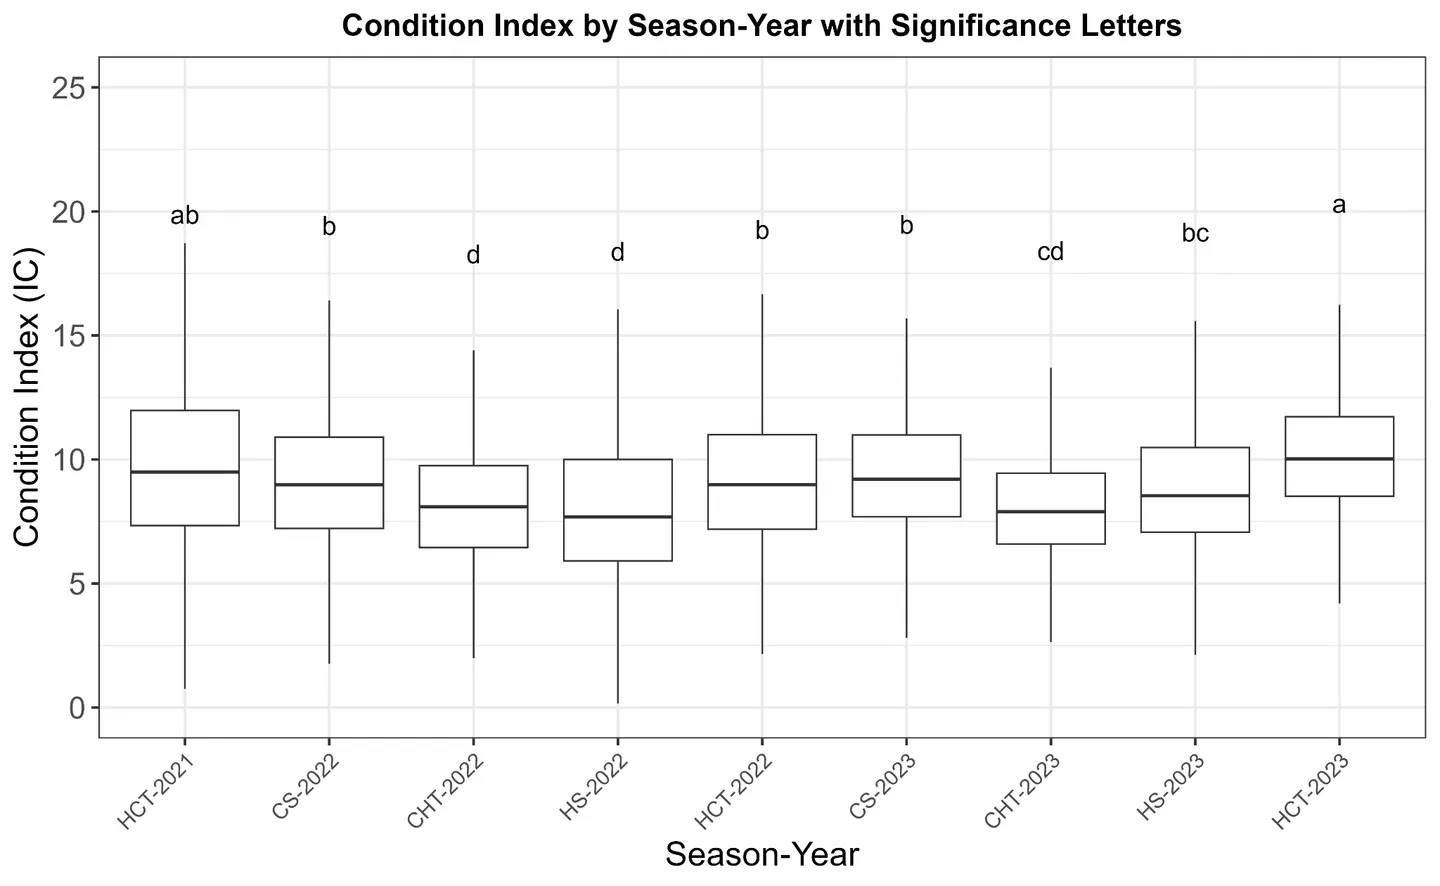
Seasonal variation in the condition index
Spatial and temporal variation of the condition index
Analysis of the condition index (%) data revealed significant variability depending on the site, season and year, as illustrated in Figure 14. A combined reading of the graphical and statistical results provided a better understanding of the trends observed. The Diogue site stood out with the highest median values, ranging from 11% to 15% across all seasons. This trend was particularly marked during the warm-cold transition (HCT), with medians reaching ~15% in 2022, a maximum of over 18%. In contrast, Niomoune had the lowest condition indices of the entire estuarine gradient. Median values ranged from 4% to 7%, with a notable drop to around 4% in the warm season (HS) of 2022, which was statistically significant (HS-CS: ; HS-HCT: ). Haere and Hitou showed intermediate but stable values, around 8 to 11%, with little pronounced seasonal variation. However, significant differences were observed at Haere in 2022 between HS and CHT (), and between CS and HS at Hitou in 2022 (). The hot season (HS) was generally associated with a decrease in the condition index at all sites, particularly in 2022: Diogué (8%), Haere (7%), Hitou (6%), Niomoune (4%). These decreases were statistically significant compared to the transition periods (CHT or HCT), with p-values to depending on the comparisons (particularly HS-CS and HS-HCT). In contrast, seasonal transition periods (CHT and HCT) were systematically associated with higher index values, particularly in Diogué and Haere, where the medians reached 13% and 10% respectively during HCT in 2022. These differences are highly significant in most comparisons (HCT-CHT and HCT-HS in Diogue: to ). Interannual variations were relatively limited. Under equivalent seasonal conditions, the values for 2023 tended to be slightly lower than those for 2022, particularly in Niomoune and Haere. In Niomoune, the median HCT decreased from 10% (2022) to ~8% (2023), and in Haere from 10% to 9%. Although these decreases were visually noticeable, some were not statistically significant ().
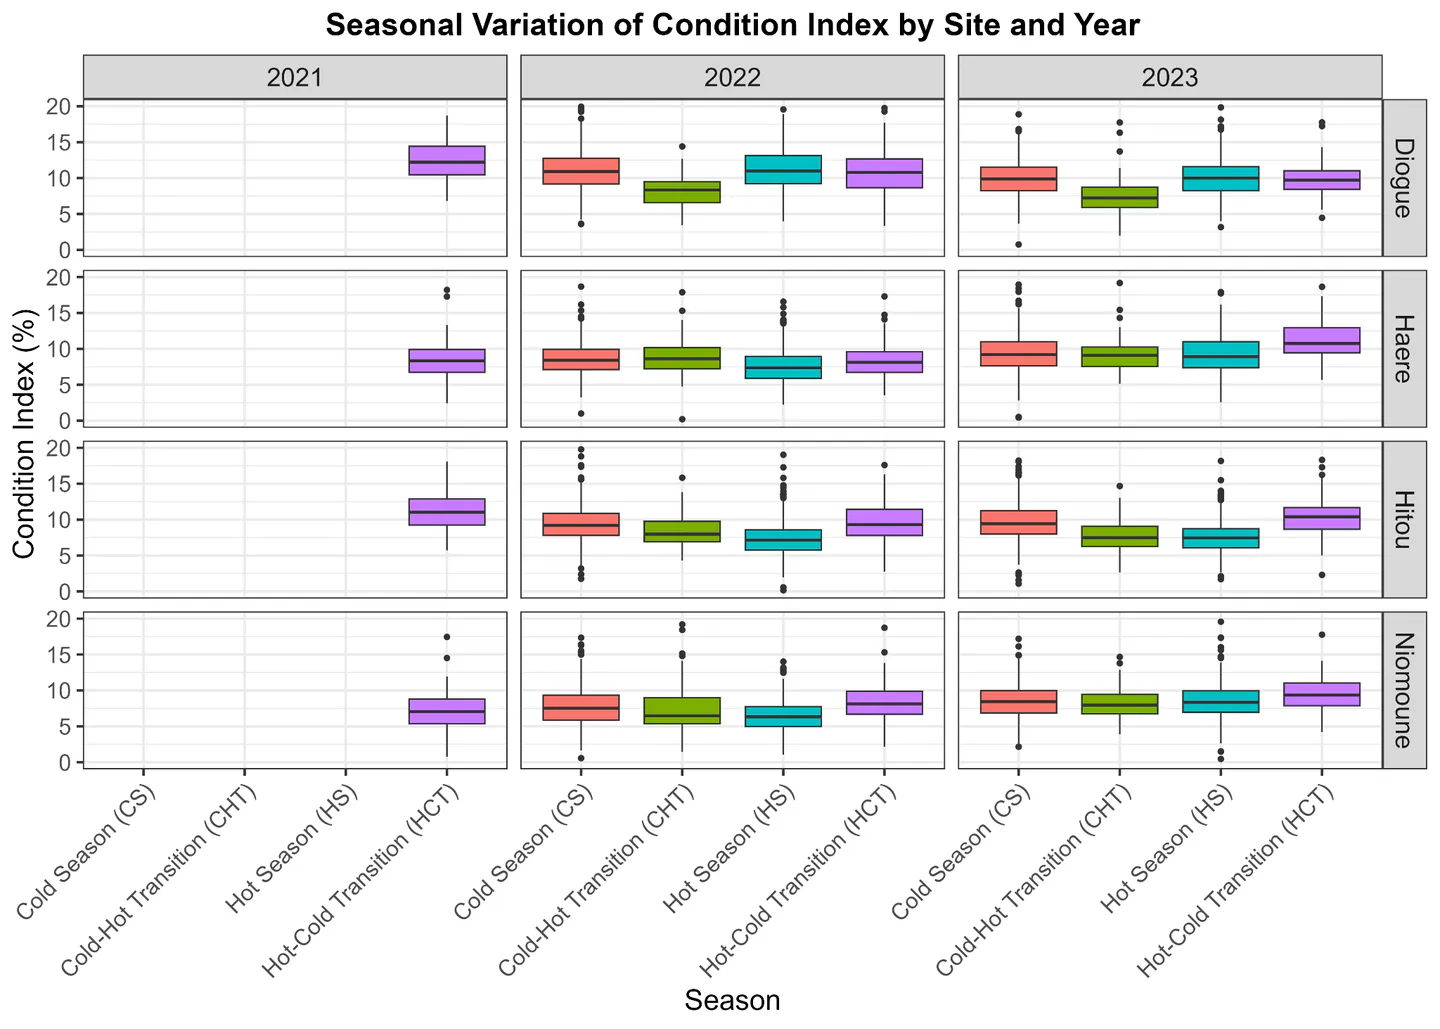
Seasonal and interannual variation in the condition index by site
| Année | Saison | p value | Signif. | p value | Signif. | p value | Signif. | p value | Signif. |
|---|---|---|---|---|---|---|---|---|---|
| 2022 | CS-CHT | 0.770 | ns | 0.753 | ns | 3E-06 | *** | 0.020 | * |
| 2022 | HCT-CHT | 0.005 | ** | 0.146 | ns | 3E-02 | * | 0.015 | * |
| 2022 | HS-CHT | 0.032 | * | 0.001 | *** | 7E-06 | *** | 0.117 | ns |
| 2022 | HCT-CS | 0.001 | ** | 0.270 | ns | 7E-02 | . | 0.938 | ns |
| 2022 | HS-CS | 0.000 | *** | 0.000 | *** | 1E+00 | ns | 0.000 | *** |
| 2022 | HS-HCT | 0.000 | *** | 0.170 | ns | 9E-02 | . | 0.000 | *** |
| 2023 | CS-CHT | 0.691 | ns | 0.824 | ns | 1E-03 | ** | 0.000 | *** |
| 2023 | HCT-CHT | 0.005 | ** | 0.030 | * | 3E-02 | * | 0.000 | *** |
| 2023 | HS-CHT | 0.661 | ns | 0.541 | ns | 1E-04 | *** | 0.809 | ns |
| 2023 | HCT-CS | 0.009 | ** | 0.035 | * | 1E+00 | ns | 0.108 | ns |
| 2023 | HS-CS | 0.999 | ns | 0.849 | ns | 7E-01 | ns | 0.000 | *** |
| 2023 | HS-HCT | 0.015 | * | 0.136 | ns | 8E-01 | ns | 0.000 | *** |
DISCUSSION
The Casamance estuary is a unique ecosystem in West Africa, characterised by increasing salinity from upstream to downstream during the dry season, unlike traditional estuaries (Descroix et al., 2020). Historically marked by persistent drought since the 1970s, this system experienced the beginning of rainfall recovery between 2000 and 2017 (Descroix et al., 2016; Solly et al., 2018), confirmed by recent measurements (Descroix et al., 2020). However, freshwater inflows remain modest, leading to high spatio-temporal variability in physico-chemical parameters, particularly salinity and temperature, which profoundly influence the distribution and physiology of farmed bivalves such as Crassostrea tulipa.
The average annual salinity recorded during this study (29.47 ± 6.49 ‰) remained lower than that of standard seawater (35.17 ‰; Millero et al., 2008), with seasonal extremes ranging from 15 to 38.6 ‰. This seasonal variability depended mainly on the intensity of precipitation and evaporation (Thior et al., 2019; Diop et al., 2024). The Casamance estuary has a reverse seasonal functioning, i.e. it acts as a reverse estuary only during part of the year, mainly in the dry season (Descroix et al 2020). During this period, evaporation exceeds freshwater inflows, leading to salt accumulation and a gradual increase in salinity upstream (Thior et al., 2019). On the other hand, during the rainy season, freshwater inflows from precipitation and, to a lesser extent, from small tributaries such as the Soungrougrou, significantly alter salinity. The gradient then returns to ’normal’, with lower salinity upstream than downstream. This seasonal alternation in the hydrological regime confirms the partially and temporarily reversed nature of the Casamance estuary (Descroix et al., 2020).
Our results corroborate this dynamic: the lowest salinities were recorded during the warm-to-cold transition (HCT) at the end of the wet season, while the highest salinities were recorded during the cold-to-warm transition (CHT), just before the first rains. This trend corresponds to the observations of Diop et al. (2024) and Thior et al. (2019), who also highlighted the importance of rainfall in the redistribution of salinity within the system. Compared to the seasonal monitoring of salinity carried out in the permanent reverse estuary of the Sine-Saloum by Sane et al., 2023, the Casamance showed similar variations in salinity, but the amplitudes of variation were greater in the Saloum. In the Saloum, salinities often exceeded 40‰ upstream over the same distance at the mouth (Descroix et al., 2020; Panfili et al., 2004; Sané et al 2023).
Water temperature followed a pattern mainly dictated by regional marine currents, in particular the Canary Current (cold) and the Equatorial Counter Current (warm) (Domain, 1980; Ndoye, 1996). Our results show a lower average temperature during the warm-cold transition (HCT) in 2021, while maximum temperatures are observed in HCT 2023 and CHT 2022. This pattern corresponds to observations in Saloum, where similar values are reported for the same period (Sané et al., 2023). However, differences appear in amplitude and thermal inertia. In Casamance, the temperature seems slightly more stable than in the Sine Saloum Delta.
The temperatures observed in this study showed a significant seasonal shift compared to those reported in Mauritania by Ould Sidi (2005). In Mauritania, minimum temperatures were recorded during the so-called ’cold’ season (February-April), a period corresponding to the maximum activity of the upwelling system associated with the Canary Current. Conversely, our data reveal that the lowest temperatures in Casamance were observed during the warm-cold transition (HCT) of 2021 (November-December), and the highest during the following seasonal transitions, notably HCT 2023 (despite data limited to November) and the cold-to-warm transition (CHT) of 2022.
According to Ould Sidi (2005), the cold season corresponds to the period when temperatures were lowest and the hot season corresponds to the hottest temperatures. Therefore, for the present study, the lowest average temperature was recorded during the 2021 warm-to-cold transition, and the highest during the 2023 warm-to-cold transition, followed by the 2022 cold-to-warm transition, given that the temperatures of the 2023 warm-to-cold transition only concerned the month of November. The Canary Current is observed on the coasts of Portugal, Morocco, Mauritania, Senegal and Gambia (Ndoye, 1996). The Canary Current system, which extends over more than 3,800 km of coastline, is located along the west coast of Africa, from Gibraltar (36°N) to southern Senegal and Guinea-Bissau (10°N), with a northern extension along Portugal and north-western Spain called the western Iberian upwelling system. The Canary Islands system is subdivided into two zones separated by the Cape Verde frontal zone. Our study area is located in the less saline and more mineral-rich waters of the Central South Atlantic (ECSA) (Fraga and Establier 1974, Ndoye 1996). In this area, upwelling is at its maximum between February and April (Demarcq and Faure, 2000; Ndoye et al., 2014). The differences observed could be explained by the fact that the study site is located at the southern limit of the Canary Current’s zone of influence and very close to the arrival zone of the equatorial countercurrent, which may explain why the coldest periods are between November and December and the warmest temperatures are in June. This reflects the strong influence of the equatorial countercurrent on this area.
This particular geographical position, at the junction between subtropical and equatorial influences, gives Casamance a thermal signature that is distinct from that observed in Mauritania, but also slightly different from that of Saloum, located further north. This climatic singularity directly influences the living conditions of benthic organisms, modulating both their metabolism and their tolerance to environmental stress. The condition index (CI), which reflects the physiological and nutritional status of oysters, is a widely used integrative variable for assessing the performance of bivalves in response to environmental factors (Bodoy et al., 1986). In the present study, seasonal and interannual analysis of the CI of Crassostrea tulipa revealed marked spatial and temporal variations, revealing the influence of abiotic constraints and the ability of oysters to adapt to their environment.
Over the three years of the study (2021–2023), the condition index was higher between the warm-cold transition and the cold season (November to May). Contrary to the results of other studies where the CI is positively correlated with temperature (Lango, 1999), the current data showed an inverse relationship: a decrease in CI during thermal peaks and an increase during cool periods. This could be explained by thermal stress or reduced food availability during the warm season. On the other hand, CI seems to be more closely correlated with salinity, with notable increases when salinity decreases slightly (23.15–35.13 ‰), which could promote reproduction, as observed in other bivalve species (Lucas & Beninger, 1985). The variation in the condition index in bivalves is mainly linked to sexual maturation. Increasing values of the condition index (CI) are interpreted as indicating the onset of gonadal development, while decreasing values indicate the expulsion of genital products (Paulet et al., 1992).
The average salinity levels recorded ranged from 23.15 to 35.13 ‰, suggesting that at these sites, the decrease in salinity could be a factor favouring egg laying. Over the period 2021–2023, the condition index shows a downward trend from year to year, particularly in Niomoune and Hitou. This trend could be linked to an amplification of recent climatic extremes, such as the lengthening of the hot season or the intensification of rains at the end of the rainy season, reducing the optimal periods for growth.
Analysis of the size distributions of Crassostrea tulipa in the study area reveals a generally young population, with a marked predominance of medium size classes (30–50 mm). This bell-shaped demographic structure is typical of an actively growing population with regular recruitment, as also observed by Thiao et al. (2023) in the Saloum Delta. The low abundances in the extreme classes (0–20 mm and >70 mm) could result either from high post-larval mortality (Diadhiou, 1995), or increased collection pressure on large individuals, a phenomenon already highlighted by Diop (2024) and Diouf & Sarr (2009) in areas exploited by coastal communities. The comparative approach between sites (Diogue, Haere, Hitou, Niomoune) revealed notable differences in population structure. Niomoune, with a strong dominance of the 30–40 mm classes, appears to harbour a population in full recruitment. This profile could be linked to favourable ecological conditions, such as good trophic input and stable salinity (Millero et al., 2008; Diop et al., 2024).
Diogué and Hitou showed a distribution skewed towards larger sizes, indicating prolonged growth and less anthropogenic pressure, perhaps linked to local management practices or more limited accessibility (Diatta, 2018; Cormier-Salem, 1990).
Haere showed a mixed profile, where the demographic structure seemed to reflect a balance between recruitment, growth and exploitation.
The variation between sites highlights the influence of temperature and salinity on growth and recruitment dynamics. Temperature plays a key role in the metabolism, gametogenesis and growth of oysters. As Soletchnik et al. (2001) pointed out, an optimal temperature promotes gonadal development and reproduction. Conversely, excessively high temperatures (>32°C) can induce heat stress and slow growth. In the southern Casamance region, surface temperatures range from 24°C in the cool season to over 30°C in the hot season (Thior et al., 2019). This thermal regime appears to be compatible with the biology of C. tulipa, but could limit physiological performance at seasonal peaks (22°C and 34°C during this study), temporarily reducing feeding and reserve deposition (Oates, 2013; Octaviana et al., 2013). Salinity is an even more decisive factor for C. tulipa, a euryhaline species that is nevertheless sensitive to sudden fluctuations. According to Diop et al. (2024), the Casamance estuary functions in the opposite way, with salinity levels reaching 40 PSU in the dry season, compared to less than 10 PSU in the wet season. Such extreme variations directly affect filtration, reproduction and the survival of juveniles (Millero et al., 2008 ; Diadhiou, 1995). The Niomoune and Diogué sites, which are subject to more stable salinity and temperature levels due to their location in the middle estuary, had a higher proportion of individuals in full growth. Conversely, more inland sites such as Haere could experience greater osmotic shocks during the rainy season, affecting recruitment and causing massive mortality (Thiao et al., 2023; Thior et al., 2019). The size-weight relationship of Crassostrea tulipa in Casamance showed negative allometry for each station as well as for the overall study. This indicates better growth in length than in weight. For this species, allometry appears to be negative (Thiao 2023). The coefficient of variation was always positive, which indicates a positive correlation between weight and size for Crassostrea tulipa.
Relative abundance shows significant spatial and temporal variability in the Casamance estuary, with peak values occurring during the cold-to-warm transition (CHT) and a decline during the cold season. Seasonal transitions appear to promote population recovery, likely due to more favourable environmental conditions (temperature and salinity). Niomoune stands out with high and variable abundances, whereas Haere shows consistently low and stable levels, reflecting stronger ecological constraints; Diogué and Hitou display intermediate patterns. Furthermore, these variations in abundance are also influenced by anthropogenic activities, as oysters constitute the main exploited bivalve mollusc species in Casamance (Manga et al 2024; Mingou 2019).
CONCLUSION
The study highlights the atypical hydrological functioning of the Casamance estuary, marked by a seasonal inversion of the salinity gradient and temperature patterns influenced by regional marine currents. These environmental conditions directly affected the physiology of Crassostrea tulipa, particularly through variations in the condition index, which varied mainly according to salinity. The demographic structure of the oyster populations showed active but spatially uneven recruitment, influenced by environmental stability and harvesting pressure. Sites with more stable conditions, such as Niomoune, favoured better growth and more consistent recruitment.
The negative allometric growth observed indicates proportionally greater shell extension than tissue accumulation, suggesting an adaptive energy allocation strategy under fluctuating estuarine conditions rather than optimal growth environments.
By providing the first integrated assessment of hydrological variability and oyster biometrics in the southern Casamance estuary, this study fills an important knowledge gap for the Kalone-Bliss-Kassa Marine Protected Area. These results highlight the importance of sustainable management adapted to the ecological variability of the region, particularly through the consideration of seasonal environmental variability, biologically sensitive periods and spatial differences in growth conditions to support sustainable harvesting strategies.
This work was carried out as part of the APOCEB project (Adaptation of Coastal Populations and the Blue Economy), funded by Global Affairs Canada and implemented by Cégep de la Gaspésie et des Îles.