Introduction
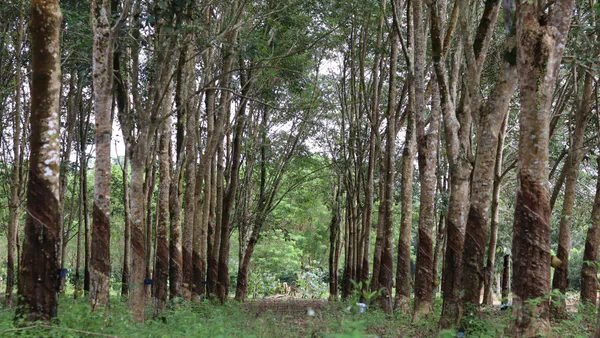
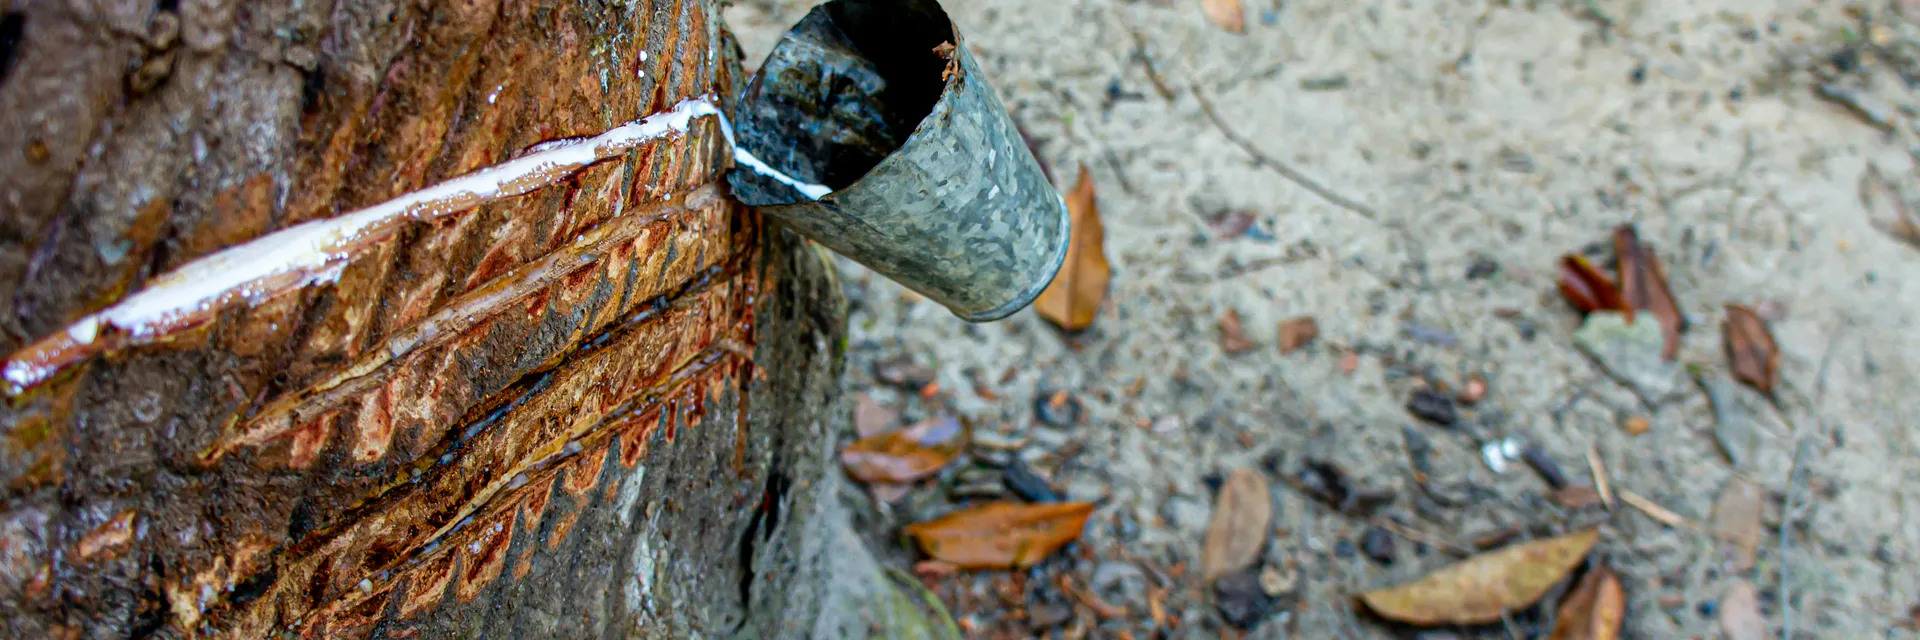
The rubber tree (Hevea brasiliensis), from which is extracted natural rubber, is native from the Amazon Region in South America, where it is found mainly in its native form. During the entire nineteenth century, and the first decade of the twentieth century, natural rubber was a product of great importance for Brazilian international trade. In this period, exports reached the same level as coffee exports. In that period this activity was an important source of employment in the Brazilian Amazon Region, in the various stages of preparation, from the bleeding of the trees, through collection and smoking of latex, to the first processing that took place within the areas of exploitation (Akers, 1912; Santos, 1980; Lemos, 1983; Pinto, 1984; Silva, 2022).
As labor was scarce in the Brazilian Amazon region, the extraction of latex from rubber trees also served as a work alternative for people plagued by the frequent droughts that occur in the semi-arid region of Northeast in Brazil. This contributed to increase the occupation of the Brazilian Amazon, with Brazilians coming from that region (Araújo, 2015).
Brazil led the production of natural rubber, probably starting in the late 1700’s, but the first register occurred in 1827 when it was recorded that Brazil exported 31 tons of natural rubber that year. Until the late 1870’s exports of natural rubber were totally dominated by Brazilian production from the Amazonian rubber native trees. This period was characterized by low levels of production and productivity, shortage of labor and high production costs. This was translated into the high prices at which natural rubber was sold until the year 1910. (Akers. 1912; Barham, Oliver, 1994; Collier, 1968; 1993; Dean, 1987; Frank, Musacchio, 2022; Lemos, 1983; Santos, 1980; Silva, 2022; Sudhevea, 1983; Weinstein, 1993).
Nevertheless, exports in this period made a great contribution to the accumulation of foreign exchange and the formation of wealth in the country. The exportation of natural rubber extracted from the native rubber trees in the Amazon region transformed small cities of that time, such as Belém and Manaus, into large centers, which were even compared, in the early 1900s, to European cities such as Paris, for example (Weinstein, 1993).
In 1913, natural rubber production in Southeast Asia surpassed rubber production in Brazil. Also, in 1913 natural rubber prices began to decline, initially quite rapidly (from 1913 to 1947), and then remained low from 1948 until the present days (Akers, 1912; Gonçalves et al 2021; Collier, 1968; Dean, 1987; Morales, 2002; Oliveira et al, 2012; Pandolfo, 1994; Santos, 1980; Lemos, 1983; Weinstein, 1983).
Natural rubber was an important raw material in the world and was of great relevance in the period of industrial development from the end of the nineteenth century. This development, especially of the automobile industry, made the international demand for natural rubber grow rapidly. According to Weinstein (1983), the export economy resulting from this confluence of economic forces generated unprecedented commercial and demographic growth in the Amazon region and made this part of Brazil one of the most promising centers of commerce in this Country.
Also, according to this author (Weinstein,1983), in the early 1900’s demand continued to grow, and when in 1909/1910 the price of natural rubber reached its highest level, rubber grown in plantations in Southwest Asia appeared on the world market in large quantities, causing prices to fall after those years.
In 1880 began to enter the production of natural rubber from rubber plantations grown in Southeast Asia, with higher productivity, and lower costs, which increased production, stimulated by the nascent automotive industry. In this phase the world production grew quite significantly, and the Brazilian production also participated in this phase with a growing expansion of Brazilian exports, although already with evident loss of competitiveness in terms of worker productivity and exploited trees (Lemos, 1983).
In previous research, Lemos (2023), using ARIMA models in both series, described the trajectories of exports and prices of natural rubber exported by Brazil between 1827 and 2021. In that study, the hypothesis tested was that errors in price forecasting would lead to errors in export forecasting. To achieve its objectives, the study estimated two models ARIMA (0,1,1) , to forecast exports and prices of natural rubber exported by Brazil during that period. The evidence found in that study showed that, in fact, errors made in price forecasting (remembering that between 1827 and 1878 Brazil held a monopoly on those exports and therefore set the prices) did indeed lead to errors in the quantities exported, both positively and negatively.
In this study, the hypothesis tested is that the price of natural rubber exported by Brazil between 1827 and 2024 is an exogenous variable and, for this reason, must have influenced Brazilian exports of this commodity during the 198 years studied. Therefore, the appropriate model for making this prediction is ARIMAX (Box and Tiao, 1975). Unlike the ARIMA model, which is univariate, this model is considered multivariate because it adds components also called exogenous variables (Bennet et al., 2014).
Until the end of the 19th century, only Brazil produced this commodity and, therefore, set its prices, which were also influenced by growing demand which will be shown in this research. Brazilian natural rubber was produced from the extraction of rubber trees, which are native to the Amazon Region. The evolution of Brazilian natural rubber’s share of the international market has gone through at least four periods.
For this reason, the series of natural rubber exports was subdivided into four periods. The first period extends from 1827 to 1878. At that stage, Brazil was the sole exporter of natural rubber produced from native rubber trees in the Brazilian Amazon. The second period begins in 1879 and extends to 1912, a period that became known as the “Rubber Cycle.” At this stage, rubber produced from rubber trees cultivated in Malaysia had already entered into the market, but Brazilian exports still dominated and showed their greatest expansion throughout the analyzed series.
Thus, Brazilian exports of natural rubber, in addition to being unique for 51 years (1827-1878) since records of these exports began to appear, had a major influence on both price formation and the quantities demanded by exports during the following 33 years (1879-1912).
The third period of the study begins in 1913 and extends to 1950 when Brazil became an importer of natural rubber (Esperante, 2020; Jacks, 2019). The fourth and final period began in 1951 and continues to the present day, when Brazilian exports of natural rubber collapsed and the country became a net importer of this important commodity.
Anchored in these scenarios of almost two centuries (198 years), the present research seeks to achieve the following objectives: a - estimate model to forecast natural rubber exportation from 1827 to 2025, with its price as an exogenous variable influencing these exports; b - assess the impact of prices on the export forecast model; c - estimate the heterogeneities/homogeneities of exports and natural rubber prices in each of the four periods into which the series was divided in this study; d - estimate the growth rates of natural rubber exports in the four periods in which the trajectory of Brazilian natural rubber exports was classified.
Brief historical background and perspectives
The opening of Brazilian ports, made in 1808 to friendly nations, enabled access to international trade in Amazonian rubber. According to Weinstein (1993), by the beginning of the nineteenth century, syringe and rubber balloons were already seen in Europe. Santos (1980), however, points out that there are no official records of exports before 1827, when 31 tons of rubber were exported. To have an idea of the growing demand, the Amazon region produced 156 tons in 1830, 388 tons in 1840 and reached 2673 tons in 1860 (Weinstein, 1993). At this time, Brazil had the monopoly on the production and export of rubber.
Nevertheless, this increase in exports represented little compared to what happened during the boom of the rubber cycle that, according to Gonçalves et al (2021), was from 1879 to 1912. In this period, there was the abolition of slaves in Brazil, which occurred in 1888, the fall of the monarchy and the beginning of the republic, in 1889. The abolition of slaves did not have much influence on rubber production, considering that slaves in the Amazon, according to Santos (1980), were more used in household services and in the food-producing plantation. Also, because no new slaves had entered the Amazon since 1834, due to the intense inspection by the British navy in the Atlantic.
However, the fall of the monarchy had a great influence on the collection of taxes from rubber exports. With the decentralization resulting from the federalism implanted in the Republic, the Brazilian States could keep their share of the taxes collected, which previously went directly sent to the central government. This provided greater freedom for local governments in Amazon Region States to apply internally (Weinstein, 1993). It was also during this period that the search for new areas of native rubber took place. This caused exploiters from the Brazilian Amazon, the so-called “rubber soldiers”, to enter into the neighboring Amazonian part of Bolivia’s territory, provoking a conflict that was only resolved with the signing of the Treaty of Petropolis in 1903, which gave rise to the current State of Acre (Homma, 2014; Silva, 2022).
As observed by Machado et al. (2012), rubber exports quantity only increased in the early twentieth century. In 1901, the product already had a relevant participation in Brazilian exports (21%) and, in the following years, it was only increasing in such a way that, in 1910, it came to represent 40% of everything that was exported by the country. Weaving a comparison with the export of coffee, the main Brazilian export product, it is observed that in 1910 the two commodities had almost the same share in the country’s exports (40% rubber against 41% of coffee). This shows the relevance of rubber on the national scenario (Machado et al. 2012).
It was also important in the colonization process of the Amazon region, both at the time of the end of the Empire and the beginning of the Republic (1889), and in the colonization policies adopted for the Amazon, for recruiting workers from the Northeast region, especially during the periods of droughts, when these workers were left without an occupation that would provide them with remuneration. Therefore, its importance was both: regional and national (Babcock, 1966; Santos, 1980; Lemos, 1983; Pinto, 1984).
According to Lemos (2020) it is recorded that there were 20 years of droughts in the 1800s, of which 4 years were between 1877 and 1889. In the Year 1900, also occurred drought in Northeast. Therefore, between the years 1877 and 1900 droughts occurred in 5 years. In this period a total of 96,021 people emigrated from the Northeast to the Amazon Region, probably driven by drought, with an annual average of 24,005, with the largest contingent of 45,792 emigrating in 1900. There are no records of the number of emigrants from the Northeast to the Amazon region before 1877 (Lemos, 2020).
This migratory movement, associated with the production and export of natural rubber, had a significant impact on the population of the region. According to Santos (1980), the population of the Amazon region was approximately 278,250 people in 1860. In 1910, it was estimated at 1,217,024 people. It should be noted that its great expansion occurred between 1890 and 1910, when the population went from 389,997 to 1,217,024 people. An increase of more than three times in 20 years Santos (1980).
In 1870, the British collected seeds from native Amazonian rubber trees. The rubber tree was first domesticated in Southeast Asia, in Malaysia, in 1876. All the genetic improvement technology for the species was created and the first primary clones were produced. In 1898, Malaysia placed around 145 tons of natural rubber produced from these cultivated rubber trees on the market. From that year on, competition began, with natural rubber extracted in the Amazon at a technological disadvantage compared to rubber produced on plantations in Asia (Morales, 2002).
In Brazil, only after Asian production volumes entered the market did Brazil react by conducting studies and implementing the first cultivation experiments According to Cardoso et al (2021), it was in Bahia, in 1908, at the São Bento das Lages Agricultural School, located in the Recôncavo Baiano, that the first forest of 35 rubber trees was planted. A delay of more than thirty years later. However, during this period, the largest experiment in rubber cultivation was that of Ford between 1927 and 1945 with Fordlândia. Despite receiving advantages from the governments of the time, the project did not prosper, mainly because of the attack of “leaf blight” caused by the fungus Microcyclus ulei on rubber tree plantations, among other problems. (Cardoso, et al 2022; Morales, 2002; Weinstein,1993).
According to Paula (1980), in 1892 Brazil accounted for 61% of global rubber production. In 1910, world production of native rubber was 62,000 tons, while rubber produced from planted rubber plantations rose to 8,000 tons. In 1920, native rubber production fell to 42,000 tons, while planted rubber production grew significantly to 360,000 tons. In 1923, Brazilian native rubber accounted for only 8.4% of total production, while rubber extracted from plantations increased its market share to 91.6% . In 1926, Southeast Asian countries produced 93% of global production (Paula, 1980).
Also, according to Morales (2002), in 1913, Southeast Asian rubber production surpassed that of Brazil. In 1920 the natural rubber produced in the Brazilian Amazon supplied a little more than 10% of the world supply, and that from cultivated rubber plantations was close to 90% coming, almost entirely, from Southeast Asia. Nowadays, the main natural rubber producing countries are: Thailand, Indonesia and Vietnam. The Brazilian participation had been reduced to 6.8% . From then on, there was a reversal of the export curve. Rubber extraction in Brazil went into decline, leading to the collapse of the rubber economy. As a result, the Amazon region would enter a period of deep economic depression (Conab, 2019; Furtado, 2005; Lemos, 1983; SanTos, 1980; Souza, 2010).
The impact of the rubber market can also be observed through the behavior of its export prices, throughout the expansion of production and demand. According to Machado et al. (2012), the price of the exported ton of rubber was approximately 160 pounds/ton, at the beginning of the last decade of the 19th century; at almost 300 pounds/ton, in 1900; then reached 964,5 pounds/ton in 1910, its highest price during this historical series. In fact, rubber prices, after 1910, began to experience a significant decline. The decline in international prices was due to the Asian production that, after 1910 increased significantly, becoming a strong competitor of Amazonian production, resulting in a sharp decline in Brazilian natural rubber exports (Lemos, 1983; Furtado, 2005; Machado et al., 2012).
The rapid growth in demand for rubber soon showed that the supply of natural rubber alone could not satisfy the world demands. With the imminence of the outbreak of the First World War (1914-1918), Russia and Germany adopted the strategy of investing in research to develop rubber synthetically and no longer be dependent on the production coming from Southwest Asia. Between the first and Second World War there were many advances in the production of synthetic rubber, and the technique was already mastered for large scale production (Caetano, 2021; Machado et al, 2012).
The advent of World War II (1939 to 1945) forced the American government to invest massively in the production of synthetic rubber. Between 1942 and 1944, were built 87 plants in the United States, which had an estimated overall annual capacity of one million tons of synthetic rubber. Germany, for the same reasons, also increased the production of synthetic rubber, and five large factories were built, with a total production capacity of 175,000 tons (Fonseca, 1970; Santos, 1980; Morales, 2002; Furtado, 2005).
The demand for rubber in World War II was enormous, and the product became a strategic material. The United States, in 1939, was already working on steel, oil, and rubber as essential inputs. In 1940, with the advance of the Germans, the president of the United States at the time Franklin Roosevelt, drew up a defense plan, where rubber had a fundamental role. At first, the country began to buy and stock rubber and rationalize its use. However, when Japan closed the borders of Southeast Asia, cutting off the supply of American natural rubber, the country put the rubber plan into execution. One of the measures in the plan was to accelerate the production of synthetic rubber (Lemos, 1983; Machado et al, 2012; Morales, 2002 ; Pinizzotto, Jianfeng 2021).
Another was to encourage the production of natural rubber in regions where the opposing countries in the war had no dominion, and the Brazilian Amazon was chosen to fulfill this role. Soon the American agency Rubber Reserve Company (RRC) was created to manage the production that, in 1943, became the responsibility of the Rubber Development Company (RDC) (Lemos, 1983; Machado et al, 2012; Morales, 2002 ; Pinizzotto, Jianfeng 2021).
Material and methods
The variables used in the research were: quantities exported and prices of rubber between 1827 to 2024 (198 years including the years 1827 and 2024 in the series). The information for the period from 1827 to 1980 was extracted from the research by Lemos, 1983, who used it to estimate export and price cycles for this and other commodities in his Doctoral Thesis in Agricultural Economics. Data from 1988 to 2024 were extracted from site of the Ministry of Industry and Commerce (MIC, 2025). During this period, according to the Central Bank of Brazil (BACEN, 2007), there were nine (9) different types of currencies in Brazil. The prices were updated to 2024 Real (R$), using the general price index, domestic availability (IGP-DI) of the Getúlio Vargas Foundation. Then the average exchange rate of the end of 2024 was taken and the whole price series was converted into 2024 US Dollars.
Methodology applied to achieve objectives “a” and “b”
The objectives “a” and “b” of this research are respectively: estimate models to forecast Brazilian natural rubber exportations time series from 1827 to 2024 and estimate the impacts of prices time series in this exportation.
According to Enders (2009), a time series is a collection of values, ordered in time which represent the change of a random variable over regular intervals. The main objective of time series analysis is to make forecasts. Box, Jenkins and Reinsel (1994) emphasize that this methodology establishes mechanisms in which future values of a series can be predicted based solely on its present and past values.
Some fundamental pillars are needed to understand and build accurate forecasting models. Among these foundations is the random or stochastic process, defined as a set of observations of random variables ordered in time. According to Gujarati and Porter (2011) and Wooldridge (2013), a stochastic process is considered stationary when its mean, variance and autocorrelation structure do not change over time, i.e. they remain constant over time. This fundamental property ensures that the statistical characteristics of the process do not change over time, allowing for a more robust and reliable analysis. So our first step is to analyze the stationarity of the series. This is made by using the unit root test.
Unit root test for stationarity
In the data preparation stage, it will be checked whether the series is stationary. If it is not, a transformation will be made to make it stationary using the successive differences procedure. Stationarity is then checked using the Augmented Dickey-Fuller (ADF) unit root test. Next, the autocorrelation (FAC) and partial autocorrelation (FACP) functions of the series are calculated, in addition to the graphical analysis which will allow the ARIMA model (p, d, q) to be selected. Once the identification stage is complete, the model parameters are estimated. The d parameter refers to the number of times the difference between the elements of the series was taken until it became stationary.
Calculating the autoregressive parameters p and moving average q involves analyzing the FAC and FACP functions respectively, as the FAC function will show the peaks that identify p, while the FACP function will show the peaks that identify the value of q. Finally, the result of the ARIMA (p,d,q) model is obtained (Enders, 2009; Gurajati and Porter, 2011; Li, Shuyu, et al. 2019).
Arimax model
The ARIMAX model is a generalization of the ARIMA method with the inclusion of exogenous variables (Box and Tiao, 1975). In this study, the exogenous variable is the price of natural rubber measured in period t. The main difference between this model and ARIMA is that ARIMAX has, in addition to the autoregressive (AR) and moving average parameters (MA), the input of exogenous and linear variables (Nunes, et al, 2014) ; Box and Jenkins, 1976 ; Box et all, 2015 ; Camelo et all, 2018). The ARIMAX model can be understood as a combination of the Auto-Regressive AR(p), Integrated (d), Moving Average MA(q) and Exogenous X(r) models, and can therefore be symbolized as ARIMAX (p,d,q,r ). A simplified way of mathematically representing this model in a generalized form is described in the following equation (Bennett et al 2014).
In this research, the variable is the amount of natural rubber exported by Brazil between 1827 and 2024 and will be the price of rubber in year t.
Tests to gauge the qualities of the adjustments
In the choice of statistically appropriate models, one of the criteria was to look for the most parsimonious ones, in the perspective that the smaller the number of estimated parameters, the better will be the adjustment model. There are several tools to evaluate the quality of fit and performance of a forecast model, the most relevant measures to do this measurement, and which were used in this research, are: Test of R square Mean Absolute Error (MAE); Bayesian Information Criterion (BIC); Mean Absolute Percentage Error (MAPE); and Pearson’s linear correlation coefficient between the observed and the forecasted series. All estimations in the paper were performed using Statistical Package for the Social Sciences (SPSS) software, version 27 (Box & Jenkins, 1976; Box et al., 2015; Wang et al., 2018; Wooldridge, 2015).
Methodology to achieve objective “c”
In objective “c,” the research seeks to estimate the heterogeneity of exports and prices in each period. To address this objective, the coefficients of variation (CV) of the quantities exported and the prices of natural rubber by Brazil will be estimated throughout the entire studied period (1827/2024) and for the four periods (1827/1878; 1879/1912; 1913/1950 and 1951/2024); that characterized the evolution of exports of this commodity by Brazil in the analyzed period.
By definition, the CV measures the percentage relationship between the standard deviation of a random variable and its average. The higher this percentage, the more heterogeneous or unstable the trajectory of the variable will be over time (Gomes (1985) establishes and classifies four ranges of dimensions for the CV. Very high (); High (); Medium (). Low ().
Methodology to achieve objective “d”
In this fourth objective, the study sought to estimate the growth rates (GGR) of exports and natural rubber prices in each of the 4 periods. In general, the GGR of a continuous series of a non stationary random variable (Yt), by definition, is expressed by the following equation:
In this equation “e” constitutes the base of natural logarithms; d[log(Yt)]/dT multiplied by 100 is the instantaneous GGR associated with the variable (Yt); T = 0, 1, 2, .., n). Its values will be defined in each of the periods in which the trajectories of prices and Brazilian natural rubber exports are studied. The random term also assumes the assumptions to be white noise (WOOLDRIDGE, 2015). In this study it is assumed that the geometric instantaneous growth rates (GGR) will be different in the four periods into which the trajectories of exports and prices of natural rubber have been divided.
Results and discussions
The results found in each of the research findings are presented in the chronology of the objectives pursued.
Results found for the first and second objectives
The visual evaluation of the long export series, as well as the autocorrelation (ACF) and partial autocorrelation (PACF) functions, and after performing unit root tests for both series, it was observed that neither is stationary and that only one difference (D=1) would be necessary to achieve this essential characteristic for forecasting models. Thus, the Brazilian export series and natural rubber price series are cointegrated and suitable for use in the tested model.
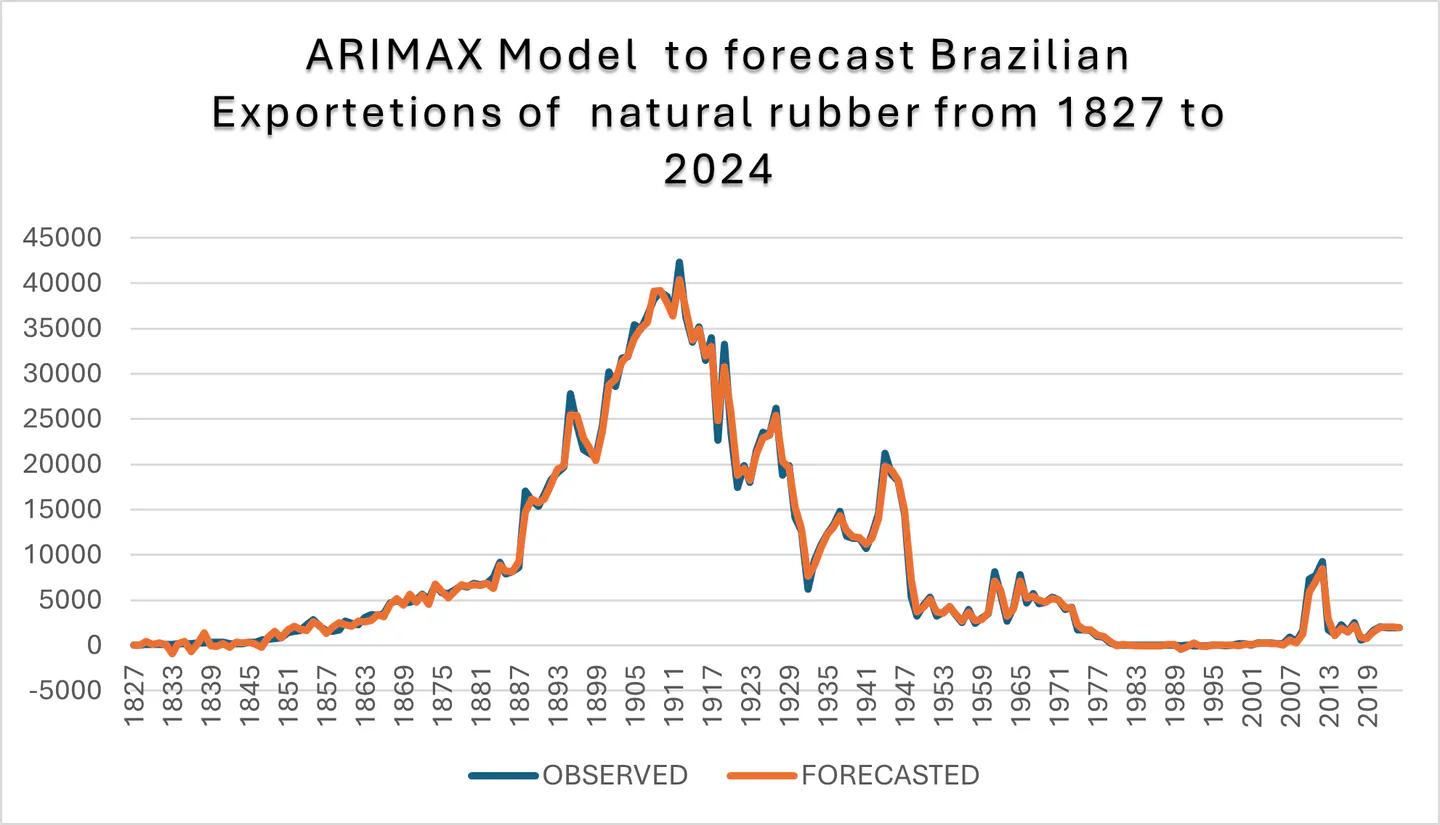
After transforming the original series into a stationary one, the adjustment was made. The best fit achieved for forecasting Brazil’s natural rubber exports between 1827 and 2024, with prices as exogenous variables was an ARIMAX(1,1,0,1) model. A summary of the results found in the adjustment are shown in Table [tab:1] and illustrated in Figure [fig:1].
| Parameters Estimates | |||||
|---|---|---|---|---|---|
| 4-6 | Estimator | t | Sig. | ||
| Variable | Diference (D) | 1 | - | - | - |
| Yt | AR lag | 1 | -0.216 | -3.095 | 0.002 |
| Pt | Diference (D) | 1 | 90.634 | 1.855 | 0.065 |
| Accuracy Tests | |||||
| R squared (R2) | 0.948 | ||||
| R Pearson between observed and forecasted Yt | 0.998 | ||||
| Normalized BIC | 15.680 | ||||
| MAPE | 251.191 | ||||
| MAE | 1422.561 | ||||
Sources of original Data: Lemos. 1983; MIC. 2022; IBGE. 2024.
As can be seen from the results shown in Table [tab:1] and in Figure [fig:1], the adjustments found were parsimonious and statistically robust, allowing us to perform the analyses proposed in this study. The adjusted coefficient of determination (R2) was 0.948, and the estimated Pearson correlation coefficient between the original series of Brazilian exportation of natural rubber and the one obtained for forecasting was 0.998, which means that the forecasted model shows that there is an almost perfect linear relationship between observed and predicted Brazilian natural rubber exports series during the evaluated period. It is also observed that the Normalized BIC coefficient had a low value (15.680), which indicates that the adjusted model is parsimonious. The other accuracy indicators were high, but it is believed that they did not interfere with the forecasting capacity captured by the other indicators, as shown in Figure [fig:1] (BOX et al.. 2015; WANG et al. 2018 ; Vandeput. 2021; Wooldridge. 2015).
In response to the second objective, which sought to detect the influence of prices on Brazilian exports of natural rubber between 1827 and 2024, the adjusted ARIMAX model showed that this influence existed. The magnitude of the estimated coefficient was 90.634, which was significantly different from zero with a probability of error of 6.5%.
This result suggests that the price of natural rubber influenced demand for exports when Brazil held a monopoly on production of the commodity. It also began to influence demand when natural rubber produced in Asian countries entered the market with higher productivity and lower production costs. Prices continued to be decisive in the demand for exports with the introduction of synthetic rubber and improvements in Asian rubber tree cultivation technologies, which caused them to fall even further. It was the sharp decline in commodity prices that made it impossible to continue Brazilian exports of natural rubber at the levels observed, for example, in the Rubber Cycle between 1979 and 1912.
Results found for the third objective
The results presented in Table [tab:2] show that both the quantities of natural rubber exported by Brazil and their prices were highly unstable, as captured by the respective coefficients of variation (CV), all of which were high or very high in Gomes’ (1985) assessment for the four periods studied.
The evidence shown in Table 2 also shows that, despite the series of export quantities and natural rubber prices having shown high instability, captured by the respective coefficients of variation, the second period showed the lowest instability in both periods (Table [tab:2]).
| Periods | Brazilian natural rubber exportations(ton) | Prices of natural rubber(USD1000/ton)* | ||||
|---|---|---|---|---|---|---|
| 2-4 (lr)5-7 | Averages | SD | CV(%) | Mean | SD | CV(%) |
| From 1827 to 1878 | 2937.18 | 2791.01 | 95.02 | 28.87 | 6.87 | 238.00 |
| Period 1879 to1912 | 27442.96 | 8606.67 | 31.36 | 26.45 | 6.67 | 25.22 |
| Period 1913 to 1950 | 18199.24 | 8843.67 | 48.59 | 6.63 | 3.94 | 59.43 |
| From 1951 to 2024 | 2153.64 | 2362.52 | 109.70 | 3.30 | 1.64 | 49.70 |
Sources of original Data: Lemos. 1983; MIC. 2022; IBGE. 2025.
* Adjusted values for 2024.
The results shown in Table 2 suggest that the average quantities of natural rubber exported increased over ninefold between the first and second periods. This evidence confirms that Brazil’s rubber exports peaked between 1879 and 2012, a period that became known as the “Rubber Cycle.” In 1912, Brazil’s natural rubber exports peaked (42,286.00 tons). Brazil’s average exports during this period were also the highest (27,442.96 tons). In terms of average export prices, the highest occurred in the first period, when Brazil was the sole exporter of the product.
During this period (1879/1912), natural rubber produced in Southeast Asia was already competing with Brazilian rubber. Higher productivity in the production of rubber from raw material harvested from cultivated rubber plantations caused prices to decline, until Brazilian rubber production became uncompetitive, which began to happen in the third period (1913/1950). In 1951, Brazil became a net importer of natural rubber.
Results found for the forth objective
The results found to achieve the forth objective are presented in Table [tab:3]. The breakdown of the series of exports and prices of natural rubber shows that Brazil was the sole exporter of natural rubber in the period 1827-1878, the highest average annual growth in its exports of this commodity was observed, in the four periods studied, at around 8.5% per year. High prices tended to fall, as shown in Table 3, where prices decreased at an average annual rate of 0.7% . It is assumed that this combination of high prices, even though experiencing a slight downward trend, and the high growth rate of demand in the period 1827-1878, must have been some of the main factors that stimulated research into the production of natural rubber from trees with much higher productivity than that observed in native rubber plantations, resulting in lower average production costs.
It should also be noted that Brazilian natural rubber production at that time was entirely produced by extraction from native rubber plantations in the Brazilian Amazon. Thus, it is assumed that the synergy of these motivations led the British, in the early 1870s, to seek seeds from native rubber trees that grew spontaneously in the Brazilian Amazon to be cultivated in Southeast Asia (initially in Malaysia). This experiment, as we see today, was successful.
| Periods | GGR of exports | Sign. | GGR of prices | Sign. |
|---|---|---|---|---|
| 1827 to 1878 | 0.085 | 0.000 | -0.007 | 0.000 |
| 1879 to 1912 | 0.042 | 0.000 | 0.025 | 0.000 |
| 1913 to 1950 | -0.039 | 0.000 | -0.015 | 0.058 |
| 1951 to 2024 | -0.025 | 0.087 | -0.018 | 0.000 |
Sources of original Data: Lemos. 1983; MIC. 2022; IBGE. 2025.
In the second period (Rubber Cycle), prices that were high in the first period but declining experienced an increasing GGR (2.5% per year), the highest among the four periods studied. The GGR of quantities exported by Brazil, which was already facing competition from natural rubber produced in Southeast Asia, grew at an average rate of 4.2% per year between 1879 and 1912.
In the third and fourth periods studied, there were declines in both prices and quantities exported by Brazil. Between 1913 and 1950, export volumes declined at an average rate of 3.9% per year, and from 1951 onwards, Brazil became a net importer of natural rubber (imports exceeding exports). The combination of improved technologies that led to lower costs in the production of natural and synthetic rubber led to falls in commodity prices in the last two periods studied, as shown in the evidence presented in Table [tab:3].
Conclusions
This article evaluated Brazilian rubber exports in four periods, starting from the moment they were first recorded:
Period 1: Occurred between 1827 and 1878. During this period, Brazil held a monopoly on natural rubber exports, all extracted from native Amazonian rubber trees, and as such, set the prices for the commodity.
The research showed that prices during this period tended to fall, but there was also a strong upward trend in demand, which stimulated the introduction of rubber tree seeds captured in the Amazon and which began to be cultivated rationally in Southeast Asia.
Period 2: Known as the “Rubber Cycle”, which occurred between 1879 and 2012. During this period, natural rubber produced in rubber plantations cultivated in Southeast Asian countries entered the market. The evidence found in the research showed that competition from natural rubber production in Southeast Asia caused prices to fall relative to previous levels, but growth rates remained positive. Demand also experienced the highest growth rates in this period, which ended in 2012, when Brazil recorded its highest volume of natural rubber exports.
Period 3: Post-cycle period for natural rubber, which began in 2013 and lasted until 1950, when Brazil still exported more natural rubber than it imported, but was already experiencing significant declines in demand. Period 4 began in 1951 and continues to the present day, with Brazil now a net importer of the commodity.
The research sought to construct a parsimonious econometric model (ARIMAX) capable of capturing the trajectories of natural rubber exports influenced by their prices, in order to provide information that would allow us to understand what probably occurred during all those years (1827-2024) with exports, as well as to understand how prices interfered in the long trajectory of exports studied.
The research showed that prices had a statistically significant influence and demonstrated the average levels and instabilities in both: exports and prices in the four periods into which the trajectory of Brazilian natural rubber exports was divided. The study also achieved the objective of showing how exports and commodity prices evolved in the four periods analyzed.
As shown in this research, records of natural rubber exports by Brazil began in 1827. However, there are reports showing that the country was already exporting this commodity well before that date. Thus, the inevitable question is: how did a country that held a monopoly on natural rubber exports during the 19th century, with the first record dating back to 1827, remain in this monopolistic position until 1878 (51 years on record), continued to influence exports and price setting between 1879 and 1912 (33 years), a period known as the “Rubber Cycle” due to Brazil’s exuberant participation in the market, manage to become a net importer of the commodity in the mid-20th century?
The answers to these questions, which constitute the overall conclusion of this research suggests that the decline in the production and export of natural rubber in Brazil, was mainly due to four reasons: 1 - the low production and productivity of native rubber trees, from which rubber was extracted in the Brazilian Amazon; 2 - the entry into the market of rubber cultivated in Southeast Asia from the end of the 19th century; 3 - the entry of synthetic rubber, especially during the First and Second World Wars; 4 - the negligence with which producers/exporters, as well as Brazilian political decisionmakers, observed the evident advance of natural rubber production from Asian plantations.
Another inevitable question raised by the findings of this study is: Why did these agents (natural rubber producers/exporters and political decision-makers) not anticipate this and take consistent measures to ensure that Brazil began cultivating this native Amazonian tree in the region and in other parts of the immense geographical area that Brazil covers?
The attempts that were made in the beginning did not seem to be based on sustainable technical foundations. To complicate the process, the cultivation of rubber trees in the Amazon proved unfeasible in the first attempts due to the emergence of the “curse of the leaf,” caused by a fungus that, as far as was detected, producers and political decision-makers were unaware of. They did not involve researchers at the time to solve the problem and, for these reasons, were unable to control it.
More recently, rubber tree plantations have emerged in states outside the Amazon region, such as São Paulo, Minas Gerais, and Espírito Santo in southeastern Brazil; Bahia in the northeast; and Goiás, Mato Grosso, and Mato Grosso do Sul in central-western Brazil, which successfully cultivate rubber trees.
However, the results found in this research show that the decline in natural rubber exports in the Amazon will be very difficult to reverse in the near future. The evidence captured in this study suggests that it will be difficult for this activity to regain its relevance for the region, either as a source of income or as an employer of labor.