After several decades of study, the nature of the glass state and glass transition remains controversial. This work describes a newly proposed two-stage model for silicate glass transition. The model recognizes that there is a cooling rate independent critical temperature Tc, separating two temperature regions. The coherent structures in the two regions change along different paths. All observed dynamic features in the glass transition result from structural rearrangements in the process. According to the proposed model, the silicate glass transition can be recognized as a second-order phase transition following an incomplete first-order phase transition. This work will first describe the two-stage model, and then apply the model to silica glass, as well as binary and ternary silicate glass transitions.
## I. INTRODUCTION
As a liquid is cooled from its freezing temperature, it may either crystallize or become glass. The transition from liquid to crystal is well-studied and understood. It is a first-order phase transition in the Paul Ehrenfest classification scheme because the first-order deviations of the Gibbs energy function, such as volume and entropy, exhibit discontinuity with respect to temperature. The transition process from liquid to glass is much less straightforward. In the glass transition, as the temperature decreases, the molecules in the liquid move more and more slowly. Without crystallization, the viscosity of the liquid increases rapidly by more than ten orders of magnitude. Eventually, molecular motion is frozen on the time scale of laboratory experiments, and the liquid is transformed into glass. The structural changes that occur during this cooling process are small and hard to detect. The glass seems to have the liquid-like disordered structure but holds solid-like mechanical properties. Understanding the complexity of glass formation remains one of the major intellectual challenges of solid-state physics[1-6]. The question concerning the nature of glass state and glass transition is so challenging that it was selected by the journal Science in 2005 as one of 125 key, unanswered scientific questions[7,8]. The central issue is whether the physics of glass formation can be understood on the basis of purely dynamical origin with no thermodynamic signature, or thermodynamic and structural explanations are required. Over several decades, due to the outstanding work of many scientists, various models and theories that describe the phenomena and mechanism of glass transition have continuously emerged. The Free-volume model, Configurational-entropy model, Mode-coupling theory, Random first-order transition theory are the more well-known examples among them. These models explain some contradictory data, but not all of them. Details of the various models and their relative merits and problems can be found in books and comprehensive review articles[9-17].
This work proposes a new two-stage model for silicate glass transition based on recent results on studies of the medium-range ordering structure of silica glass [18-20]. The newly gained knowledge about the formation and evolution of the medium-range ordering structure is the core of this two-stage model for silicate glass transition. The two-stage model recognizes that there are two different temperature regions in the glass transition process. The coherent structures in these two regions change along different paths, and all observed dynamic features of the glass transition can be explained according to the structural rearrangements in this transition process. This work will first describe the two-stage model, and then apply this model to silica glass and other silicate glass transitions.
## II. THE TWO-STAGE MODEL
Figure 1 shows the entropy S as a function of temperature for a typical liquid at atmospheric pressure. As the liquid cools down from a high temperature, it may become glass or crystal. To form a crystal, the cooling rate must be low, and the entropy decreases along the path (I). Tm is the melting temperature of the crystal, and Tc is the polymorphic inversion temperature of the crystals. One material may have several polymorphic inversion temperatures. Tc is the one closest to Tm. If the cooling rate is high and crystallization is avoided, the entropy decreases along the path (II) or (II') to form glasses. Both paths (II) and (II') avoid crystallization but the cooling rate of the path (II') is lower than that of the path (II). The two-stage model defines the glass formation in two temperature regions separated by Tc. The region from Tm to Tc is the first or high-temperature region. The region from Tc down to Tg, which will be defined later, is the second or low-temperature region. Glass transitions during the cooling of liquid in these two regions have very different characters, as the term two-stage model implies and will be presented separately.
The first stage of glass transition occurs in the high-temperature region from Tm to Tc. In this temperature region, the liquid is not stable and is called supercooled liquid. Because of the Gibbs free energy difference between the two states, there is a driving force to transfer the liquid to the crystal state. In the following equation (1) of Gibbs free energy (G) at atmospheric pressure,
$$
G = U - S T \tag {1}
$$
there are two competing terms, internal energy (U) and entropy (ST). For the temperature T is lower than Tm, the entropy term ST is low and G is dominated by the internal energy term U. Because the free energy of a crystal is lower than that of a liquid, the super cooled liquid constantly reorganizes to form a crystal to minimize the free energy of the system. In the case of low cooling rate, crystal nuclei will form and distribute inside the super cooled liquid. These nuclei will then grow to large crystals. The transformation from liquid to high temperature polymorphic crystal is a well-defined first-order phase transition in the Paul Ehrenfest classification scheme because the first-order derivative of the Gibbs energy function, such as volume and entropy, exhibit discontinuity with respect to temperature.
Due to the high cooling rate of glass formation, crystal nucleation is avoided. Although no crystal nuclei form in the super cooled liquid, the embryonic clusters can still form inside. These clusters have slightly higher densities than the surrounding regions. Their sizes may be smaller or closer to that of nuclei. These clusters are randomly distributed in the super cooled liquid and intend to grow to nuclei and further to large-sized crystals. As the liquid cooled from Tm to Tc, the number of the embryonic clusters in the super cooled liquid continue to increase, reducing the entropy of the system. The clusters in super cooled liquids would not all dissolve if the temperature did not rise to a temperature higher than Tm. Thus, the super cooled liquid has a heterogeneous structure. The above view on the cluster formation before nucleation in super cooled liquid is not described in the classical nucleation theory [21], but is consistent with the more recent two-step nucleation theory and is verified by advanced experimental results [22-25].
To understand the glass transition, it is necessary to recognize the existence of embryonic clusters in the super cooled liquid. It is more important to find out how these clusters transform in the second stage of the cooling process from Tc to Tg. Tc is a special temperature for the corresponding crystals. At Tc all high temperature polymorphic crystals, regardless of sizes, start to convert to the low temperature polymorphic crystals. In glass transition, there are no crystals but only embryonic clusters in the super cooled liquid. These clusters in the super cooled liquid cannot simply switch their growing pathway from formation of high temperature polymorphic nuclei to that of low temperature polymorphic nuclei. The reason is that during cooling, the viscosity of the super cooled liquid has significantly increased at Tc; and the molecules in the super cooled liquid are difficult to move from one place to another. What the molecules can do to minimize the system's free energy is to form more ordered structures locally by breaking the bonds and changing the orientations of molecules, as what happens in the crystal polymorphic inversion.
In the second stage of the glass transition from Tc to Tg, the internal energy term and the entropy term in equation (1) continue to compete against each other. As the temperature decreases, the entropy term decreases, and more clusters are allowed to transform into more ordered structures. Assume N is the number of clusters with more ordered structures at a given temperature and M is the number of total clusters. At Tc the number N is equal to zero. As the temperature decreases from Tc, the number N increases, until all M clusters transform to a more ordered structure at Tg. The ratio of N to M is defined by
$$
\zeta = N / M \tag{2}
$$
In equation (2), $\zeta$ is the order parameter of glass transition. The fact that the symmetry starts to broke at Tc and the order parameter $\zeta$ changes from 0 at Tc to 1 at Tg indicates that the second stage of glass transition has the typical characteristics of a second-order phase transition [26]. The ending temperature of the second-order phase transition Tg can be experimentally determined by the uprising point in Cp measurement from low to high temperature. All physical properties of glass in the temperature range from Tc to Tg should reflect the nature of the second-order phase transition. Because the second stage of transition immediately follows the first stage of transition, the total number of clusters M in the system depends on the cooling rate of the first stage. For slower cooling, the system has a longer time period to complete the first stage of transition and hence there are more embryonic clusters formed in the system. The system with more clusters needs a larger temperature range to complete the second-order phase transformation. Thus, temperature Tg is lower for the glass with a slower cooling rate, as shown in Fig. 1. The cooling rate dependence of Tg and other physical properties is a special feature of the glass transition, which is distinct from other second-order phase transitions, such as super ordering structure transformation in alloys and ferromagnetic phase transitions [27,28].
## III. SILICA GLASS TRANSITION
Silica glass is an archetypical glass. Over the years, significant experimental data and observations have been accumulated for the silica glass transition process. Any viable model of the glass transition must be able to explain these phenomena observed in the silica glass transition.
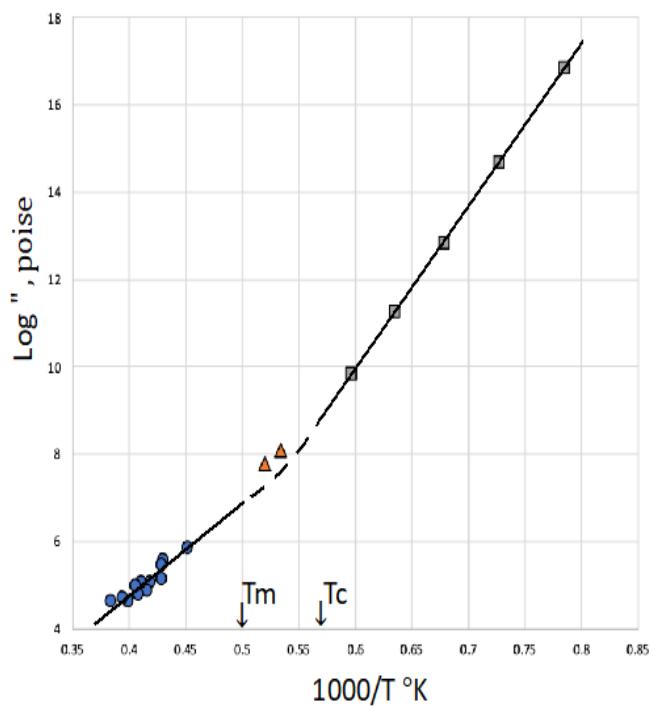
Applying the two-stage model for silica glass transition, Tc is the polymorphic phase transition temperature between $\beta$ -cristobalite and $\beta$ -tridymite, which is $1470^{\circ}\mathrm{C}$, as shown in Fig. 2(a). The first stage of silica glass transition is the cooling process in the temperature range from Tm, $1723^{\circ}\mathrm{C}$, to Tc, $1470^{\circ}\mathrm{C}$. Although the super cooled liquid avoids $\beta$ -cristobalite crystallization, embryonic clusters are formed inside. Recent studies on the medium-range structure of silica glass indicate that embryonic clusters in the super cooled liquid are 1-2 nm in size and have an approximately octahedral shape [19]. Because of the formation of clusters, the configuration entropy of the system significantly declines at $1470^{\circ}\mathrm{C}$, as illustrated in Fig. 2(a). Furthermore, due to increase in number and average size of the clusters, the internal friction of super cooled silica liquid continuously increases and causes the activation energy of the liquid to increase. This is the reason that viscosity-temperature behavior of super cooled liquid silica changes at Tm from Arrhenius type in temperatures above Tm to super-Arrhenius type in the temperature range from Tm to Tc, as shown in Fig. 2(b).
At Tc, $1470^{\circ}\mathrm{C}$, the first stage transition ends and the second stage starts. In the second stage of glass transition, the continuous decrease in the configuration entropy of the system is due to the formation of the one-dimensional ordering structure on the clusters' facets, called nanoflakes for convenience [18]. The reduction in configuration entropy resulting from the formation of nanoflakes is much slower compared to the direct formation of clusters. Thus, the entropy vs. temperature curve in Fig. 2(a) bends at Tc, $(1470^{\circ}\mathrm{C})$, the curve would not cross over the crystal entropy curve, and the so called "Kauzmann catastrophe" would not happen [19,31].
Also, in the second stage of glass transition in the temperature region below Tc, the population of the ordered clusters increases, and the order parameter $\zeta$ changes from 0 at Tc to 1 at Tg. Published experimental data on specific heat Cp of silica glass as a function of temperature has a hump at around $1200^{\circ}\mathrm{C}$ [29]. Thus, Tg of silica glass is located at around $1200^{\circ}\mathrm{C}$. However, Tg is influenced by the cooling rate: the lower the cooling rate, the lower the temperature Tg. Hence, it is possible to find silica glass with Tg lower than $1200^{\circ}\mathrm{C}$ from different specimens [19, 30]. The cooling rate dependence of Tg does not change the nature of the second-order phase transition of glass in the low temperature range. This is because the critical temperature Tc for silica glass is always $1470^{\circ}\mathrm{C}$, regardless of cooling rate.
The formation of nanoflakes affects various physical properties of glass, such as optical transmission, X-rays scattering, etc. However, it does not influence the activation energy of the liquid flow. This is because the size and shape of the clusters are not affected by the ordering on the facets, and the energy barriers in the liquid flow stay the same. Thus, after the activation energy reaches the maximum value at Tc, it stays unchanged in the whole low temperature region, and the behavior of viscosity of silica reverts back to Arrhenius type, as shown in Fig. 2(b) [32-34].
## IV. SODIUM SILICATE GLASS TRANSITIONS
The two-stage model is not limited to pure silica glass. It can also describe binary silicate glass transition, provided that the liquidus temperature Tm and critical temperature Tc of the silicate glasses are known. For most binary silicate glasses, Tm and Tc can be identified from the corresponding phase diagram. For sodium silicate glasses with various contents of sodium, Tm and Tc can be determined from the $\mathrm{Na_2O - SiO_2}$ phase diagram, as shown in Fig. 3(a) [35]. This phase diagram indicates that for sodium silicate glasses with 0 - 11.3 weight% $\mathrm{Na_2O}$ concentration, Tm is in the range from $1713^{\circ}\mathrm{C}$ to $1470^{\circ}\mathrm{C}$ and Tc is at $1470^{\circ}\mathrm{C}$; for glasses with 11.3 - 24.5 weight% $\mathrm{Na_2O}$ concentration Tm is in the range from $1470^{\circ}\mathrm{C}$ to $870^{\circ}\mathrm{C}$ and Tc is at $870^{\circ}\mathrm{C}$. Taking a glass with $20\%$ $\mathrm{Na_2O}$ as an example, its position on the phase diagram is at the arrow-pointed B in Fig. 3(a). From the position of B, two characteristic temperatures Tm at $1140^{\circ}\mathrm{C}$ and Tc at $870^{\circ}\mathrm{C}$ can be found in the figure. For this sodium silica glass transition, Tc is the polymorphic phase transition temperature between $\beta$ -tridymite and $\beta$ -quartz, which is $870^{\circ}\mathrm{C}$.
The first stage of the glass transition is the cooling process in the temperature range from $1140^{\circ}\mathrm{C}$ to $870^{\circ}\mathrm{C}$. Although the super cooled liquid avoids the $\beta$ -tridymite crystallization, embryonic clusters are formed inside and cause a significant decrease of the system's entropy. At Tc, $870^{\circ}\mathrm{C}$, the first stage of transition ends and the second stage starts. The second stage of transition is a continuous disorder-order transition. The decreasing rate of entropy in the second stage is lower than that in the first stage. The second stage ends at Tg, which can be found from the specific heat Cp data of the glass as a function of temperature. The heat capacity Cp data of sodium silicate glass with 15 mol.% of $\mathrm{Na}_2\mathrm{O}$ as a function of temperature are available from references [36,37]. The sharp rising of Cp between $480^{\circ}\mathrm{C}$ and $560^{\circ}\mathrm{C}$ indicates that heat absorption increases sharply in this temperature range, and Tg of the glass is hence found at around $500^{\circ}\mathrm{C}$. Since the heat absorption properties of sodium silicate glasses with 15 and 20 mol.% of $\mathrm{Na}_2\mathrm{O}$ are similar, the Tg of the sodium silicate glass with 20 mol.% $\mathrm{Na}_2\mathrm{O}$ is also estimated at around $500^{\circ}\mathrm{C}$. Thus, similar to silica glass, the entropy-temperature relation in the sodium silicate (20% $\mathrm{Na}_2\mathrm{O}$ ) glass transition can also be illustrated by Fig. 1, in which polymorph 1 and 2 are $\beta$ -tridymite and $\beta$ - quartz, respectively, and the value of Tm is $1140^{\circ}\mathrm{C}$, Tc is $870^{\circ}\mathrm{C}$, and Tg is around $500^{\circ}\mathrm{C}$. Note that in the $\mathrm{Na}_2\mathrm{O - SiO}_2$ system, the compositions expressed in wt.% and in mol.% differ very little.
In addition to entropy, the viscosity-temperature behavior of the sodium silicate glass is also similar to that of silica glass, as described by the two-stage model. Experimental viscosity data of the sodium silicate glass are readily available. As shown in Fig. 3(b), the logarithm of viscosity of this glass is plotted as a function of the reciprocal of temperature [32]. The results are similar to that of silica glass as presented in Fig. 2(b): there are two straight lines showing the Arrhenius types of this sodium silicate viscosities, in the temperature ranges higher than Tm and lower than Tc. In the temperature range from Tm to Tc, the behavior is a super-Arrhenius type.
## V. SODIUM BOROSILICATE GLASS TRANSITION
The two-stage model can also describe a more complicated sodium borosilicate glass transition. The ternary glasses are broadly used for cookware, chemical laboratory ware, TV screens, etc., due to their thermal shock resistance and excellent chemical durability. Substantial physical property data of these glasses have been accumulated. These data can be explained from the internal structures of these glasses by the two-stage model. Here the glass with $71.56\%$ $\mathrm{SiO}_2$, $8.28\%$ $\mathrm{B}_2\mathrm{O}_3$ and $18.76\%$ $\mathrm{Na}_2\mathrm{O}$ is used as an example. This particular sodium borosilicate glass was defined as 602 glass by S. English in 1924 [38]. Using experimental viscosity data measured by English, the logarithm of the viscosity of the glass as a function of reciprocal temperature is shown in Fig. 4(a). To understand the viscosity-temperature behavior of the glass, two characteristic temperatures Tm and Tc are needed. These can be found from the phase diagram of the ternary system $\mathrm{Na}_2\mathrm{O} - \mathrm{B}_2\mathrm{O}_3 - \mathrm{SiO}_2$, as shown in Fig. 4(b) [39]. In Fig. 4(b), point A represents 602 glass defined by English [38]. The liquidus temperature of glass, represented by point A, is about $1100^{\circ}\mathrm{C}$. Because the corresponding crystal of the glass is tridymite, Tc is the polymorphic phase transition temperature between $\beta$ -tridymite and $\beta$ -quartz, which is $870^{\circ}\mathrm{C}$. It is found that the viscosity-temperature behavior of the sodium borosilicate glass is similar to that of silica glass described by the two-stage model. In Fig. 4(a), there are two straight lines showing the Arrhenius type of this sodium borosilicate viscosity, in both the temperature range higher than Tm ( $1100^{\circ}\mathrm{C}$ ) and lower than Tc ( $870^{\circ}\mathrm{C}$ ). In the temperature range from Tm to Tc, the behavior is a super-Arrhenius type.
The temperature Tg of this sodium borosilicate glass can be found from the existing experimental data. Nearly a hundred years ago, A. A. Lebedev already reported that sodium borosilicate glasses exhibited characteristic heat absorption between $555^{\circ}\mathrm{C}$ and
$610^{\circ}\mathrm{C}$ [40]. A recent study indicated that Tg of this sodium borosilicate glass should be close to $570^{\circ}\mathrm{C}$ [37]. Therefore, similar to silica and sodium (20%) silicate glasses, Fig. 1 can also be applied to describe entropy changes in the transition of sodium borosilicate glass $(71.56\% \mathrm{SiO}_2,8.28\% \mathrm{B}_2\mathrm{O}_3$ and $18.76\% \mathrm{Na}_2\mathrm{O})$ with polymorph 1 and 2 being $\beta$ -tridymite and $\beta$ -quartz, respectively, and with the value of Tm at $1100^{\circ}\mathrm{C}$, Tc at $870^{\circ}\mathrm{C}$, and Tg at around $570^{\circ}\mathrm{C}$.
## VI. CONCLUDING REMARKS
The two-stage model is based on the studies of formation and evolution of the medium-range order structure in silicate glasses. It is recognized that there are two stages in the glass transition process, separated by the critical temperature $T_{c}$, which is the polymorphic inversion temperature of the corresponding crystals. The first transition stage is in the high-temperature range from the melting temperature $T_{m}$ to the critical temperature $T_{c}$. In the first stage, nano-clusters form. The number of clusters increases with decreasing temperature and reaches a maximum value at $T_{c}$. The second transition stage is in the temperature range from $T_{c}$ to $T_{g}$, in which the clusters transform into more ordered structures. Temperature $T_{g}$, the ending temperature of the second stage, is cooling rate dependent and can be determined experimentally. According to the two-stage model, the silicate glass transition can be recognized as a second-order phase transition following an incomplete first-order phase transition. The model correctly predicts the physical properties, such as entropy and viscosity as a function of temperature in a wide temperature range. The application of the new model is valid for silica glass, as well as for complex silicate glasses. However, its validity to other types of glasses, such as metallic glasses and organic glasses, etc., needs to be further investigated.
### ACKNOWLEDGEMENTS
Generating HTML Viewer...
References
40 Cites in Article
P Anderson (1995). Through the Glass Lightly.
Pablo Debenedetti,Frank Stillinger (2001). Supercooled liquids and the glass transition.
Gregory Mckenna (2008). Diverging views on glass transition.
E Zanotto,J Mauro (2017). The glass state of matter: Its definition and ultimate fate.
R Tournier,M Ojovan (2021). Undercooled phase behind the glass phase with superheated medium-range order above glass transition temperature.
Hajime Tanaka (2005). Two-order-parameter model of the liquid–glass transition. I. Relation between glass transition and crystallization.
Steven Girvin (2005). Just what is superconductivity?.
James Langer (2007). The mysterious glass transition.
David Turnbull,Morrel Cohen (1958). Concerning Reconstructive Transformation and Formation of Glass.
A Beukel,J Sietsma (1990). On the nature of the glass transition in metallic glasses.
J Gibbs,E Dimarzio (1958). Nature of the glass transition and the glassy state.
C Angell,K Ngai,G Mckenna,P Mcmillan,S Martin (2000). Relaxation in glassforming liquids and amorphous solids.
Wei Wang,Ping Wen,D Zhao,M Pan,Ru Wang (2003). Relationship between glass transition temperature and Debye temperature in bulk metallic glasses.
W Gotze,L Sjogren (1992). Relaxation processes in supercooled liquids.
M Goldstein,J (1969). Viscous liquid and the glass transition: a potential energy barrier picture.
Richard Zallen (1998). The Physics of Amorphous Solids.
Arun Varshneya,John Mauro (2019). Fundamentals of inorganic glass making.
S Cheng (2017). A nanoflake model for the medium range structure of vitreous silica.
Shangcong Cheng (2021). New Interpretation of X-ray Diffraction Pattern of Vitreous Silica.
S Cheng (2019). Medium Range Ordering Structure and Silica Glass Transition.
D Turnbull (1950). Formation of Crystal Nuclei in Liquid Metals.
Denis Gebauer,Matthias Kellermeier,Julian Gale,Lennart Bergström,Helmut Cölfen (2014). Pre-nucleation clusters as solute precursors in crystallisation.
A Hishinuma,D Uhlmann (1987). Nucleation kinetics in some silicate glass-forming melts.
L Cormier (2014). Nucleation in glasses -new experimental findings and recent theories.
C Kittel (1976). Introduction to solid state physics.
W Schmelzer,I Gutzow (2011). Glasses and the Glass Transition.
Foster Nix,William Shockley (1938). Order-Disorder Transformations in Alloys.
P Richet,Y Bottinga,L Denielou,J Petitet,C Tequi (1982). Thermodynamic properties of quartz, cristobalite and amorphous SiO2: drop calorimetry measurements between 1000 and 1800 K and a review from 0 to 2000 K.
Sabyasachi Sen,Ron Andrus,David Baker,Michael Murtagh (2004). Observation of an Anomalous Density Minimum in Vitreous Silica.
W Kauzmann (1948). The Nature of the Glass and the Behavior of Liquids at Low Temperature.
S Cheng (2021). Viscosity-temperature relation based on the evolution of medium-range structure of silica.
Robert Doremus (2002). Viscosity of silica.
Michael Ojovan,William Lee (2004). Viscosity of network liquids within Doremus approach.
No ethics committee approval was required for this article type.
Data Availability
Not applicable for this article.
How to Cite This Article
Shangcong Cheng. 2026. \u201cTwo-Stage Model of Silicate Glass Transition\u201d. Global Journal of Science Frontier Research - A: Physics & Space Science GJSFR-A Volume 22 (GJSFR Volume 22 Issue A7).
Explore published articles in an immersive Augmented Reality environment. Our platform converts research papers into interactive 3D books, allowing readers to view and interact with content using AR and VR compatible devices.
Your published article is automatically converted into a realistic 3D book. Flip through pages and read research papers in a more engaging and interactive format.
Our website is actively being updated, and changes may occur frequently. Please clear your browser cache if needed. For feedback or error reporting, please email [email protected]
Thank you for connecting with us. We will respond to you shortly.