This article describes the integration from big data environment in the management of products and services from a banking entity with optimizing financial products and decisionmaking. Actually, there are many financial entities where their different business areas have isolated databases, causing greater consumption of computer resources, maintainability and, in many cases, process delays. This problem becomes critical specially if there is a transnational company because data needs can vary geographically despite being the same functional area. The Data Architecture area proposed guidelines such as centralizing information in a big data environment, ensuring progressive accessibility from users for new financial analytics initiatives and thereby reducing isolated data. The agile, Scrum framework supported the advanced analytics pilot which comprising developments in the data ingestion layer (data lake) through the distributed processing from Apache Spark; and information consumption through Sandboxes, which one, users performing the analysis, visualization and prediction from data.
## I. INTRODUCTION
The integration from a Big Data environment in a financial institution requires management concepts, experience in developing software, data modeling and agile frameworks.
The limitations discovered in a financial institution in Peru were based that the architectural pieces were installed on servers in Mexico, causing dependence on operators in that country for the administration from the Big Data environment. In addition to this, the users have too much operability rooted in their legacy systems which leads them to be resistant to change, so, in this manner, the data architecture area must provide information and knowledge to the users so that they get involved and feel satisfied with the improvements from a Big Data environment
The integration from this Big Data environment was applied using the agile SCRUM framework, with a multidisciplinary team bringing to the own business users such as: Data Scientists hand in hand with the developers and data architects.
The solutions that are performed on this BIG DATA environment are based on the advantages of Apache Spark as a processing engine and HDFS (Hadoop Distributed File System) as a storage tool.
The analytical environments for Data Scientists which are Sandboxes, which are workspace with the possibility of running notebooks with the development in Python and Scala allowing Data Scientists to performing Machine Learning initiatives or work analytical models with different distributed processing libraries, these Sandboxes have access to consume certified and governed data hosted on the Data Lake, which is the storage component of the environment.
The Data Lake contains the raw data which is storage from the different applications from the business areas; All of this raw information is mastered to be consumed by users, which means that through treatment from data, the information is collected to functional concepts called "application units", with this, these mastered data achieve value and veracity to be exploited by the different business areas
Being the main stages of the integration from the Big Data environment: Geographic Diagnosis, Platform Validation, Design and Development of the Pilot.
## II. METHODS
The implementation of the integration from the BIG DATA environment began with a pilot in the Business Development area (commercial area of the bank's products); as detailed in the following stages, first determining the scope of the pilot, going through the validation of tools to the deployment of products which validate the integration of the environment and makes it available for other analytical projects.
### a) Geographic Diagnosis
The implementation area adopted is Business Development (or commercial area) for having several analytical models for generating financial products and for interacting with other business areas which are linked with the Finance and Risks areas, and a multidisciplinary team was formed with different roles such as: Data Scientist, Data Developers, Data Architects, Project Managers and Agile Coaches.
Taking initiatives in a commercial area has many benefits of problem solving because we have advanced analytics possibilities in the Customer Network, Prediction of abandonment, geolocation, fraud detection, etc. (Galeano et al., 2019)
The chosen pilot consisted of migrating the entire monthly process from credit card campaigns for natural persons which until that moment took around 35 days from its conception to the arrival of the credit card offer to each client.
Taking advantage of the distributed processing and storage of a Big Data platform, the challenge is to reduce this process to 5 days.
### b) Formation of Critical Mass
We started training with programming languages such as: Scala and Spark for the processing the Data Scientist will migrate and with the handling of HDFS. As well as working in a Sandbox with Notebooks where it can be developed in these languages on the Big Data environment.
For the developer roles, which are training in the knowledge of HDFS and data ingestion with libraries provided by the global architecture area. This library is based on Scala and Spark and its objective is to give structure to the inputs (which are usually flat files or csv), which structures are used for the government of the Data Lake.
In addition to the structure, these ingest libraries provide basic and configurable data transformations, which are nothing more than DMLs (Data Manipulation Language) in Spark SQL, which would be the well- known Join, GroupBy, Union, etc. Also, tools with Continuous Integration for the deployment of these intakes, using components such as Jenkins (to orchestrate the deployment pipeline) and Bitbucket (as a repository for configurations and jobs).
Lastly, agile coaches trained in agile frameworks which having a multidisciplinary team taking account Scrum ceremonies such as: Planning, Dailys, Reviews, Retrospective. From the Extreme Programming methodology is collected the use of user stories. The team needed to know the methodological framework to work together and in an incrementally manner because different management involved (Risks, Finances, Product Development and Engineering) were waiting deliverables every fourteen days for contributing resources. Scrum helping in the developing of iterative deliverables as part of the final product, through Sprints and stakeholder collaboration.
### c) Platform Validation
Our financial entity has centralized the infrastructure for all of Latin America, reason for which the data architects from each country are responsible for the availability pieces. These pieces go through a reception process through POC (Proofs of Concept) where basic cases are executed, individually testing each piece with the aim of knowing the functionalities and scope before of showing it to the users who will require training. There is no necessary from stress testing or performance because it is required by the Quality Assurance Global team at the installation. From a piece. From in this manner, the Local Data Architecture team is the second functional validation front for the Big Data environment because there is a continuous communication with Global Architects.
These pieces are collected into two fronts like: Data Lake and Sandbox:
- Data Lake: All the pieces that are involved in the provisioning or ingesting of data governed to the Data Lake.
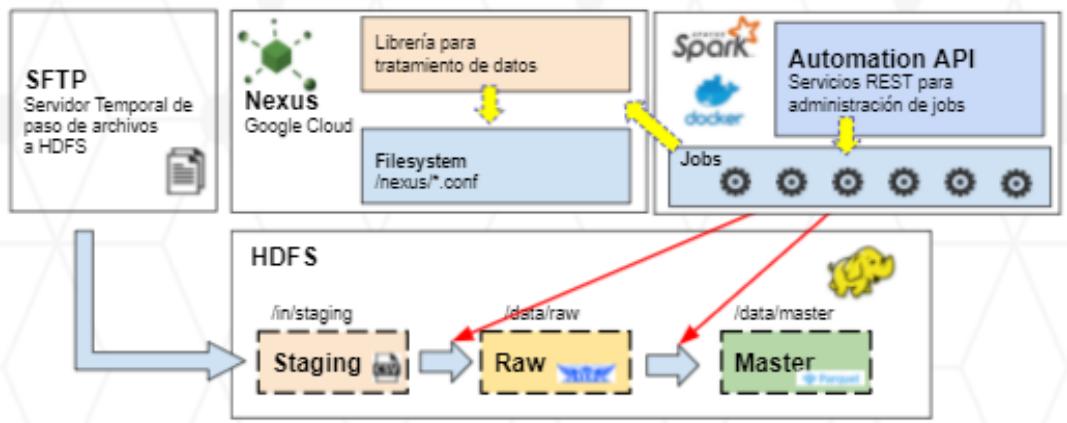 Figure 1: Distribution from the Infrastructure from Data Lake
- SFTP: Here it is observed which the transmission of input data is through the SFTP transfer protocol, this transmission is done through Control M which is a Batch programming tool, this tool serves the entire data lake provisioning life cycle.
- HDFS: In this table we have 3 layers of provisioning
- Staging: Temporary storage layer where the files reside since its origin, for pilot purposes it was homologated to csv files. The temporality of these files should be the minimum possible because the information can contain the sensitive data (in the following layers, there is the possibility of encryption) and it should also be temporary because the flat files take up a lot of space that
must be used by other consumable formats. by users in Big Data.
- Raw: It is the raw data layer in the Big Data environment, this layer contains compressed files at the row level (AVRO format) for subsequent transformations, but not for queries and advanced analytics. This layer also serves as historical storage for its disk savings and also serves as a backup against possible reprocesses of the next layer.
- Master: Final layer of the Data Lake for which it is compressed at the columnar level with the aim to support exploratory analysis and processing of analytical models, this file format is PARQUET. This layer is the one that Data Scientists have access to in their respective Sandboxes.
Figure 2: Comparison of Formats of Files
<table><tr><td>File format</td><td>Schema integration</td><td>Compression support</td></tr><tr><td>Text/CSV (Shafranovich 2005)</td><td>-</td><td>-</td></tr><tr><td>JSON (Bray 2014)</td><td>+</td><td>-</td></tr><tr><td>Avro (Apache 2009a)</td><td>+</td><td>+</td></tr><tr><td>SequenceFile (Apache 2009b)</td><td>-</td><td>+</td></tr><tr><td>RCFile (He et al. 2011)</td><td>-</td><td>+</td></tr><tr><td>ORC file (Apache 2017)</td><td>-</td><td>+</td></tr><tr><td>Parquet (Apache 2013)</td><td>+</td><td>+</td></tr></table>
As it's well-known in the previous image, Avro and Parquet stand out among the other file formats considering the integration of data structures and compression support; these characteristics are consistent with the manipulation of data in a Big Data environment.
- Nexus Repository: It is the repository of artifacts where store all the configuration files used in the feeding of files from the different layers of the Data Lake, as well as the libraries that are consumed in complex processing.
Actually, the replacement of this component with JFrog Artifactory, an Open Source tool with the same functionality as Nexus but that complies more efficiently with the installed ecosystem.
- Automation Api: It is the processing engine and clustering based on the Spark-based. It is distributed by a series of containers (Docker) and agents (Nodes) that distribute the cores efficiently to execute the different jobs that provision files in the Data Lake. As can be seen in Figure 1, in this layer storages the jobs (which will be used for information processing, such as feeding for the Data Lake), which are created and executed through rest
requests (communication between servers via HTTP).
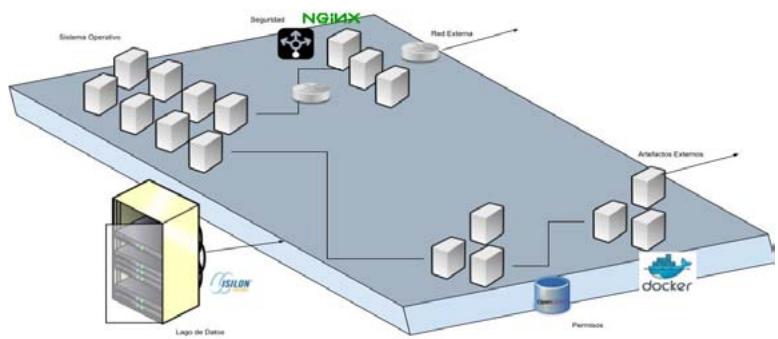 Figure 3: Diagram from Compounds with Tools from Open Source
- Sandboxes: The analytical components that consume the information from the Data Lake, described in the previous points, are distributed at the level of sandboxes which were mounted on
Google Cloud. In the actualization, we do not use Google services and the Jupyter Lab tools are mounted on the same servers of the financial institution.
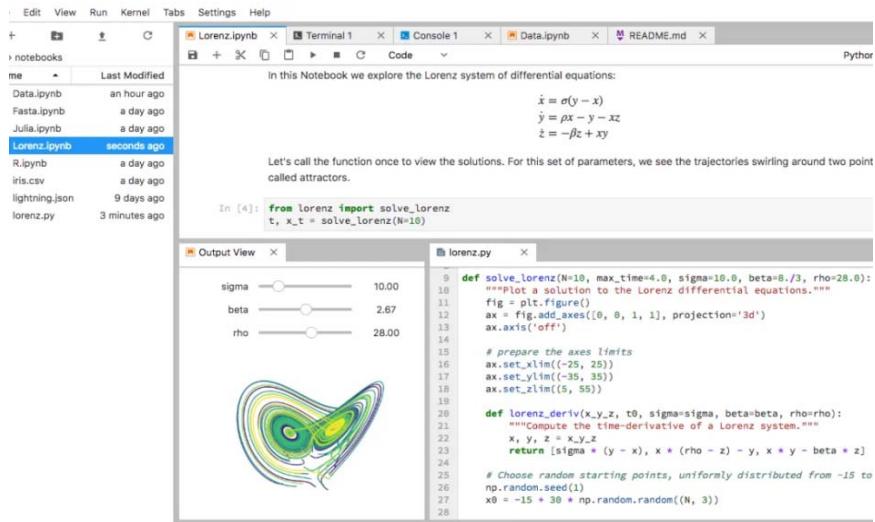 Figure 4: Jupyter and Advanced Analytics
Sandboxes contain specific permissions for the files in the Data Lake, according to the responsible for the sandbox, which means different Data Scientists can access to different sandboxes which can access different governed files in the Data Lake.
For the campaign pilot, we created a sandbox and performing the basic processing libraries in
PySpark and ScalaToore (Python and Scala, respectively) and the access and profiling modalities for the Data Scientists to develop their processing and/or models.
To finish the component validation, we integrate all the pieces described above in the Component Diagram of figure 5
 Figure 5: Components Diagram
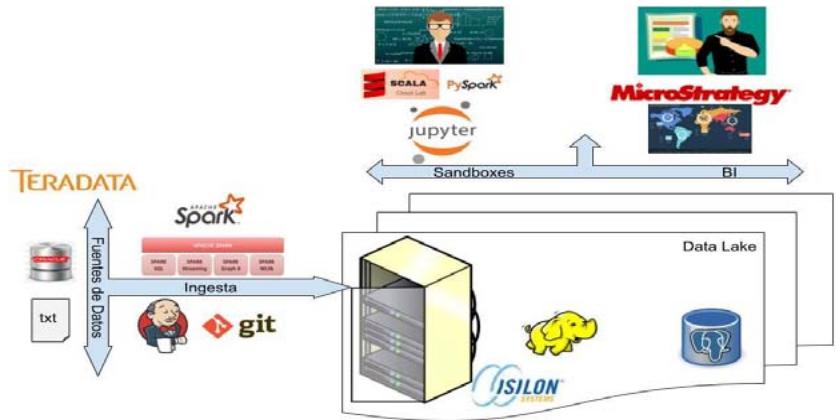
The components in Figure 5 follow the life cycle from the data in the financial institution's big data environment.
We start with the feed from the data from data sources such as: Teradata or flat files, we continue with the feeding process with the libraries described in the previous point, there are cases in which the feeding is complex due to business rules for which are developed specific procedures in spark, this being consider the third box, the central component and the most important is the Data Lake that currently contains HDFS, later other databases will be added (it is dotted in red), which continues are the neuralgic components from the Big Data environment: Sandboxes(for the development from advanced analytics or processing engines) and Business Intelligence tools (such as MicroStrategy) to design departmental reports to support decision-making, finally, the big data environment can serve as input for other applications, therefore, there is the scheme of "BD as a services" for which this component only replying to leaving the resulting files in a staging zone for the output from the environment so that it can be transmitted to different applications through Connect: Direct (IBM's secure transfer network)
### d) Design and Development of the Pilot
At this stage, the developers with the tools already validated, proceeded to perform two activities in supplying the Data Lake to implement the Credit Card Campaigns (TC) pilot.
1. Dictionary of Sources: Analyze with the different bussiness areas, the source from the supplies for the TC campaign process. Once identified, they proceed to map the physical source from the table or file, describing attribute by attribute, specifying the correct data type and designing a relational data structure with global standards for registering this mapping in the data dictionary.
2. Data Feeding: Through the use from the ingesting libraries, previously validated, the dictionary files are loaded into the STAGING area (Flat Files), then to the RAW area (in Avro format) and finally to the MASTER area (in Parquet format). Each of these loading processes are nothing more than ETLs (Extraction, Transformation and Loading) that are elaborated in Business Intelligence.
#### DEMO FLUJO DE INGESTA
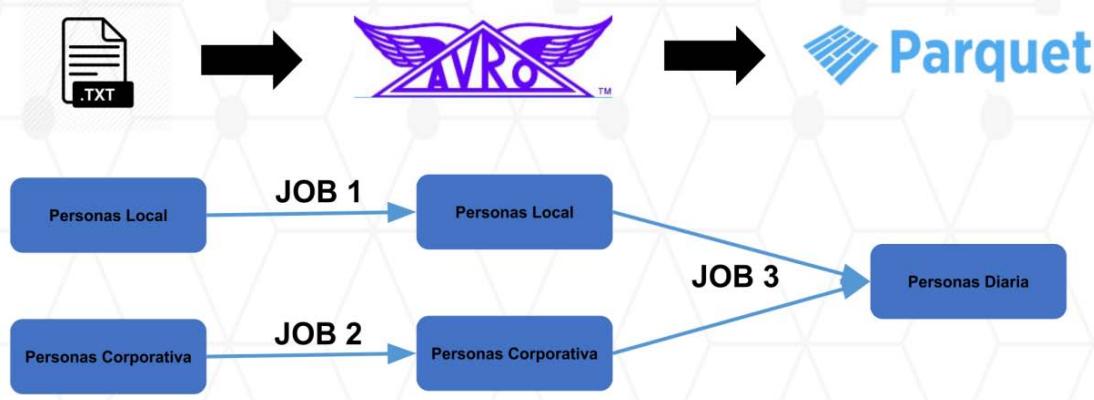
Figur 6: Flow of Ingesting
The Jobs with which each executed ingest are mounted in Automation Api. This development environment is called: "Work" and there is a production replica environment which are called: "Live".
While the developers continue to provide the Data Lake, the Data Scientists work their models with test data in the available Sandbox, it should be noted that the Sandbox consumes information from the data lake, but it can also consume information which the own user uploads, but the latter as it is not governed, it only exists in the Data Scientist workspace, and not in the
Data Lake. This set of criteria is found in good intranet practices.
When the developers finish to provide the Data Lake, the Data Scientists will change their notebooks (Data Scientist development environment for working analytical models and procedures) to consume the governed sources (no longer the ones loaded by themselves); here begins the implementation of the pilot where business users are autonomous in said executions and certifications.
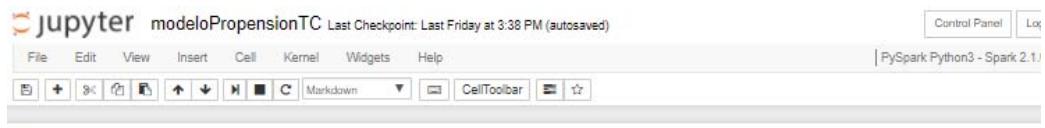 Figure 7: Notebook with the Credit Card Propensity Model
#### Modelo Propensión de TC
En este proyecto se replicarán los 3 modelos de propension de tarjeta de credito,switho proposto es identificar la probabilitad que un cliente BBVA acepe la tarjeta de credito afrcida,temen se evalua la captacion de los no clientes ofreciendoles el plastico.
#### 1. Libraries:
{"code_caption":[],"code_content":[{"type":"text","content":"In [1]: if 'classeslibraries' in sys/modules: del sys/modules['classeslibraries'] print('Imported libraries updated') from classeslibraries import * "}],"code_language":"txt"}
#### 2. Functions:
{"code_caption":[],"code_content":[{"type":"text","content":"In [2]: if 'classes.UDF' in sys/modules: del sys/modules['classes.UDF'] print(\"User Defined Functions updated\") from classes.UDF import UDF "}],"code_language":"txt"}
#### 3. Read to DataBase:
{"code_caption":[],"code_content":[{"type":"text","content":"In [3]: historicOffers = spark.read.parquet('/IFS/PE/DaaS/DEV/intelligence/intc/analysts/users/P022923/data/parquet/01_dataBaseHistoryofmonthlyOffers = spark.read.parquet('/IFS/PE/DaaS/DEV/intelligence/intc/analytics/users/P022923/data/parquet/02_dataBaseMonthOfferICTable = spark.read.parquet('/IFS/PE/DaaS/DEV/intelligence/intc/analytics/users/P022923/data/parquet/03_dataBaseICTable') masterUbligo = spark.read.parquet('/IFS/PE/DaaS/DEV/intelligence/intc/analytics/users/P022923/data/parquet/04_dataBaseMasterUbligo \ndataBaseHistoryContra = sqlContext.read.parquet('/IFS/PE/DaaS/DEV/intelligence/intc/analytics/users/P022923/data/parquet/05_data \ndataBaseBorrow = sqlContext.read.parquet('/IFS/PE/DaaS/DEV/intelligence/intc/analytics/users/P022923/data/parquet/06_dataBaseBorrow \ndataBaseContract = sqlContext.read.parquet('/IFS/PE/DaaS/DEV/intelligence/intc/analytics/users/P022923/data/parquet/07_data \ndataBaseCreditMasterTC = spark.read.parquet('/IFS/PE/DaaS/DEV/intelligence/intc/analytics/users/P022923/data/parquet/08_dataBaseC \ndataBaseMasterCodSBS = spark.read.parquet('/IFS/PE/DaaS/DEV/intelligence/intc/analytics/users/P022923/data/parquet/09_dataBaseMas \ndataBaseHistoryBalanceRCC = spark.read.parquet('/IFS/PE/DaaS/DEV/intelligence/intc/analytics/users/P022923/data/parquet/10_dataBas \nmatrixFinalPropTC = spark.read.parquet('/IFS/PE/DaaS/DEV/intelligence/intc/analytics/users/P022923/data/parquet/11_matrixFinalProp \nscoreFinalPropTC = spark.read.parquet('/IFS/PE/DaaS/DEV/intelligence/intc/analytics/users/P022923/data/parquet/12_scorefinalPropT "}],"code_language":"txt"} While we are working with the Scrum methodological framework, we have iterative deliveries, so each notebook which the Data Scientists release are productivized by the developers.
The Productivization implies new developments very similar to ingests to the Data Lake, with the difference which have business logic which means the business logic is in each notebook of the different Data Scientists.
### e) Pilot Validation
In the validation from the pilot there are 2 stages:
1. **Stage in Sandbox:** The different users proceed to balance the results of their analytical models and procedures with the results obtained from the performing from the campaigns in a traditional way (35-day old process). An exact match is not expected since in many cases the models were
optimized with more reliable data and expanded the universe of possible clients to obtain credit cards.
Another characteristic from this stage is that validated notebooks are built, which will serve us in the second stage for matching the production processes. These notebooks contain automatic tables which are reading the results and matching them with the expected targets, as well as the business rules which are contemplated by the Data Scientist; Compared with the traditional software development projects these would be acceptance tests.
2. White March Stage: Started when the productivization of the processes performed by the developers was completed; here all Data Scientist notebooks have been implemented in jobs that will be performed under Spark on a mesh orchestrated by Control-M. In this way, the data resulting from the scheduled executions is going to be monitored with the validated notebooks from the previous stage. If there is some observation founded, the development is corrected and reprocessing is launched, allowing the data partition being validated to be overwritten.
### f) Deployment
The satisfactory results from the pilot of credit card campaigns allow the Big Data environment to be deployed to other initiatives of the transformation plan, reason for this, committees are formed between the Project Management and Engineering area for developing the projects according to the profitability, complexity and impact will be realized in the Big Data environment.
The work from the Solution Architects becomes relevant when they design a document with the architectural solution model for the different use cases, this global guideline helps in the elaboration from the technical and functional designs and the own ingest implementations in the Data Lake. These solutions involve all the layers of a software development such as services or the front end, so these solution architects rely on data architects to suggest specific solution alternatives in the Data Lake or outside of it.
The architecture, data scientist and engineering communities are made available with the aim of sharing experience with other countries where the financial institution also operates. This communication reinforces the good practices established and the recommendations for initiatives.
### g) Reliability and Research
Once the big data environment is performed, more projects and more users progressively consume it, which contributes to the formalization of a platform support front is crucial for the stability of a continuous work environment and the reliability of a platform (Nachiappan et al., 2017).
This support team was initially centralized for Latin America where the infrastructure of all the countries is located, but soon after, it was decentralized to the different regions providing the Engineering teams autonomy to provide access to files in sandboxes, user registrations, creation of development environments for developers, and creation of sandboxes; This autonomy improved the perception from the quality of internal services by Architecture and Engineering because the scaling of capacities is better in a distributed environment like in the case of Big Data, unlike current systems where Engineering was always an obstacle, for example increased storage.
As time goes by, new pieces come to join the Big Data environment and others to replace, in the case of Nexus by JFrog Artifactory (as a repository from configuration artifacts) or new libraries for data ingestion in the Data Lake or for measuring the quality from data in the same Data Lake; For this, Arquitectura de Datos continues with its component validation work, ensuring the correct use of each piece of the Big Data environment that comes from Spain.
The productive batch will grow while the projects and initiatives will increase, for this, the reliability of Engineering area ensures the reliability from the meshes in Control M, considering direct communication with us, the architecture team and the infrastructure commissions in Mexico.
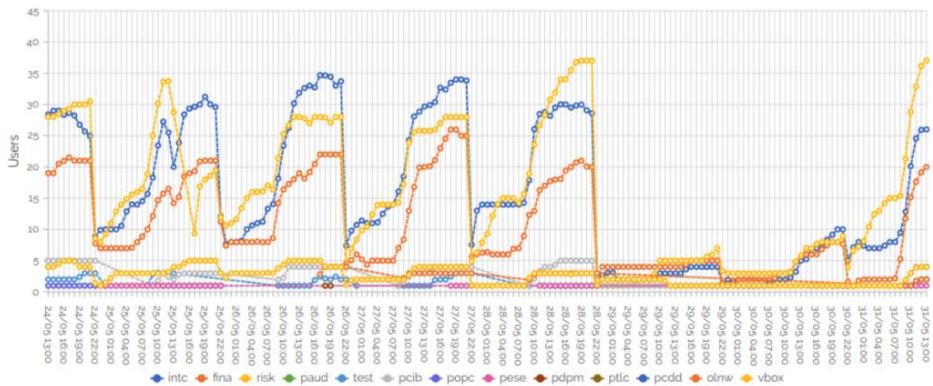
Finally, the Big Data environment is constantly monitored locally and globally through strategic KPIs, which involves resource consumption (cpus, memory and disk), user accesses, incidence analysis and monitoring of governed objects.
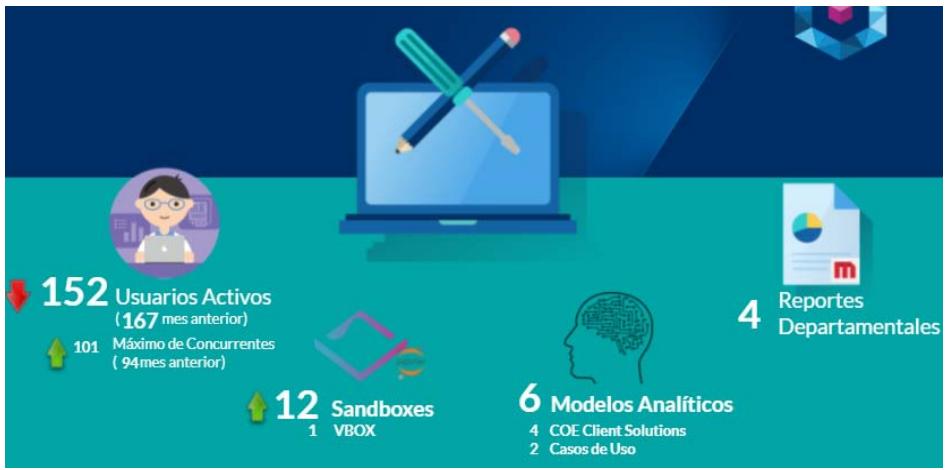 Figure 8: Example of Monitoring of the Environment
For obtaining this data, we support on tools for continuous monitoring of cores, users, memory, etc., of our Big Data environment which is in continuous evolution.
### Sandbox Info
Information about registered users and current users
Total sandboxes
13
Total current users
97
Total users
310
Users Historical Average users per hour Figure 9: Tools of De Monitoring from the Consumption in Big Data Environment
#### Home
Datio Insights
The upper graph (Sandbox Info) contains the evolution from the number of active users in the different sandboxes per minute in the last 5 days; for example, at that moment we have 13 sandboxes with 97 active users from a total of 310 users which could be connect in sometime; the Y axis are the different sandboxes.
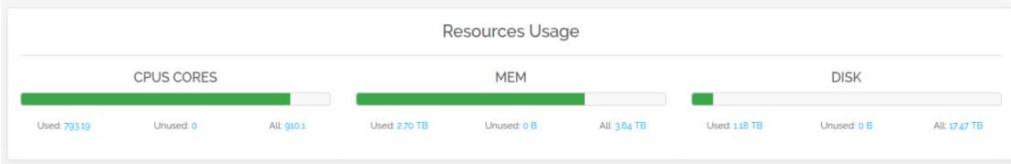
The lower graph (Home) shows in live, the cpus, memory and disk consumed in the Big Data environment; for example, the first box indicates 849 cores (cpus) from a total of 910, the second box indicates 285 TB used from a total of 364 TB, the third box indicates 1.18 TB consumed from a total of 17.47 TB.
We understand that the Platform Validation, Deployment and Reliability and Research phases described above, belong to the qualities that must be achieved in a Big Data architecture, to this are added features such as considering a distributed data processing, being scalable both in software as in hardware, being available and for distributing a large volume of data; and mainly 3 stages for the implementation of the Big Data Architecture which must be aligned to the proposals in this present article: "Obtaining data from different sources", "Real-time data processing", "Analysis, visualization and decision making". (Quiroz et al., 2019)
## III. RESULTS
As results from the integration, there are several projects working on this Big Data environment, which are productive with governed data, defined flows and with better response times in processes which were previously developed in traditional databases. With this, the business areas have more efficient products and services.
This integration of the Big data environment is the starting point for shutting down the local systems/databases, which are a problem for the organization by causing dispersed and non-consensual information between the business areas which used these data. This is solved with centralized and governed data self-service sandboxes.
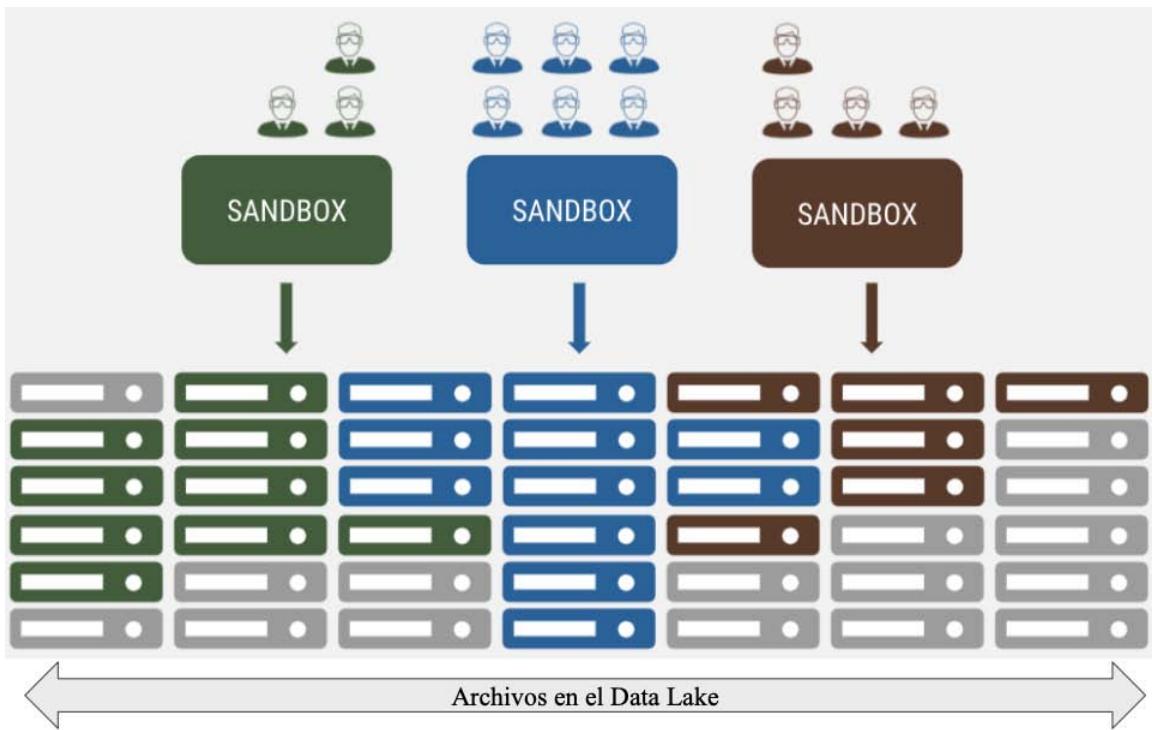 Figure 10: Design from the Distribution of Sandboxes
The first pilot from the credit card campaign was not successful, so the respective modifications were made for the following month because this campaign process is monthly. With the second attempt to execute the campaign process in the Big Data environment, the objective was achieved, reducing from 35 days to 5 days with reliable sources, adequate, efficient and governed storage.
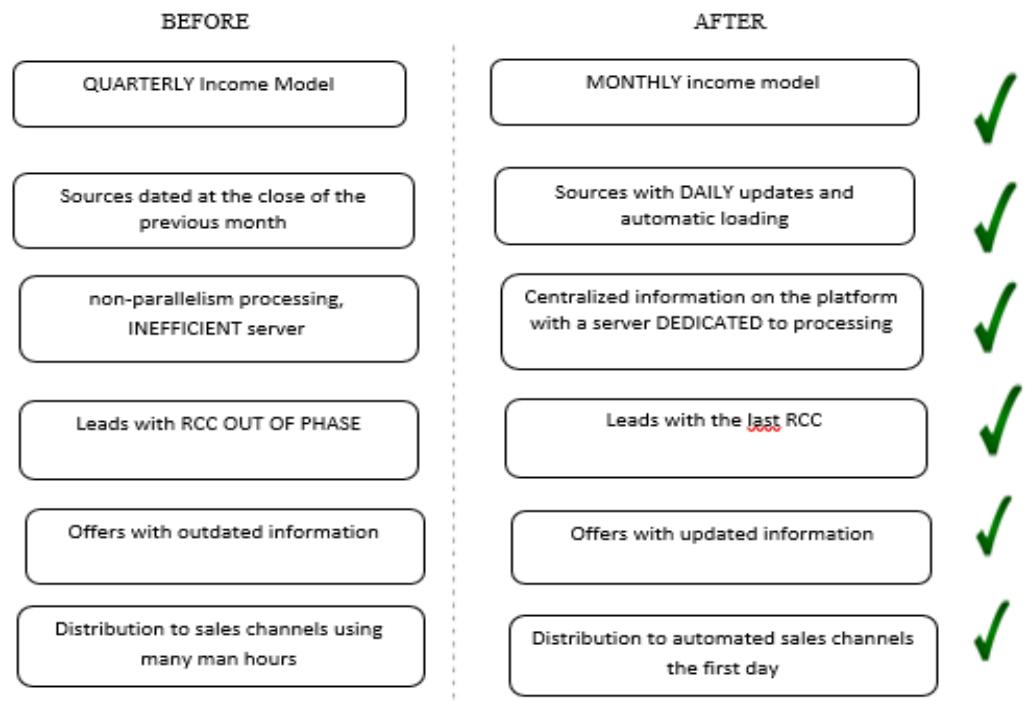 Figure 11: Qualitative Variables for Validation of the Integration
### a) Distribution to Automated Sales Channels at First Day
The use from the agile methodological framework served a lot for the iterative deliveries of the integration from the Big Data environment, but the present work could be the first stage for a new methodology which involves concepts from the software development, service levels and embedded pilots.
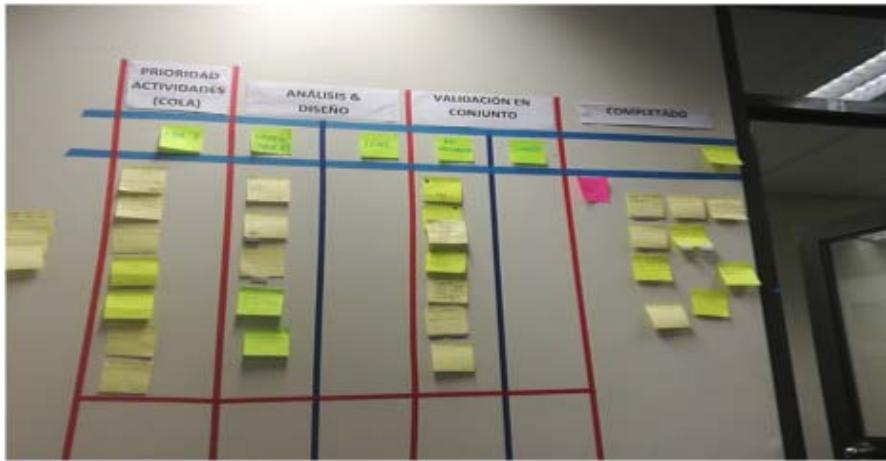 Figure 12: Scrum from the Pilot in the Integration from the Big Data
As a result, with regard to the business areas, the user is provided with data with a wide possibility of exploitation, complying with the 7 vs. The BBVA Api Market portal (BBVA et al., 2020) also considers Big Data characteristics: Volume, Speed, Variety, Value, Truthfulness, Variability, Visualization.
## IV. DISCUSSION
It is important to shut down isolated systems and databases because to the overflow related to the infrastructure, maintainability and the mismanagement of the data causing the information cannot be truthful and little by little to lack value.
With the optimized campaign process, by deploying it in Big Data, the financial entity becomes competitive with other entities in the market for customers.
The Data Scientists were not $100\%$ dedicated to the development of the pilot, this complicated many meetings for defining the rules, which in the long term, caused rework; This occurs because the respective business management areas did not want to neglect their daily operations by giving up their best resources.
Although the Data Scientists were not dedicated to the pilot, the commitment and motivation was always high and it was reflected in the rapport of the team which is vital for the success of any project.
Having a Big Data environment and a governed Data Lake provide the scenario for other types of non-financial analysis in these banking entities, but also for analysis of corporate social responsibility and/or social networks. (López et al., 2018)
## V. CONCLUSIONS
The integration of the Big Data environment in the financial management contributed to the efficient generation of products and services for the Business Development area which also optimizing its processes, internal services and decision-making at the management level.
With the Big Data environment, the business areas will develop advanced analytics for visualizing and predicting the offers from new products, services, customer segmentation and behavior for credit campaigns. Inducing the business areas to be independent from the Engineering area (which was previously responsible for all development), because they will have their own Sandboxes for their own developments and a governed Data Lake.
The governed Data Lake provides us too much volume for making decisions, in addition the information is truthful by the implanted data government which has the consensus from different business areas due to the value and variety which predominate in the Data Lake.
Finally, distributed processing and storage allow the speed from access to information and generation from reports in line is according with the competition, when users have the capabilities of Business Intelligence and Big Data.
The architecture is very flexible because to its hybrid nature (which contains open code components in its structure) adopting to the new market trends, for example, there are agreements with Google to integrate components such as: Kubernetes; or with Amazon Web Service to use your endpoints and improve the access to the services from our Big Data environment. All these components allow us to expand our knowledge and enrich the role of Data Architecture.
The use of Spark allows optimizing the processing times, using traditional data engines because the times were very high. One of the campaign model processes took 24 hours to generate results, while with spark is only 60 minutes.
Generating HTML Viewer...
References
6 Cites in Article
(2020). BBVA big data on online credit card transactions.
Galeano (2019). Las nuevas Oportunidad del Big Data para las instituciones financieras -Pedro Galeno.
Quiroz (2019). Diseño de una arquitectura para el procesamiento distribuido de grandes volúmenes de datos.
Miguel Martinez,Ricardo Andreś Aguilar,Diego Duarte,Cedeño (2019). Revista Opuntia Brava -Universidad de Las Tunas.
Rekha Nachiappan,Bahman Javadi,Rodrigo Calheiros,Kenan Matawie (2017). Cloud storage reliability for Big Data applications: A state of the art survey.
López (2018). Stakeholder Perceptions and Word-of-Mouth on CSR Dynamics: A Big Data Analysis from Twitter.
No ethics committee approval was required for this article type.
Data Availability
Not applicable for this article.
How to Cite This Article
Ulises Roman Concha. 2026. \u201cIntegration of the Big Data Environment in a Financial Sector Entity to Optimize Products, Services and Decision Making\u201d. Global Journal of Computer Science and Technology - C: Software & Data Engineering GJCST-C Volume 22 (GJCST Volume 22 Issue C2).
Explore published articles in an immersive Augmented Reality environment. Our platform converts research papers into interactive 3D books, allowing readers to view and interact with content using AR and VR compatible devices.
Your published article is automatically converted into a realistic 3D book. Flip through pages and read research papers in a more engaging and interactive format.
Our website is actively being updated, and changes may occur frequently. Please clear your browser cache if needed. For feedback or error reporting, please email [email protected]
Thank you for connecting with us. We will respond to you shortly.