## I. INTRODUCTION
The discovery and development of expert systems recorded since in the early 1970s until today. Expert systems are an offspring of the more general area of study known as artificial intelligence (AI) (Pandit, 2013). An expert system is computer program that contains a significant portion of the specialized knowledge of a human expert in a specific, narrow domain, and emulates the decision-making ability of the human expert in that area (Emmanuel & Adekunle, 2012). Expert systems are one area of artificial intelligence. Expert system is computer software had been designed for Simulates human expert in acts and activates, by the system's capability to find new facts from available facts and render advice, to teach and execute intelligent tasks (Jabbar &Khan,2015). Expert system answer to questions about specific problems by inference, including inference of human knowledge that is experts in the field. expert systems should be able to explain the reasoning process and conclusion for the final user contributed by Simin et al., (2013).In expert systems, the knowledge to develop the system is derived from human experts (hence the name) (Tripathi,2011).According to (Pandit,2013), one of the principal attractions of expert systems is that they enable computers to assist humans in many fields. These systems are rule-based systems are used to store and manipulate knowledge to interpret. A rule consists of two parts: condition (antecedent) part and conclusion (action, consequent) part, i.e.: IF (conditions) THEN (actions) Antecedent part of the rule describes the facts or conditions that must exist for the rule to fire. Consequent describes the facts that will be established, or the action that will be taken or conclusion that will be made. Information in a useful way. They are often used in artificial intelligence applications and research (Pandit, 2013).Knowledge is the key success in the performance of an expert system. Acquisition of the desired knowledge for the problem domain was obtained from intelligent human experts, said Adekunle et al.,(2018). Expert Systems have been designed to assist in solving set of various problems, for instance, expert systems for designing and planning, classification & identification, prediction, Repairs, forecasting, discovery, diagnosis, monitoring control (Tan et al., 2016) etc. however, expert system for control and maintenance of steam package boiler is new as this was not benefitted and so specifically deployed in fertilizer plants.
## II. LITERATURE REVIEW
Mrudula(2013) gives reasons on his experts review article, that expert system models the knowledge of the human expert, both in terms of content and structure. His conclusion remains that one of the principal attractions of expert systems is that they enable computers to assist humans in many fields, and that these systems are rule-based systems are used to store and manipulate knowledge to interpret. According to Amit (2012), the impurities found in boiler water depend on the untreated feed water quality, the treatment process used and the boiler operating procedures.
### a) Expert System Theory
Generally, the higher the boiler operating pressure, the greater will be the sensitivity to impurities. Therefore, the American Trainco, Inc. (2006), states operators (users) are responsible for control and maintaining the boiler in a safe and efficient manner with sound engineering practices and manufacturer's specified maintenance procedures. Mrudula (2013) describes different types of expert systems. They are rule-based expert system, fuzzy expert system, frame based expert system, and hybrid expert systems, many expert systems are in real use and in the future one is likely to see more expert systems packaged with domain knowledge being sold. Amit (2012) added that boiler devices comprise of feed water system, steam system and fuel system, and that industries worldwide are going through an increasing and stiff competition and increased automation of plants, like the Ovation expert system. Seán et al., (2014) suggested in their paper that an expert system performance could discover excessive levels of blow down in steam package boilers, and diagnose the reason, which could be related to feed water conductivity, or component issues, which becomes necessary and in line with the main area were this dissertation is providing solutions.
### b) Expert System Research on Maintenance
Edgar et al., (2010), contributed by developing an expert system for fault diagnostics in condition-based maintenance and that the goal of the system is provided to the non-experts in industrial maintenance with a list of possible failure modes, decisions to be adopted. Affirmed by Nwaibu & Adeyanjo (2012), is the development of user centered design approach to situation awareness which if applied to system will certainly aid the operation of the system.
Cucu et al., (2009) examining the causes of equipment failure and malfunction been a central application field of expert systems or of data bases, in general, Chee et al.,(2016), exploits the enhancement of expert systems in engineering, and therefore, an expert system implies into the engineering and manufacturing process can provide greatest assistance for operational workers during performances and deal with critical and important tasks. Bretz (1990) discussed on a comprehensive expert system that assists in power plant boiler failure analysis and the maintenance planning subsystem automatically prepares daily repair schedules, a work estimation plan, and work specifications. Konstantin, et al., (2020) discussed that ES are very advantageous for steam turbine unit (STU) diagnosis.
### c) Expert System Research on Control
Emerson Process Management Power and Water Solution Inc (2011), Ovation expert system was designed to help you achieve operational excellence and create a sustainable competitive advantage, with standard hardware platforms, operating systems, and network architectures.
Krishan (2016), proposed a fuzzy expert system, using fuzzy control design a simulation system of fuzzy logic controller for water tank level control by using simulation package which is Fuzzy Logic Toolbox and Simulink in MATLAB. Anabik & Denis (2012), on boiler temperature and water control, designing an expert system, using fuzzy logic on FLC based boiler control, the proposed method consists of two sections. first section is to develop a steam temperature monitoring and control system and the second section consists of water level control. For both sections Fuzzy Logic Control will be used. Celin et al., (2016) proposed modeling and control of a 200 MW power plant using the embedded fuzzy approach. The embedded fuzzy based boiler control consists of models, and the output of the network is the interpolation of the models' using memberships.
In line with power evaluation and control, a fuzzy based expert system named Nuclear Power Plant Operator Evaluation Expert System (NPPOEX) is one of the latest expert systems which shows the use of expert system techniques in the personal evaluation process, Yangping et al., (2011).
Harald & Georg (2015) proposed Expert Systems (ES)- Smart Solutions for Power Plants that can support operators and engineers in different areas. Monitoring systems like SR::EPOS enable continuous gathering and analyzing of data and thus can help to detect various problems very fast to avoid a reduction of efficiency or damages
Marco et al., (2003) and Tavira-Mondragon et al.,(2011) agreed that Control remaining the center of operations in the industries, Seán et al., (2014) said operator expertise is generally capable of reacting to faults and performing corrective measures, guidance using expert systems will improve operation and reduce downtime.
## III. METHODOLOGY
According to Anne (2013), when conducting research or degree projects, methods and methodologies are essential to plan and steer the work to achieve proper, correct, and well-founded results, and on disciplines within computer sciences, the focus is often on the work with the research rather than methods.
To produce a good system that will meet functionality and performance for users in boiler control and maintenance for fertilizer plants, the researcher brought in his computing and instrumentation engineering knowledge geared towards his working experience of more than ten (10) years alongside with the domain practitioners to understand more of the activities of the plant. To attain these task or objectives, is by integrating action research method and object-oriented development (OODA) for the modelling.
### a) Action Research Method
According to Bryman and Bell (2011), action research is "an approach in which the action researcher and a client collaborate in the diagnosis of the problem and in the development of a solution based on the diagnosis. One of the main characteristic traits of action research relates to collaboration between researchers and member of organization to solve organizational problems. In line with the quantitative and qualitative research approach proposed by Kusumarasdyati, (2016), the method has advantages added Bryman & Bell (2011).
Both the numerical values for the quantitative and non-numerical values for the qualitative were all under technical, practical, and emancipatory action research. The numerical values are from the boiler drum recommended quality and feed water recommended quality, whereas the non-numerical entails the boiler problems and causes extracted from the O&M of fertilizer plant manual. Also, the researcher conducted one-on-one interview with fourteen (14) of the fertilizer plant boiler domain practitioners, carrying out dynamic simulations during the design of proposed system, changes were made based on their recommendations on the application on consistency, correctness, and its precision. The dataset numeric values are corresponding to the physical or chemical state of the boiler system, control measures such as shutdown, bidirectional or one directional flow, open on excess fluid, or close on excess fluid can be used to control the performance of the steam package boiler to keep it in a workable condition. The performance and health of the steam package boiler can be control, measured and monitored using process measuring, control and sensing devices such as pressure gauges, temperature sensor (transducers), flow and level gauges, actuating valve etc. which are incorporated in the proposed system designed. The idea is to take all the useful dataset from the boiler manual according to its performance and capability in different operation points to model better system for plant control and maintenance as stated by Michael (2016), same as applied in user centered design approach to situation awareness, Nwiabu & Adeyanju (2012).
### b) Objective-Oriented Development Approach
Nabil & Govardhan (2012) describe object-oriented (OO) approach as a system development methodology that follows an iterative and incremental approach to systems development. In each increment or phase, the developers move through the activities of gathering requirements, analyzing the requirements, designing the system, implementing the design, and testing the system. Adetokunbo et al., (2013) added that object-oriented approach models its processes using objects. That is, the solution of problems can be seen as a set of objects or computations performed in the context of objects. Data and the processes that act on the data are encapsulated within every object. Each object's data (attributes or states) are the properties that relate to the object.
Nabil & Govardhan, (2012), added that object-oriented development approach (OODA) uses a set of diagramming techniques known as the Unified Modeling Language or UM and focuses on the three architectural views of a system: functional, static, and dynamic, makes use of iterative and incremental steps, it gives opportunity to manage changes as they occur to user requirements. So, it is more prone to user satisfaction. In this research work, the steam package boiler is object to be controlled and maintained. The Java programming language is suitable for the proposed system development because each module in the system is seen as classes, this gives the environment to develop a user interface for interaction with the system.
## IV. EXPERT SYSTEM ARCHITECTURE
The expert system architecture of the steam package boiler rule-base system and fuzzy logic is shown in Fig1. It shows the encoded knowledge of the domain expert put into the system's database where the inference engine would make use of it to process and determine the working state and errors of the system.
When the system runs on the manual operation mode (MOM), the user (field operators/engineer) enters the correct parameter set points which enable a corresponding output from the input signal and expected value of the affected plant system as authorized by their plant shift-in-charge (SIC) or plant operations manager. In the expert system shell, data flow bi-directional to check values from plant (field instruments) and from field operator or process system engineer navigating the system.
The description of the system architecture as shown in Figure1 below, has the processes of both fuzzification and defuzzification, which plays major roles in the system architecture. The fuzzy logic is found in the part of the inference engine, where the software system converts rules to code and codes back to rules.
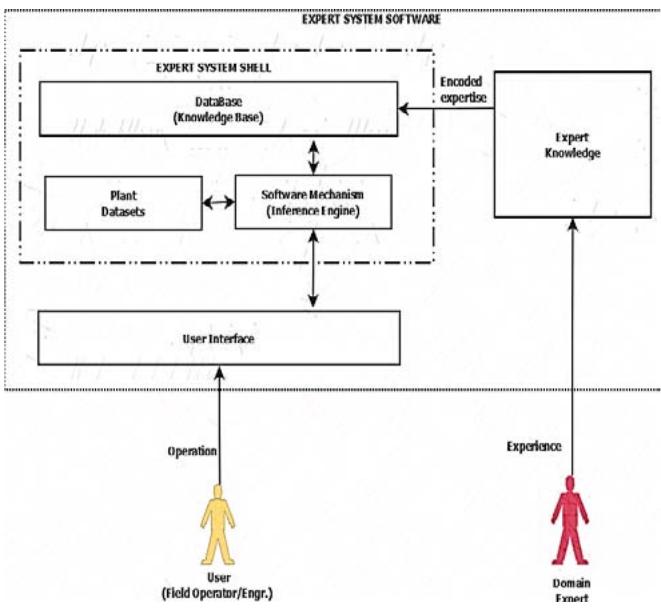 Figure 1: The Expert System Architecture
Domain Expert: The domain expert is the personnel either designing the ES shell or putting in his/her knowledge into the system. It has a ready and mostly accurate knowledge and experience on the proposed system shell to be designed. The expert then encodes their knowledge into the system, by making it understandable for the machine to read by fuzzification.
Knowledge Base (KB): The KB is the part of the ES shell which holds the encoded expert knowledge where the inference engine gets its own knowledge. It is knowledge warehouse or library of the entire ES shell.
Datasets/Software Mechanism (Rule of Engine): This is the process of converting a fuzzy system statement or expression into a software usable or understandable language. The fuzzified expression or language is in the form of a fuzzy system membership form. This is the process where the software makes use of the datasets in the system as encoded by the domain expert.
Plant Datasets: The plant datasets are then extracted from the inference engine (core of the fuzzy system) to be used for proper working of the plant. This process is bi-directional where the plant gets its datasets from the inference engine and gives its current datasets working condition to the inference engine for control.
User interface: this is the part of expert system architecture that helps the user to be in contact with the system so we can consider it as the main engine of expert system.
The User (Field Operators/Panel Engineers): The user on operations logs into the main system with an authenticated username and password. Users carried out required corrections of errors on the UI when the system is running on MOM and monitor and maintained the progress of the system on AMOs.
### a) Steam Package Boiler Rule-Base Fuzzy Logic
The system has a inference kernel and a knowledge-based linked. The inference kernel (engine) is executed periodically to determine system output based on current system input. The knowledge-based contains membership functions and rules.
Fuzzification: The current input values are compared against stored input membership functions, usually in a program loop structure to determine the degree to which each linguistic variable of each system is true.
Defuzzification: Dissolves multiple degree ambiguous by putting raw fuzzy outputs into a composite numerical output.
Rule-Base Evaluation: on the rule-base evaluation, this processes a list of rules from the knowledge-based using current fuzzy input values to produce a list of fuzzy output linguistic variable.
Therefore, the system has the processes of both fuzzification and defuzzification, which plays major role in the proposed system architecture. The fuzzy logic is found in the part of the inference engine, where the software system converts rules to code and codes back to rules.
## V. STEAM PACKAGE BOILER EXPERT SYSTEM DESIGN
### a) Datasets
The datasets used are extracted from Section C, Boiler Manual (2020). Boiler drum water and Feed water recommended qualities datasets are used for the design of the fuzzy logic system. According to Amit (2012), the impurities found in boiler water depend on the untreated feed water quality, the treatment process used and the boiler operating procedures. As a rule, the higher the boiler operating pressure, the greater will be the sensitivity to impurities. The boiler safety, emergency procedures datasets are used because that area is where fault solutions are placed. The datasets are placed in a tabular form as shown below in table 1 and 2.
Table1: Boiler Drum Water Recommended Quality
<table><tr><td>Parameters</td><td>Unit</td><td>Value</td></tr><tr><td>Ph Value</td><td>-</td><td>10.8 - 11.4</td></tr><tr><td>Alkalinity as CaCO3</td><td>ppm</td><td>190</td></tr><tr><td>Sodium Phosphate as PO4</td><td>ppm</td><td>29 - 34</td></tr><tr><td>Total Dissolved solids</td><td>ppm</td><td>143</td></tr><tr><td>Silica SiO2</td><td>ppm</td><td>4</td></tr><tr><td>Oil and Organic matters</td><td>ppm</td><td>Nil</td></tr></table>
Table 2. Feed Water Recommendation Quality
<table><tr><td>Parameter</td><td>Unit</td><td>Value</td></tr><tr><td>General appearance</td><td></td><td>Clear and Colourless</td></tr><tr><td>Total hardness as Caco3</td><td>ppm</td><td>Commercial zero</td></tr><tr><td>Total Fe</td><td>ppm</td><td><0.025</td></tr><tr><td>Total Cu</td><td>ppm</td><td><0.02</td></tr><tr><td>Oil and Organic</td><td>ppm</td><td><0.1</td></tr><tr><td>Ph Value At 25oc</td><td>ppm</td><td>8.5 - 9.5</td></tr><tr><td>Total dissolved solid</td><td>ppm</td><td><1.5</td></tr><tr><td>Reactive SiO2max</td><td>ppm</td><td><0.20</td></tr></table>
### b) System Use Case Diagram
Use case diagram give simple overview of an interaction of the proposed system users can have more about what is happening. This detail can either be a simple textual, a structural description in a table or a sequence diagram and it is used to support requirement elicitation. This use case diagram shows the user's (field operator/engineer's) interaction with the proposed system, here the user navigates the proposed system and get the expected results/output.
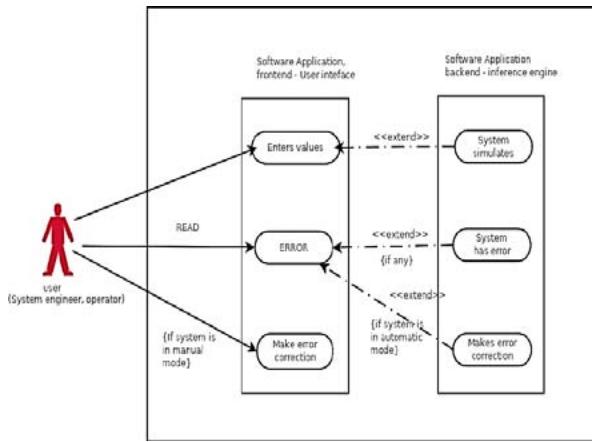 Figure 2: Use Case Diagram of the System
The use case diagram shows the actors (field operator/engineer) using the system. The user enters values required for the steam package boiler, to keeps the system on control, maintaining the required set points of pH values, feed water and boiler drum water level qualities etc., reduced downtime and boiler damages. When the system panel indicator displays red on either side of panels due to drifting of the steam boiler parameter set points, the user (field operator/engineer) should be able to see it and effect changes. On a MOM, the user makes more corrections during navigating the system, while the system on AOM, restores system errors on either boiler drum or feed water qualities as parameters drifted from their set points which effect system and make changes to keeps the boiler working efficiently.
### c) System Activity Diagram
The activity diagram reveals the events of the user (field operator/Engineer) using the system. The user opens the app, check the system values. If the boiler runs with correct values as design specifications, the system runs smoothly and efficiently, otherwise, the user inputs the required parameter values to control and maintain the steam boiler system.
This system using the rule-base system & fuzzy logic technologies was designed to run in two modes, manual operation mode (MOM) and automatic operation mode (AOM). The auto run was selected due to faster and quicker response for equipment operations as instrument air is on FO/FC condition.
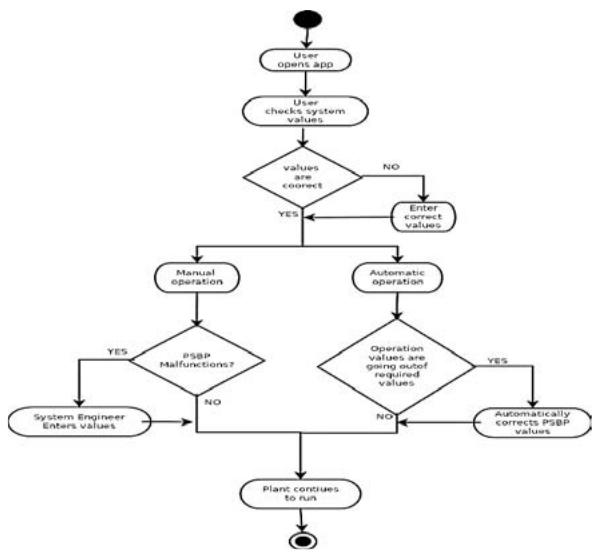 Figure 3: System Activity Diagram
On MOM, when the system malfunctioning is detected by a drift in setpoint parameters the user (field operator/engineer) inputs values for corrections which enables efficient control and smooth running of the steam boiler device, otherwise, the plant operation manager required for the maintenance team (Mech, Electrical and Instrument) to carry out maintenance by bye-passing required field equipment's. If the system is runs on AOM, and there is erratic or faults detections, and values are drifting from required default parameter setpoints, the system would automatically make corrections which aid continues running of boiler plant.
The process of designing this system, is aimed at providing detailed dataset from Table1 and Table2 and other system elements that enable the development and implementation reliable. The system is designed is such a way that, the output variables or condition of the steam package boiler controls its input variables or condition of the boiler device. The pH value at 25oCin the table above has a range of value suitable for the application of fuzzy logic system. The FLS is designed as follows.
#### Algorithm
1. Define linguistic variables and terms (start)
2. Construct membership function for the terms (start)
3. Construct knowledge base of the rules (start)
4. Construct crisp data into fuzzy datasets using membership functions (Fuzzification).
5. Evaluate rules in the Rule Base (Inference Engine)
6. Combine results from each rule (Inference Engine)
7. Convert output data into non-fuzzy values (Defuzzification)
#### Development
1. State(s) = {very-low, low, normal, high, very-high}
2. Constructing membership function
Table 3: Ph Value at 25oc Showing Membership Values
<table><tr><td>M/Class</td><td>Class/R</td><td>Grade</td></tr><tr><td>LP</td><td>x = 9.5</td><td>L/value</td></tr><tr><td>MP</td><td>x = 9.25</td><td>H/Average</td></tr><tr><td>S</td><td>x = 9</td><td>Average</td></tr><tr><td>MN</td><td>x = 8.75</td><td>Lower/Average</td></tr><tr><td>LN</td><td>x = 8.5</td><td>Smallest/Value</td></tr></table>
The above table3 has been used to design a membership function graph for the membership values in the table, as calculated with the datasets of pH value at 25oC ranging between8.5ppm (actual minimum value) to 9.5ppm (actual maximum value).
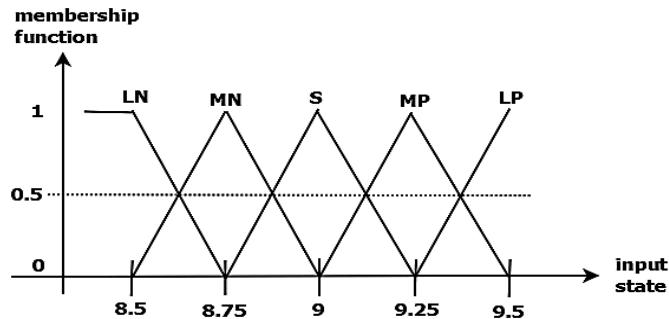
Graph 1: A graph of membership function of pH value at 25oC ranging between 8.5ppm (Mini value) to 9.5ppm (maxi value). 1 and 4. Constructing a Knowledge Based Rule from the membership function.
Table 4: Membership function table -membership function replaced with actual numeric values. The actual rule from the inference engine will be as follows:
<table><tr><td colspan="2">State</td><td colspan="4">Target (s)</td></tr><tr><td>-</td><td>Very/L</td><td>Low</td><td>Normal</td><td>High</td><td>Very/H</td></tr><tr><td>Very/L</td><td>No/C</td><td>8.75</td><td>9</td><td>9.25</td><td>9.5</td></tr><tr><td>Low</td><td>8.5</td><td>No/C</td><td>9</td><td>9.25</td><td>9.5</td></tr><tr><td>Normal</td><td>8.5</td><td>5.75</td><td>No/C</td><td>9.25</td><td>9.5</td></tr><tr><td>High</td><td>8.5</td><td>8.75</td><td>9</td><td>No/C</td><td>9.5</td></tr><tr><td>Very/H</td><td>8.5</td><td>8.75</td><td>9</td><td>9.25</td><td>No/C</td></tr></table>
From the boiler drum water recommended quantity and following the same steps of 1, the pH value (10.8 - 11.4) and the Sodium Phosphate as PO4 (29 - 34) Fuzzy Logic Rule Base System will be developed using the parameters from table1.
The steps in the algorithm of 1aare followed in the system design and development of the pH value and Sodium Phosphate as PO4 membership function and fuzzy logic rule base system.
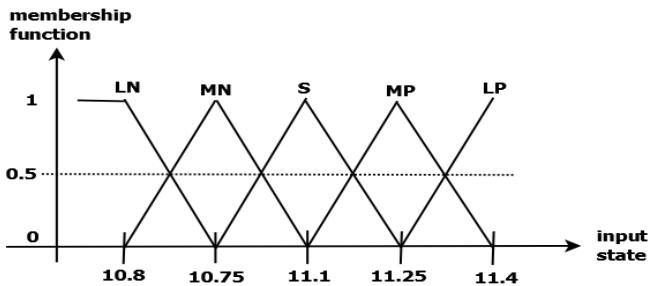
Graph 2: Show above is a graph of the membership function of pH ranging between 10.8 ppm (min value) to 11.4 ppm (maxi value).
- R1: IF STATE= (10.8 OR 10.75) AND TARGET = 11 THEN ALERT
- R5: IF STATE= (10.8 OR 10.75 OR 11.1 OR 11.25) AND TARGET = 11.4 THEN ALERT
Listing 5.a
R1: IF STATE= (10.8 OR 10.75) AND TARGET = 11.1 THEN SET STATE=11.1
R5: IF STATE $=$ (10.8 OR 10.75 OR 11.1 OR 11.25) AND TARGET $= 11.4$
THEN SET STATE=11.1
Listing 5.b
Listing 5. Listing 5.a Manual mode, and Listing 5.b Automatic mode, are both the final Rule-Base System used in the Inference Engine of Sodium Phosphate as PO4 ranging between 10.8ppm (mini value) to 11.5ppm (maxi value).
Table 5: Membership Function of Numeric Values of pH Ranging Between 10.8 ppm (mini value) to 11.4 ppm (maxi value) table.
<table><tr><td colspan="2">State</td><td colspan="4">Target(s)</td></tr><tr><td>-</td><td>V/Low</td><td>Low</td><td>Normal</td><td>High</td><td>V/High</td></tr><tr><td>V/Low</td><td>No/C</td><td>10.75</td><td>11.1</td><td>11.25</td><td>11.4</td></tr><tr><td>Low</td><td>10.8</td><td>No/C</td><td>11.1</td><td>11.25</td><td>11.4</td></tr><tr><td>Normal</td><td>10.8</td><td>10.75</td><td>No/C</td><td>11.25</td><td>11.4</td></tr><tr><td>High</td><td>10.8</td><td>10.75</td><td>11.1</td><td>No/C</td><td>11.4</td></tr><tr><td>V/High</td><td>10.8</td><td>10.75</td><td>11.1</td><td>11.25</td><td>No/C</td></tr></table>
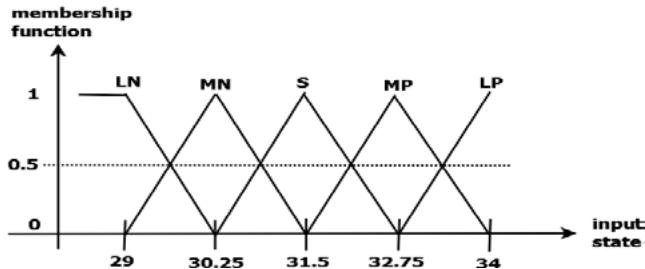
Graph 3: A Graph of Membership Function of Sodium Phosphate as PO4 ranging between 29ppm (minimum value) to 34ppm (maximum value).
Table 6: Membership Function of Numeric Values of Sodium Phosphate as PO4 Ranging between 29ppm (Min value) to 34ppm (Maxi value).
<table><tr><td colspan="2">State</td><td colspan="4">Target(s)</td></tr><tr><td>-</td><td>V/low</td><td>Low</td><td>Normal</td><td>High</td><td>V/high</td></tr><tr><td>V/Low</td><td>No/C</td><td>30.25</td><td>30.5</td><td>32.75</td><td>34</td></tr><tr><td>Low</td><td>29</td><td>No/C</td><td>30.5</td><td>32.75</td><td>34</td></tr><tr><td>Normal</td><td>29</td><td>30.25</td><td>No/C</td><td>32.75</td><td>34</td></tr><tr><td>High</td><td>29</td><td>30.25</td><td>30.5</td><td>No/C</td><td>34</td></tr><tr><td>V/High</td><td>29</td><td>30.25</td><td>30.5</td><td>32.75</td><td>No/C</td></tr></table>
R1: IF STATE= (29 OR 8.5) AND TARGET = 9 THEN ALERT
R5: IF STATE= (29 OR 8.75 OR 9 OR 9.25) AND TARGET =9.5 THEN ALERT
Listing 6.a
R1: IF STATE= (29 OR 30.25) AND TARGET = 30.5 THEN SET STATE=30.5
R5: IF STATE= (29 OR 30.35 OR 30.5 OR 32.75) AND TARGET =34
THEN SET STATE=30.5
Listing 6.b
Listing 6. Listing 4.a Manual mode, and Listing 4.b Automatic mode, are both the final Rule Base System used in the Inference Engine of pH value at 25oC ranging between 29ppm (mini value) to 34ppm (maxi value).
### d) MembershipData and Fuzzy Logic System Class Diagram
The class diagram of the designed project class files is written in Java programming language (JPL). The diagram shows the private, public methods and variables of each class. It also shows how each class relates to one another, through inheritance (i.e., extension) or implementation (the use of interface class) as show by the lines. The expert system of the proposed system has two major selected class for the purposes of this research, which is the Membership Data class, and the Fuzzy Logic System are shown below.
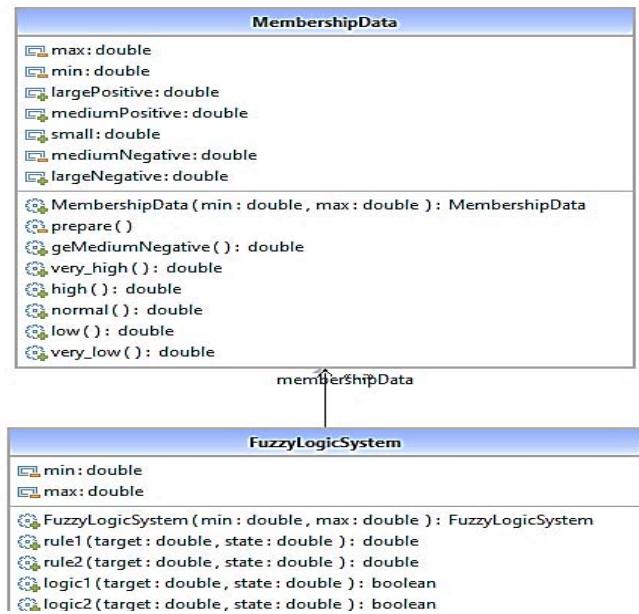 Figure 4: MembershipData and Fuzzy Logic System Class Diagram
### e) System User Interface
The main purpose of this application user interface is to enhances the field operator/engineers with less effort to navigate and received maximum desired outcome from the system. The steam package boiler ES Graphical user interface is menu-driven type and are shown in Fig7 below. Functions of the system was carried out with a dynamics simulation process in this research work.
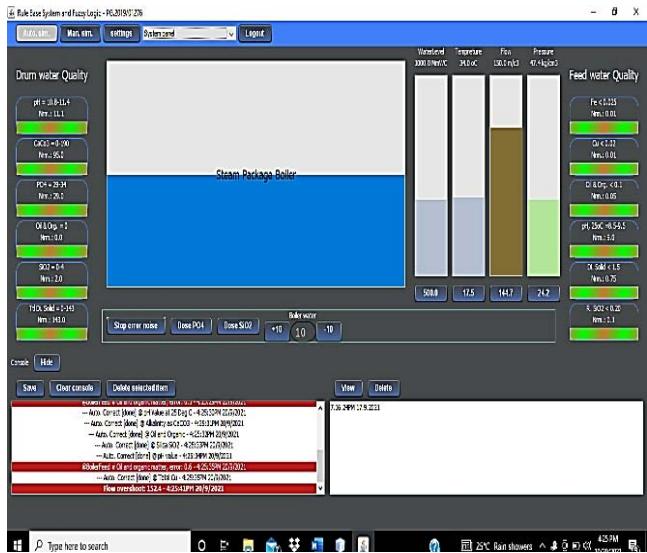 Figure 5: System User Interface
All manual and auto operations take place on this UI, it shows the window style view of the entire structure of the proposed system. Schematically it shows the drum water quality and feed water quality panels, steam package boiler drum, water level, temperature, flow, pressure, console etc. on its panel. Also, on the menu bar of the application shows the Auto sim button, manual sim button, setting button, system panel dropdown and logout menu button (Figure7).
### f) Admin and User login Interface
This is the interface for both admin authorization and user login to have access to the main application.
The UI is design to enable admin to provide his login details before the user (field operator/engineers) can have access the main application. The Exit button is clicked to close the application. When credentials are correct the system gives access to the user to access the main application screen as shown in Figure 8.
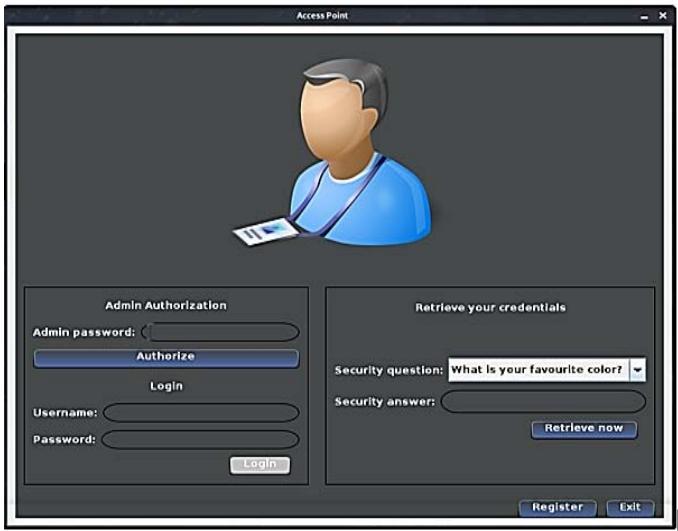 Figure 6: Admin and User Login Interface
### g)User Registration Window
On the registration window, the admin double clicking on the Expert System icon on the Desktop and splash up of the user access point window comprising of register and exit button.
The system is design for the admin to grant access to the user before he/she can have access to the system. An evaluated and validated window result for a successful registration process of a New User (Field operator/Process Engineer) carried out by the admin is shown in Figure7 below:
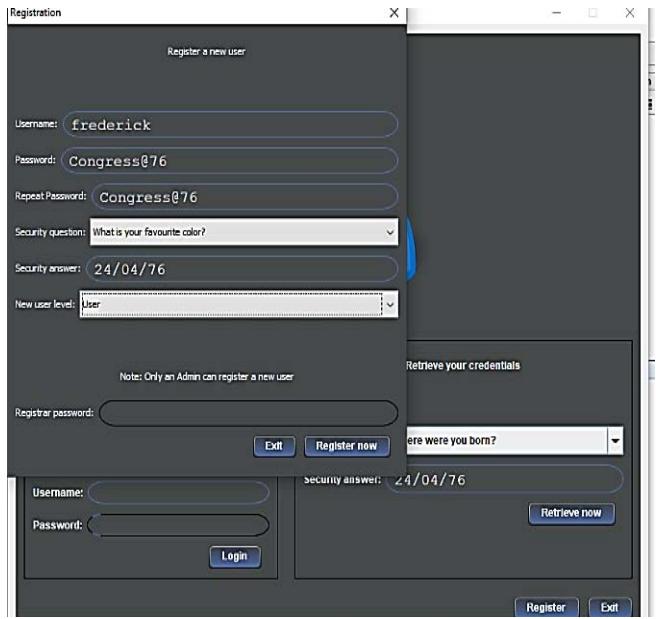 Figure 7:User Registration Window
Admin Authorization Window: This comprises of the following textbox, Admin password and authorize button, the (field operator/Engineer) username, password, and login button. Retrieve your credentials Window: it also comprises of the text boxes, security question, security answer and retrieve now button.
The above window interface also assist user with a forgotten login credentials, user (field operator/engineer) is expected to choose a security question and type the answer in the given text box and click the "Retrieve Now" button as shown in figure 6.
### h) The Main System Control Panel Interfaces
The main control panel interface is where the users will navigate, monitor, controlled, and maintained the real-time conditions and readings (default parameters of the steam package boiler expert system with their operating setpoints for better efficiency, reliability, performance, and product throughput. The main control panel interface comprises of seven (7) panels as shown on Fig7. above.
- The Top Control Panel
- The Drum Water Quality Display Panel
- The Feed Water Quality Display Panel
- The Level, Temperature, Flow and Pressure Bars
- The Steam Package Drum
- The Bottom Control Panel
Each of these operational panels are describe below for better understanding.
The top control panel: This is menu situated on top of the main application comprises of simple "automatic and manual sim" buttons", "setting" button, panel selection drops down menu bar and "logout" button. The automatic simulation button is used to run and navigate the steam package boiler in an Auto Mode where all errors are corrected by the designed fuzzy logic system.
The Drum Water Quality Display Panel: This drum panel on the main application displays the real-time parameter values of the Total Hardness as CaCO3 in ppm, Tl (ppm Fe), TC (ppm Cu), Oil & Organic, pH value at 25 Deg. C, total dissolved solids (ppm TDS), and the Reactive Silica max (ppm SiO2) of the water in the boiler drum, in their respective range of values. When there are low or high values in the drum water quality parameters as calibrated setpoints desired for running of the steam package boiler ES, the green horizontal bars on the drum water panel turned red or green as shown fig8. Also, the boiler drum water quality should be continuously monitored and suitable adjustment in blowdown is carried out to maintain the drum water real-time values as per the steam package boiler design recommendations.
The Feed Water Quality Display Panel: This feed water panel on the main steam package boiler displays the real-time values of running plant with the setpoint of pH value, alkalinity of CaCO3 in ppm, Sodium Phosphate as PO4, total dissolved solids (ppm TDS), Reactive Silica max (ppm SiO2), and Oil & Organic matters present in the feed as it goes into the steam package boiler drum, in their respective range of values. When there are low or high values in the feed water quality parameters as setpoints desired for the functional operation and running of the boiler system, error will be seen as the horizontal bar indicator turned red on the panel on the feed water quality panel.
The Steam Package Boiler Process Measurement Parameters
The four (4) bars on the main application interface represent these four main process measurements in the industry, first is the water Level in the drum (1000 MmWc), Temperature of the drum (34 Deg. C), Flow of the feed water (150 m/c3), and the Pressure that is built up in the drum as it is heated up (47.4 kg/cm3). These four (4) PMP can be seen on the main SPB main application interface as shown in Figure5. Each of the PMP values on the bar can be reset by mouse clicking the button below each of the parameter bars to get an input popup box. The user input textbox receives only the calibrated range specifies. Inputting right range values into the textbox will remove the red colour indicator on any of four parameter bars as required.
The Steam Package Boiler Drum: The steam package boiler is one the main fertilizer section that is monitored during operations. The boiler system drum can be seen on the main application interface. The water level is monitor with the result obtained from the four industry measurement parameters vertical bars representing pressure, temperature, level, and flow.
The Bottom Control Panel: This panel comprises of the "Stop Error Noise" used to stop any error noise during operations, the noise is coming due to system error, "Dose PO4" and "Dose SiO2" buttons are used for dosing as required to maintain feed & boiler water qualities at a desirable level, on clicking either of this button will bring a pop-up window with an input textbox which receives the value from any user (field operator/engineers) of the system.
The Console Panel: This panel is another important located on the bottom control. The result of using the console panel button is seen when it is mouse clicked, it comprises of the save, hide, view, and delete buttons. Each result of these buttons shown in fig10 below.
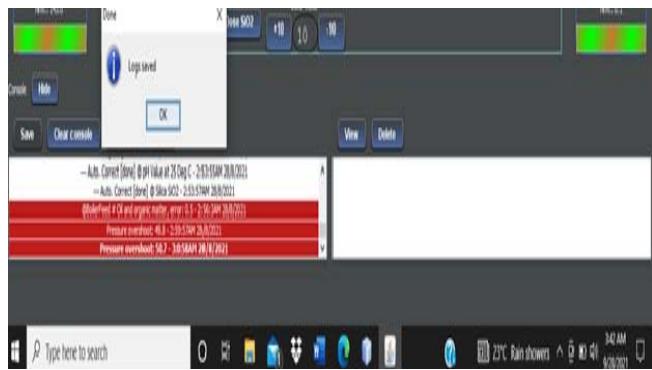 Figure 8: The Control Button
## VI. EVALUATION AND RESULTS
The performance of every system after design and installation will be monitored to check if it's working properly, meaning to check if the system meets the design specifications. In other to evaluate, validate the correctness of proposed system by the boiler domain practitioners, the following parameters were used for dynamic simulation, Actual Minimum Range, Actual Maximum Range, Test values Worst-case and Test values Best-case were tested with the following conditions.
Actual Values: These values range are the boiler parameters from minimum to the maximum required limits of the system design specification. The healthy, proper, and effective performance on control and maintenance of the steam package boiler depends on these parameters operating within the required range and limits as shown below on the tabulated Table7 of worst-case and best-case test values.
Test Values: There are two type of test values used in this discussion, the worst-case and the best-case test values.
1. Worst-Case: The worst-case value are the values outside the expected functional range of the required plant parameters value. This worst-case value is used to monitor, examine, and evaluate the behaviour of the SPB if the water chemical component quality exceeds or falls below the required set value.
2. Best Case: The best-case values are the values which are set within the required functional range of the plant water chemical components.
Table 8: Parameters Test values (Worst-case/Best case) used for the dynamic simulation process to validate the system consistency, correctness, and its precision.
<table><tr><td>Parameters</td><td>AMR</td><td>AMR</td><td>Tv/Wc</td><td>Tv/Bc</td></tr><tr><td>BDWQ</td><td></td><td></td><td>I</td><td>I</td></tr><tr><td>Ph Value</td><td>10.8</td><td>11.4</td><td>10</td><td>11.2</td></tr><tr><td>Po4(Ppm)</td><td>29</td><td>34</td><td>43</td><td>32</td></tr><tr><td>Silica SiO2</td><td>0</td><td>4</td><td>6</td><td>2</td></tr><tr><td>FWQ</td><td></td><td></td><td>I</td><td>I</td></tr><tr><td>Total Fe</td><td>0</td><td>0.025</td><td>2</td><td>0.010</td></tr><tr><td>Ph@25Deg C</td><td>8.5</td><td>9.5</td><td>8.2</td><td>8.9</td></tr><tr><td>TDS (ppm)</td><td>0</td><td>1.50</td><td>1.8</td><td>1.2</td></tr></table>
### a) Dynamic Simulation of Operational Steam Boiler Drum Water Quality Parameters
The researcher explores a dynamic simulation process alongside fourteen (14)fertilizer boiler domain practitioners on three (3) qualities as displayed on the drum water panel of the boiler system comprising on its pH value, Sodium Phosphate (PO4) and Silica max (SiO2).
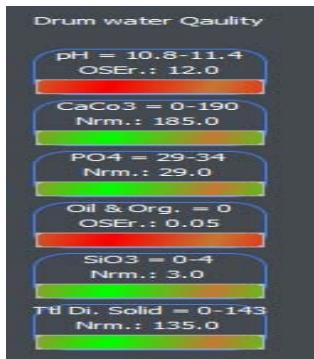 Figure 9: Drum Water Quality Display Panel
## i. Dynamic Simulation for Worst-case and Best-case values for Drum Water Quality on pH value
The results of the dynamic simulation process of the parameter of pH value range of 10.8-11.4 with worst-case pH of 10. The system displaying this value, less than the designed setpoint (10.8), turns red the boiler parameter indicator bar and user clicking gives the system popup request to enter the right value to validate that the pH value of 10 is erratic. Also, the boiler panel displays green as the user enters best-case functional of pH value of 11.2 and this validates the system after evaluation.
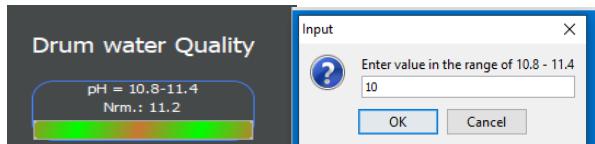 Figure 10: Ph Value of 10
ii. Dynamic Simulation for Worst-case and Best-case values for drum water quality on Sodium Phosphate as PO4 On the dynamic simulation process of sodium phosphate as PO4, the user views boiler panel displaying 43ppm of PO4 as a worst-case value, verifying erratic value, and this turns boiler parameter indicator red. A popup request shows as user clicked on the indicator bar to enters best-case value of 32ppm, which turns the indicator of the PO4parametergreen, validating the boiler operating in healthy condition. The PO4systemdesign specification is between 29-32ppm.
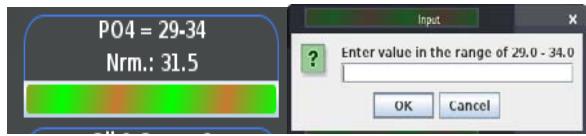 Figure 11: PO4 Simulation Result
## iii. Dynamic Simulations for Worst-case and Best-case values for Boiler Drum Water quality on SiO2
The parameter design range of Silica max (SiO2) value is 0.0-4.0 ppm. The boiler water quality must remain within its setpoint for the boiler to function efficiently as per design specifications. The results of the simulation with a worst-case of 6ppm, shows erratic display, verifying that SiO2is high, showing red on the indicator bar. Its requires a user to right value, 2ppm of SiO2, was entered, which turns parameter indicator bar green, validating the steam boiler running normally.
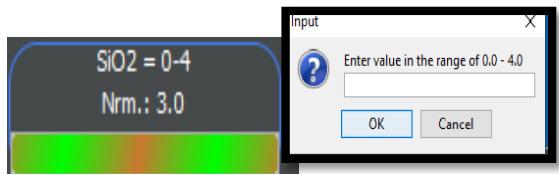 Figure 12: Silica Max Simulation Result
### b) Dynamic Simulation for Operational Feed Water Quality Parameters
A dynamic simulation with test value worst-case and best-cases on feed water quality for iron (Fe) ppm, pH value at 25DegC and total dissolved solid (TDS) ppm were carried out and parameters displayed on the panel as evaluated and verified by fourteen (14) fertilizer boiler domain practitioners.
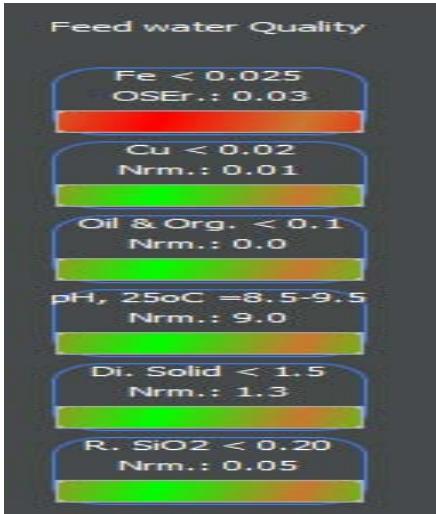 Figure 13: Feed Water Quality Display Panel
## i. Dynamic Simulation for Worst-Case and Best-Case Test Values on Iron Fe (Ppm)
The iron (Fe) as a default parameter with range of 0.0- 0.025ppm was simulated, and the feed water erratically displays worst-case of 2ppm a higher value of Fe, this turns the indicator paramter red. The erratic value was remove as a user clicking and system requesting right value to be entered. the user enterd a test value best-case of 0.010 Fe (ppm), which is within the parameter setpoint range, and the paramter bar turns green, validating that the boiler device enable and working efficiently.
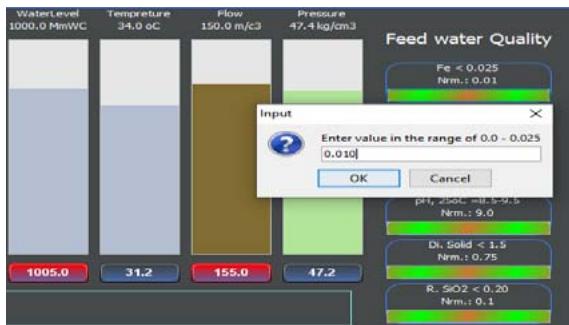 Figure 14: Fe (iron) Simulation Result
## ii. Dynamic Simulation for Worst-case and Best-case values on pH value at 25DegC
The dynamic simulation results of the feed water quality for pH value at 25 DegC displaying pH value parameters of test value worst-case of 8.2-9.5 is shown below. The boiler system displaying a test value worst-case pH value of 8.2, less than the designed setpoint, turns indicator panel red, a user then clicked on the indicator bar and entered the right value range of pH value of say 8.9 to validate the system. The best-case value simulation which is a pH value of 8.9 @25DegC, turns indicator green, meaning value entered is within the boiler system designed specification.
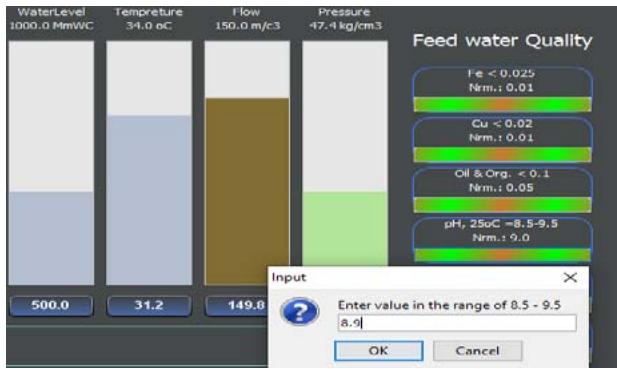 Figure 15: Ph Value at 25degc Simulation Result
iii. Dynamic Simulation for Worst-Case and Best-Case Values for Feed Water Quality on (TDS) In Ppm
Finally, a dynamic simulation for total dissolved solid (TDS) parameter was carried out with worst-case value of 1.80ppm and best-case value of 1.20ppm TDS. The feed water TDS panel indicator bar turns red at 1.80ppm which is erratic. A user is requested to entered correct value of the feed water quality at 1.20ppm which turns the TDS bar indicator green, this keeps boiler device in healthy operation.
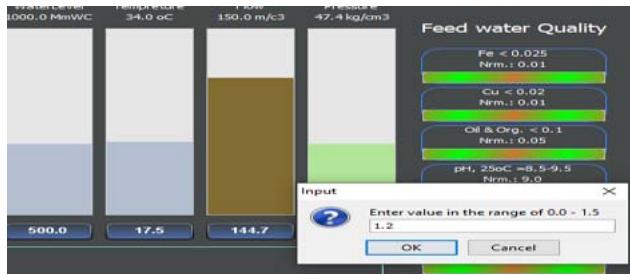 Figure16: TDS Simulation Result
c) Analysis for Mean, Mean Absolute Deviation and Standard Deviation System Errors
The researcher computes the mean, mean absolute deviation (MAD) and the standard deviation errors (SDE) of both manual and auto running with different time intervals to evaluate and verify which mode of the boiler system was preferable and the number of errors generated. The action research method deployed with quantitative observation of ten (10) consecutives run times of the boiler system on Table8, comprising system error time (minutes), system running in manual and auto run. Each time corresponds with the number of errors generated.
Table 9: Proposed System Running on Manual and Auto Errors with Time (Minutes)
<table><tr><td>System Error Time (Minutes)</td><td>System Running on Manual</td><td>System Running on Auto</td></tr><tr><td>1</td><td>3</td><td>1</td></tr><tr><td>2</td><td>6</td><td>2</td></tr><tr><td>3</td><td>6</td><td>2</td></tr><tr><td>4</td><td>6</td><td>1</td></tr><tr><td>5</td><td>6</td><td>1</td></tr><tr><td>6</td><td>8</td><td>2</td></tr><tr><td>7</td><td>9</td><td>1</td></tr><tr><td>8</td><td>11</td><td>1</td></tr><tr><td>9</td><td>11</td><td>2</td></tr><tr><td>10</td><td>12</td><td>2</td></tr></table>
Table 10: Proposed Run System for Mean and Mean Deviation Error on Auto Run
<table><tr><td>Auto Run True System Error (x)</td><td>Mean Deviation Error on Auto Run | x - μ |</td></tr><tr><td>1</td><td>0.5</td></tr><tr><td>2</td><td>0.5</td></tr><tr><td>2</td><td>0.5</td></tr><tr><td>1</td><td>0.5</td></tr><tr><td>1</td><td>0.5</td></tr><tr><td>2</td><td>0.5</td></tr><tr><td>1</td><td>0.5</td></tr><tr><td>1</td><td>0.5</td></tr><tr><td>2</td><td>0.5</td></tr><tr><td>2</td><td>0.5</td></tr><tr><td>Mean (μ) E = Σx/n = 1.5</td><td>(MAD) Σ | x - μ | = 5</td></tr></table>
The mean $(\mu)$ error of the proposed system running on automatic mode is computed as follows:
$$
\begin{array}{l} \text{Mean} (\mu) \text{Error} \\= (\sum x) / n = (1 + 2 + 2 + 1 + 1 + 2 + 1 + 1 + 2 + 2) / 10 = 1.5\dots \tag{1} \\end{array}
$$
Therefore, the mean $(\mu)$ error of automatic system run mode is 1.5
The mean deviation error of the steam package boiler system running on auto mode is computed as follows:
The Mean Deviation Error $= (\sum |x - \mu |) / n$ (2) where $x$ is the true mean error, $\mu$ is the mean error and $n$ the sum of system errors in auto run of the proposed system.
The Mean Absolute Deviation
$$
(M A D) \operatorname{Error} = (\sum | x - \mu |) / n = 5 / 1 0 = 0.5
$$
In computing the standard deviation of the proposed system error on auto run, we must take the square root of the mean absolute deviation (MAD) squares it, divides by the total number of system errors (n) in auto run.
$$
\begin{array}{l} \text {S t a n d a r d D e v i a t i o n} = \sqrt {(\sum | x - \mu | ^ {\wedge} 2) / n), \dots \dots \dots \dots \dots \dots \dots \dots \dots \dots \dots \dots \dots \dots \dots} \tag {3} \\= \sqrt {(5 ^ {\wedge} 2 / 1 0)} = \sqrt {(2 5 / 1 0)} = 1. 5 8 1 1 3 8 8 3 \approx 1. 5 8 \\\end{array}
$$
From Table10 of the error analysis, the auto run, minimum error is 1 in 1 minute while the maximum error is 2 in 10 minutes. The errors in minute are deduced from the log save error view button on the console and viewing the save logs screen.
On auto run mode, Error needed correction = overshoot + errors, this is subtracted from the errors correction done by the system, i.e., Correction Done-Needed correction = System errors, for instance in 2-minute, the system error gives 2 error on auto run. The overshoot was 8, error was 4, error needed correction is 12, correction was 14. This is the same with 4 minutes etc.
On manual run mode, the minimum error is 3 in 1 minute while the maximum error is 12 in 10 minutes analyzed from the log save error clicking view button on the console. Error margins were not considered during the MOM, since system runs efficiently on auto, whereas maintenance is done more on manual run of the proposed system. Excel spreadsheet as industry software tool was used for the data analysis of the above system.
Table 11: Proposed Run System Mean and Mean Absolute Deviation Error on Manual Run
<table><tr><td>Manual True System Error (x)</td><td>Mean Deviation Error | x - μ |</td></tr><tr><td>3</td><td>4.8</td></tr><tr><td>6</td><td>1.8</td></tr><tr><td>6</td><td>1.8</td></tr><tr><td>6</td><td>1.8</td></tr><tr><td>6</td><td>1.8</td></tr><tr><td>8</td><td>0.2</td></tr><tr><td>9</td><td>1.2</td></tr><tr><td>11</td><td>3.2</td></tr><tr><td>11</td><td>3.2</td></tr><tr><td>12</td><td>4.2</td></tr><tr><td>Mean (μ) Error = Σx/n = 7.8</td><td>(MADE) Σ | x - μ | = 2.4</td></tr></table>
The mean deviation error of the proposed system running on manual mode is computed using the formula below:
The Mean Deviation Error $= (\sum |x - \mu |) / n$,..., where $x$ is the true mean error, $\mu$ is the mean error and $n$, the sum of system errors in manual run of the proposed system.
The mean $(\mu)$ of the errors for the proposed system running on manual mode is computed as follows:
$$
\begin{array}{l} \text{Mean} (\mu) \text{Error} \\= (\sum x) / n = (3 + 6 + 6 + 6 + 6 + 8 + 9 + 11 + 11 + 12) / 10 = 7.8 \\\end{array}
$$
Therefore, the mean $(\mu)$ error of the proposed system running on manual mode is 7.8
The mean deviation error of the proposed system running on manual mode is computed using the formula below:
The Mean Deviation Error $= (\sum |x - \mu |) / n$
where $x$ is the true mean error, $\mu$ is the mean error and $n$ the sum of system errors in auto run of the proposed system.
$$
\begin{array}{l} \text{TheMe and eviationError (MAD)} \\= (\sum | x - \mu |) / n = 2 4 / 1 0 = 2.4 \\\end{array}
$$
In computing the standard deviation of the proposed system error on auto run, we must take the square root of the mean absolute deviation error (MADE) squares it, divide by the total number of system errors (n) in auto run.
$$
\begin{array}{l} \text {S t a n d a r d D e v i a t i o n} = \sqrt {\left(\sum \left[ \left| x - \mu \right| \right] ^ {\wedge 2}\right) / n)} = \\\sqrt {(\texttt {[ 2 4 ]} \hat {} 2 / 1 0)} = \sqrt {(5 7 6 / 1 0)} = 5 7. 6 \\\end{array}
$$
Therefore, the SD of proposed system error is 57.6
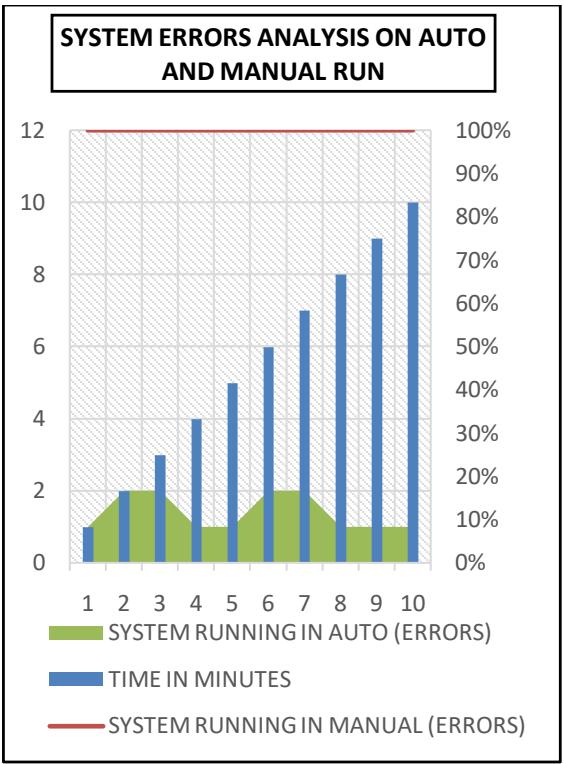 Figure 17: System Error Graphical Analysis on Manual and Auto Run
## VII. CONCLUSION
This paper is focused on expert system for control and maintaining steam package boiler parameters of the feed water and boiler drum recommended qualities using a hybrid technology of rule-base system and fuzzy logic. The dynamics simulation performs showed relatively high performance of consistency, correctness, and its precision of the system. The system can be modified, used as a platform by boiler trainers, especially for new intakes in all boilers operated allied industries.
The design system will prevent damaged and malfunctioning as control the alkalinity, prevent scaling, both mechanical & chemical corrosion, forming, correct pH values and then the conductivity which deals with the feed boiler water. Acceptable error margined were not considered during this research work.
Furthermore, we discovered in this paper that from 1 to 10 minutes run time for AUTO RUN form figure17 gives $2.8\%$ errors as compared to the 1 to 10 minutes time interval on MANUAL RUN that gives $80.2\%$ error. This speaks more for users less effort in user interface application usage on AUTO operations better than MANUAL operations, leading with a recommendation that AUTOMATION in industrial plant processes (fertilizer plant) for control and maintenance make it more consistence, correct and precise than MANUAL process of operations.
Generating HTML Viewer...
References
25 Cites in Article
K Amit (2012). An Efficient Approach Towards Accurate and Authentic Preservation of File Time Stamps.
Adetokunbo (2012). Software Engineering Methodologies: A Review of the Waterfall Model and Object-Oriented Approach.
(2006). Snow Rescue Task Force By Alex Marcoux & Art Seely Snow Operation Training Center A Division of Safety One, Inc..
Anne Håkansson (2013). Portal of Research Methods and Methodologies for Research Projects and Degree Projects.
A Adefemi,Adekunle,P Peter,Ikubanni2,O Olayinka,Agboola (2018). An Expert System for Automobile Repairs and Maintenance.
S Anabik,S Ashok (2012). Fuzzy Logic Approach for Boiler temperature and water level.
N Asabere,S Kusi-Sarpong (2012). A Mobile Vehicle Expert System for the Automobile Industry.
E Bretz (1990). 4829426 Computer-implemented expert system and method for decision-making.
S Celin,Anne Joe,G Rajalakshmi,Mary Thaj,T Delsy,Jamuna Rani,D (2016). Embedded Fuzzy Based Boiler Control.
I Cucu,D Codruţa,D Imola (2009). Using Expert Systems in The Management of Industrial Equipment Maintenance.
M Castanho,F Hernandes,A De Ré,S Rautenberg,A Billis (2013). Fuzzy expert system for predicting pathological stage of prostate cancer.
Emmanuel Ogu,Y Adekunle (2013). Basic Concepts of Expert System Shells and an Efficient Model for Knowledge Acquisition.
Edgar Amaya,Simeón,Ricardo Gudwin (2010). An Expert System for Fault Diagnostics in Condition Based Maintenance.
K Tripathi (2011). A Review on Knowledgebased Expert System: Concept and Architecture.
K Jabbarh,Z &r,Khan (2015). Survey on development of expert system in the areas of Medical, Education, Automobile and Agriculture.
K Krishan (2016). Fuzzy Logic Execution in Boiler Control.
Konstantin Aronson,Boris Murmansky,Ilia Murmanskii,Yuri Brodov (2020). An expert system for diagnostics and estimation of steam turbine components’ condition.
K Haider,Z Rafiqul (2016). Proceedings of the 7th International Conference on Computing for Sustainable Global Development (INDIACom) [Copyright notice].
P Mrudula (2013). Expert System-A Review Article.
H Seán,B Ken,O Dominic (2014). Application of computer alarm system in the industrial security equipment system.
S Simin,M Fatemeh,A Fatemeh,T Marjan,A Afsaneh (2013). Investigate the Effect of Expert Systems Application on Management Performance.
T Chee (2016). ARPN Journal of Engineering and Applied Sciences.
Yosra Jarraya,Souhir Bouaziz,Adel Alimi,Ajith Abraham (2013). Fuzzy modeling system based on hybrid evolutionary approach.
K Krishan (2016). AIRCRAFT PITCH CONTROL SYSTEM USING LQR AND FUZZY LOGIC CONTROLLER.
A Michael (2016). Model Predictive Fuzzy Control of a Steam Boiler, Master's degree in Automàtic and Robotics.
No ethics committee approval was required for this article type.
Data Availability
Not applicable for this article.
How to Cite This Article
Boye, Aziboledia Frederick. 2026. \u201cSteam Package Boiler Expert System for Control and Maintenance of Fertilizer Plants using Rule-Base Fuzzy Logic\u201d. Global Journal of Computer Science and Technology - C: Software & Data Engineering GJCST-C Volume 22 (GJCST Volume 22 Issue C2).
Explore published articles in an immersive Augmented Reality environment. Our platform converts research papers into interactive 3D books, allowing readers to view and interact with content using AR and VR compatible devices.
Your published article is automatically converted into a realistic 3D book. Flip through pages and read research papers in a more engaging and interactive format.
Our website is actively being updated, and changes may occur frequently. Please clear your browser cache if needed. For feedback or error reporting, please email [email protected]
Thank you for connecting with us. We will respond to you shortly.