Recently, Linux has undergone a significant progress and since it provides many helpful features to companies and home users, it has become one of the most commonly used operating systems in IT industry. Considering the popularity of available Linux distributions, three Linux desktop distributions were selected for further evaluation. The idea of this paper is to evaluate performance and compare three different Linux distributions and their influence on processor, memory, graphics system and disk drive performance. Measurements were performed with a three different benchmarking tools specialized for a specific computer component. All Linux operating system distributions were installed on the same desktop computer and based on the achieved performance measurement results it was concluded that the best results were achieved by using Pop OS 20.04. Linux distribution, which is very surprising because it is a relatively new distribution on the market.
## I. INTRODUCTION
Nowadays, it is difficult to imagine everyday life without the use of computers. Every computer needs an operating system (OS) to work. An operating system is a set of basic system programs that manage computer hardware to perform basic computer functions, that is, it enables a connection between hardware and user programs. One of the most used systems today that contributed to the computer revolution is the Linux operating system named after its original author Linus Torvalds. Analyzing market data for April 2020, Linux ranks third according to [1]. Among many available distributions, three Linux based distribution were selected for further evaluation. Linux Mint 19.4. Tricia and Ubuntu 20.04. LTS were a logical choices because of their significant popularity and reliability. The third selected distribution was Pop! OS, which in 2020 represents an excellent choice judging by the appearance and performance, according to [2] and [3]. Research of this paper focuses on evaluating desktop computer performance with different Linux distributions as host operating system.
The idea behind this paper is to study in detail, describe and compare the architecture, and evaluate performance results of three selected Linux based distribution while putting emphasis on performance of specific components such as processor (CPU), memory (RAM), graphics (GPU) and disk drive, in this case, solid state disk drive (SSD). Next, it is necessary to explain and describe the used benchmark tools.
In the experimental part, it is necessary to install each version of Linux, perform performance measurements and compare the performance of Linux operating systems on a high Performance desktop computer. Benchmark tools have to be installed on a computer for each operating system separately and tests have to be repeated with each benchmark tool five times.
To ensure consistency and accuracy, at least two benchmark tools must be used. Based on the obtained results, it is necessary to draw conclusions about the performance of Linux operating systems, in particularly, performance of each main computer component such as CPU, RAM, GPU and SSD.
The paper is organized in several sections. In section 2 related work was presented. In section 3 some basic information about selected Linux distributions were given. Section 4 describes benchmark tools for testing and evaluating computer performance. Section 5 explains the way in which the asurities were carried out and it gives the basic performance measurement methodology. Also, it explains impact of computer hardware components on the performance results. In section 6 obtained results were presented and discussed. At the end, section 7 gives some concluding remarks.
## II. RELATED WORK
Performance often plays a very important role in the field of software evaluation, especially when it is necessary to guarantee the quality, reliability and performance of an operating system [4]. However, it is a complex and time consuming task because it requires controlled environment and same conditions must be applied for all tested systems, so it remains a bit challenging task, especially in a field of operating systems.
In our previous work, several different aspects of an operating systems performance were studied on personal computers. In [5] a comprehensive performance evaluation based on CPU scheduling, disk drive management, graphic subsystem management, memory management and networking performance of the three different versions of Windows operating system, namely Windows XP, Windows Vista and Windows 7, was performed. Also, measurements were conducted in two different environments. Performance measurement results showed better performance of Windows XP in the majority of tests on the low-end computer system when compared to Windows Vista and Windows 7. Furthermore, on the high-end computer system, newer operating systems showed improved performance in the area of graphics subsystem and memory management. Also, a performance evaluation model for Windows operating systems was developed and the similar will be used in this paper with some modifications to accommodate Linux based operating systems. In [6], three popular virtual private server hosts based on Linux Debian operating system were evaluated. In [7], authors evaluated networking performance of three version of Windows operating systems, namely Windows XP, Windows Vista and Windows. Research in the field of networking performance was continued and expanded in [8] where three latest Windows operating systems, namely Windows 7, Windows 8.1 and Windows 10, were evaluated. Experimental results showed that Windows 10 introduced some improvements in network management, delays were lowered, however, CPU usage was increased.
When considering performance of an operating system, one of the less addressed topics is performance of a virtual machine. There are only a few studies of that topic available in the literature. In [9], performance of some typical virtualization techniques while under denial of service (DoS) attack was presented. It was shown that even a light DoS attack suffers from a performance degradation on virtualized servers in comparison to same services on nonvirtualized servers. In [10], performance evaluation of virtualized Windows XP operating system focused on read performance was conducted. Results show that several factors, such as cache configurations, access modes and request sizes can affect throughput. In [11], Windows XP, Windows Vista and Windows 7 operating systems were used as host operating systems while Windows Vista was used as a virtual machine. Performance measurement of a virtual machine was conducted with five different benchmark applications and also by performing data compression and video encoding which are very resources demanding operations. Based on the performance evaluation results it was concluded that using Windows 7 as a host operating system provides the best performance for a virtual operating system. In [11], performance of three different virtual machines was studied. Linux Ubuntu was used as a host while Windows 7, Windows 8.1 and Windows 10 were used as a virtual machine. Evaluation was done with three different measurement tools and results showed that Windows 7 has the best performance when used as a virtual operating system on Ubuntu host.
When discussing Linux operating systems, in [13], authors analyzed real-time performance of Linux kernel between 2.4 and 2.6. They concluded that performance of 2.6 kernel showed better performance. In [14], goal was to measure interactive task response on Linux as well as Windows operating systems. Conclusion was that Linux CPU scheduler has lower latencies than Windows 10 in most cases. In [15], authors presented novel open-source performance analysis tool that gives detailed information about system and application performance. In [4] a novel performance test method for Linux process scheduling was proposed. CFS scheduler was compared with O (1) scheduler and showed better performance both in scheduling efficiency and interactivity. Evaluation of the performance of IPv4 and IPv6 on Windows and Linux operating systems was done in [16]. The performance was examined on TCP and UDP protocols measuring throughput, jitter, delay and CPU utilization. Results showed better performance on Linux based operating system.
## III. HOST OPERATING SYSTEMS
Linux was created on October 5, 1991 and the first official version of Linux was 0.02 [17]. In the early days, Linux served as an experimental system used by students, hackers, programmers and generally people very closely working with computers. Linux is still a quite rare occurrence on home and office computers but it is constantly growing, especially in IT sector due to the fact that it is known as a secure and stable operating system. The fact that is open-source is also a big advantage for a small, developing companies. Percentage of Linux based operating systems among all used operating systems is still very low, at $1.63\%$, for servers is about $74.16\%$ and on mobile phones as the Android operating system about $75.16\%$ [18].
In this paper three popular Linux distributions were selected, namely Ubuntu 20.04 LTS, Linux Mint 19.3 and Pop!\_OS 20.4, and their performance will be evaluated.
### a) Ubuntu 20.04 LTS
Ubuntu [19] originated as a derivative of the Debian system. It uses Linux as the kernel of the operating system. For personal computers, it contains a graphical user interface (GUI). Ubuntu pays the most attention to ease installation and use. Currently, Ubuntu is the world's most popular opensource desktop operating system.
### b) Linux Mint 19.3 Tricia
Linux Mint [20] is an operating system based on the Ubuntu distribution, which in turn is based on Debian. Linux Mint started in 2006 with a beta version called 1.0 "Ada". In 2020, it is one of the most popular
Linux distributions. The latest release is Linux Mint 19.3. Tricia that originated in December 2019, also known as Cinnamon. Linux Mint is similar in terms of the graphical interface to the Windows 10 operating system. It primarily uses free, open-source software.
### c) Pop! OS 20.04
Pop!\_OS [21] is one of the new Ubuntu-based distributions by system76 hardware vendors. The basic edition of Pop!\_OS contains the graphical user interface GNOME 3.36. There are two different installations, one AMD drivers and the other includes NVidia drivers which makes it the only Linux distribution currently on the market to offer installed graphics card drivers. Pop!\_OS encrypts the installation partition by default for better security and privacy. It comes with firmware that allows you to seamlessly upgrade to a newer version of the software. It also comes with a lot of preinstalled development tools, security features and performance profiles. That makes it very popular and community around it is growing fast.
## IV. PERFORMANCE MEASUREMENT TOOLS - BENCHMARKS
Tools that are specifically developed for evaluating performance of a specific subsystem or a complete computer system are called benchmark applications. Linux is a very complex operating system and therefore it is necessary to use more than one performance measurement tool to get the accurate and relevant data about each computer sub system. There are benchmark tools that integrate the results of all computer components, but they are not suitable for accurate testing. The aim of this paper is to obtain precise, credible and accurate results. For this reason, three benchmark tools were used to evaluate each computer component, namely Hardinfo, Geekbench and Phoronix Test Suite. Within each benchmark tool, there are various tests for each computer subsystem. All the results are expressed in numerical value and unit of measurement. Hardinfo and Geekbench were used to evaluate the CPU and Phoronix Test Suite to evaluate RAM, SSD and GPU.
### a) Hardinfo v0.6
Hardinfo (Hardware Information) [22] is a system profile and benchmark tool for Linux based operating systems. It is available in most Linux distributions. It can collect computer and operating system data, run a variety of reference values, and export data to HTML. Hardinfo can evaluate following subsystems: CPU, HDD/SSD, memory cards and USB drives. In this paper, only CPU tests were used as they provide detailed information about CPU performance.
### b) Geekbench v5.1.1
Geekbench [23] is a benchmark tool used to evaluate various operating systems. One of the things that sets it apart from other benchmark tools is the fact that it is available on Windows, all Linux distributions, macOS, Android and iOS. In this paper, Geekbench was used to evaluate the CPU. Geekbench uses some advanced application areas for evaluation a performance such as augmented reality and machine learning. On Linux, there is no graphical user interface (GUI), results can only be obtained via terminal or official web page. GeekBench performs single-threaded and multi-threaded tests, making it a great tool for CPU performance evaluation.
### c) Phoronix Test Suite v9.6
Phoronix Test Suite [23] was developed in June 2004 by Michael Larabel, who currently works as the owner and editorin-chief. It is free and open-source software. This benchmark tool is one of the most comprehensive tools that can be found on the market, and it is very simple to use. It can be used to test the entire computer system. Running the tests is very simple and the whole process takes only a few minutes after which the results are displayed in an Internet browser. The results are very detailed and can be compared with the results of other users. Linux named it the best platform for evaluating operating system performance. It supports more than 220 test profiles and over 60 test groups. The Phoronix Test Suite can evaluate RAM, SSD and GPU performance.
## V. EXPERIMENTAL SETUP
### a) Performance Measurement Setup
Performance measurement was performed on a high performance desktop computer with a Linux based operating system. Linux distributions used in this paper are namely, Ubuntu 20.04 LTS, Linux Mint 19.3 Tricia and Pop OS 20.04, as they are currently some of the most widely used Linux distributions. All used operating systems were 64-bit. Each operating system was installed with default settings, afterwards, it was updated to include the latest features. Updating operating system is one of the most important steps since updates include various enhancements that improve security, performance and general stability of an operating system. Next important step is to install the latest device drivers since they are constantly upgrading to remove known errors and to improve general performance. While some additional configuration of an operating system can further enhance performance, that aspect was not considered in scope of this paper. Computer hardware and considered operating systems used in this paper are shown in Table 1.
Table 1: Hardware and Considered Operating Systems
<table><tr><td colspan="2">Hardware components</td></tr><tr><td>RAM</td><td>Crucial 2 x 4 GB DDR3 1600 MHz</td></tr><tr><td>CPU</td><td>Intel® CoreTM i5-9400F, 2.9 GHz, 6 cores</td></tr><tr><td>GPU</td><td>NVidia GeForce GTX 1660 Ti 6GB</td></tr><tr><td>SSD</td><td>SanDisk 512GB SATA</td></tr><tr><td>MBO</td><td>Acer Predator PO3-600</td></tr><tr><td colspan="2">Host operating system</td></tr><tr><td colspan="2">Ubuntu 20.04 LTS v5.4.0-28</td></tr><tr><td colspan="2">Inux Mint 19.3 Tricia v5.3.0-46</td></tr><tr><td colspan="2">Pop!_OS 20.04 v5.4.0-7625</td></tr></table>
### b) Performance Measurement Methodology
It is necessary to create a performance measurement methodology to ensure reliability, repeatability, consistency and accuracy of the conducted experiments and obtained results. Process shown in Fig. 1. represents defined performance measurement methodology used in this paper. The first three steps must be repeated for each host operating system. Upon completing those steps, next five steps must be repeated for each used benchmark application. During experiments only benchmark application should be installed, all other application should be uninstalled, user activity is not allowed and other user files should be deleted since they are likely to degrade performance of an operating system. All measurements have to be repeated five times in a row. The final result is calculated as the arithmetic mean of those five repetitions, as shown in (1), rounded on two decimal places.
$$
\bar{x} = \frac{1}{N} \sum_{i=1}^{N} x_{i} \rightarrow N = 5 \tag{1}
$$
$$
x_{imin} \leq \bar{x} \leq x_{imax}
$$
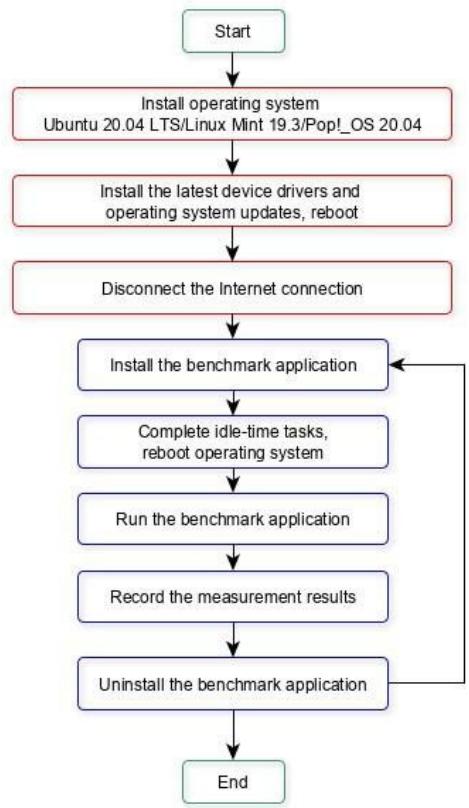 Fig. 1: Performance Measurement Process
Performance results between different operating systems was compared by using Ubuntu results as referent values while percentage difference was calculated for two other tested operating systems with respect to Ubuntu values, as shown in (2).
$$
D if f _ {\%} = \frac{\text{Mint\_or\_Pop\_val} - \text{Ubuntu\_val}}{\text{Ubuntu\_value}} x 100 \% \tag{2}
$$
The overall performance of the computer and an operating system was evaluated through three main metrics:
- Speed - Represents number of achieved units in period of time, i.e. throughput (Mb/s), more is better,
- Time - Represents required time to perform a certain task, less is better,
- Points - Number of points achieved during a certain task, more is better.
### c) Hardware Impact on Performance Measurement Results
Computer systems are very complex and composed of many different interconnected components. All those software and hardware components must work efficiently in order to deliver the best possible performance. With constant advancement in technology, complexity of an operating system is rising and each new version includes a large number of new features and capabilities when compared to the previous ones. It is expected that all those enhancements will deliver some improvement in performance. This is also expected when considering hardware development. Hardware has also a huge impact on computer performance and must be carefully taken into consideration when choosing components for a specific task. Main hardware components that can cause lower performance are mentioned below:
- CPU - The heart of the computer and one of the most important components. It receives and processes data, executes instructions and communicates with input/output units. Insufficient processing power can cause delays in performing tasks if CPU cannot keep up with amount of data that need to be processed,
- GPU - A subsystem that is designed to rapidly manipulate memory to speed up the process of creation images in a frame buffer intended for output to a display device. Similar to CPU, insufficient processing power can cause delays and performance degradation,
- SSD - Is primarily used as storage area. Host operating system as well as used benchmark applications are installed on it. It is important for disk drive to have sufficient throughput to ensure uninterrupted data flow,
- RAM - Random access memory is a form of primary computer memory whose contents can be accessed directly. It contains currently running
applications or services run by the user or the operating system. The performance of entire system can degrade significant if current task requires more memory than it is available.
## VI. RESULTS AND ANALYSIS
In this paper, performance of three Linux based operating systems was evaluated in their default configurations. Three selected operating systems were Ubuntu 20.04 LTS, Linux Mint 19.3 and Pop OS 20.04. Performance measurement was conducted using three different benchmarking tools while the main emphasis was put on CPU, GPU, RAM and SSD performance. When comparing the same performance measurement results, it can be concluded which operating system performs the best in some general tasks. In Tables II-V all performance measurement results are shown.
When comparing CPU test results shown in Table II, it can be seen that both Linux Mint and Pop OS achieved a lot better results than Ubuntu, up to $52\%$. Only test where Ubuntu showed better result than both other operating systems was calculating Fibonacci order. That result can be disregarded since difference was less than $1\%$. When comparing Linux Mint to Pop OS it can be seen that in single-threaded tasks they show similar performance while in multithreaded tasks Pop \_OS showed up to $13\%$ better performance. When comparing results of each benchmarking tools, it can be also seen that Hard info tool slightly favors Linux Mint while when observing Geek bench results it can be seen that Pop OS achieved better results.
In Table III are presented results of GPU performance evaluation. All tested operating systems showed similar performance. Slight advantage went to Pop OS which showed up to $3.22\%$ better results than Ubuntu and up to $7\%$ better than Linux Mint. Interesting is the fact that one test, VGT-
Triangle, showed the best performance for Linux Mint, $24.31\%$ better than both Ubuntu and Pop!\_OS while all other test were in favor of other two tested operating systems.
When comparing RAM test result, which can be seen in Table IV, again, all operating systems show similar performance, but again, Pop!\_OS showed the best performance, up to $1.32\%$ better than Ubuntu and $3.32\%$ better than Linux Mint. Interestingly, one test result, VPT-TriadInteger, showed a lot worse performance for Linux Mint, $20.24\%$ less than Ubuntu which is a way worse than in average.
By evaluating performance of SSD, a lot more diverse results were obtained, as shown in Table V. For example, in sequential disk write test Ubuntu achieved $12.53\%$ better result than Pop!\_OS and $29.95\%$ better result than Linux Mint. On the other hand, Linux Mint achieved the best result in VPTUnpacking test where it achieved $4.2\%$ better result than Pop!\_OS and $4.9\%$ better than Ubuntu. Pop!\_OS achieved the best result in test VPT-1000files-NoSync, where it was $12.57\%$ better than Ubuntu and $11.1\%$ better than Linux Mint. RAM test showed that all operating systems have some advantages which ensured them the best results in certain tests. In average, it can be concluded that the best SSD results achieved Ubuntu.
## VII. CONCLUSION
When considering operating systems, it is obvious that their main purpose is to enable an efficient usage of all resources. In recent time Linux has undergone a significant progress and since it provides many helpful features to companies and home users, it has become one of the most commonly used operating systems in IT industry. Due to the fact that it is gaining popularity rapidly but it is still relatively unknown to most other non-Linux user, the idea of this paper is to take some of the most popular Linux distributions and evaluate their performance in everyday tasks. Three Linux based operating systems were evaluated, namely Ubuntu 20.04 LTS, Linux Mint 19.3 and Pop!\_OS 20.04. Evaluation was done by using three benchmark applications, Hardinfo, Geekbench and Phoronix Test Suite. During the evaluation process, emphasis was put on CPU, GPU, RAM and SSD performance.
Performance measurement results showed that relatively new Linux distribution, Pop!\_OS, has the best performance while the most widely used distribution, Ubuntu, came second. Ubuntu showed the best results in SSD tests while Pop!\_OS showed better results for all other tested components. Linux Mint came last but not far behind Ubuntu. For future work it would be very interesting to compare performance of Linux distributions with most commonly used versions of Windows operating systems since Windows is still most widely used operating system.
Table II: CPU Test Results
<table><tr><td>Performed test</td><td>Ubuntu</td><td>Linux Mint</td><td>Pop!_OS</td><td>Unit</td><td>Diff LM to Ubuntu</td><td>Diff PopOS to Ubuntu</td></tr><tr><td>CPU-Blowfish</td><td>1.17</td><td>1.19</td><td>1.14</td><td>sec</td><td>-1.30%</td><td>2.34%</td></tr><tr><td>CPU-CryptoHash</td><td>9067.57</td><td>9109.80</td><td>10385.28</td><td>Mb/sec</td><td>0.40%</td><td>4.50%</td></tr><tr><td>CPU-Fibonacci</td><td>0.43</td><td>0.43</td><td>0.43</td><td>sec sec</td><td>-0.46%</td><td>-0.93%</td></tr><tr><td>CPU-N-Queens</td><td>7.01</td><td>6.68</td><td>6.88</td><td>HIMarks</td><td>4.70%</td><td>1.85%</td></tr><tr><td>CPU-Zlib</td><td>1.65</td><td>1.78</td><td>1.68</td><td>Sec</td><td>7.76%</td><td>1.56%</td></tr><tr><td>FPU-FTT Single-thread</td><td></td><td></td><td></td><td>score</td><td></td><td>2.60%</td></tr><tr><td rowspan="2">NPT-CPU-single-thread VPT-Encryption</td><td>1091.60</td><td>1104.20</td><td>1102.00</td><td>score</td><td>1.15%</td><td>0.95%</td></tr><tr><td>113.60</td><td>114.60</td><td>113.60</td><td>score</td><td>0.88%</td><td>0.88%</td></tr><tr><td>VPT-IntegerMath-</td><td>1088.00</td><td>1097.40</td><td>1096.00</td><td>score</td><td>0.86%</td><td>0.73%</td></tr><tr><td>VPT-FloatingPointMath VPT-</td><td>1261.80</td><td>1284.40</td><td>1279.80</td><td>MB/sec</td><td>1.79%</td><td>1.42%</td></tr><tr><td>TextCompression</td><td>990.80</td><td>1036.00</td><td>1032.60</td><td>Mpixels/sec</td><td>4.56%</td><td>4.21%</td></tr><tr><td rowspan="2">VPT-ImageCompression VPT-MachineLearning</td><td>1140.00</td><td>1150.00</td><td>1147.60</td><td>Images/sec</td><td>0.87%</td><td>0.66%</td></tr><tr><td>1107.00</td><td>1196.20</td><td>1198.00</td><td></td><td>7.45%</td><td>7.60%</td></tr><tr><td>Multi-thread</td><td></td><td></td><td></td><td></td><td></td><td></td></tr><tr><td>NPT-CPU-total VPT-Encryption</td><td>3921.00</td><td>4935.80</td><td>5292.60</td><td>score</td><td>25.88%</td><td>34.98%</td></tr><tr><td>VPT-IntegerMath</td><td>508.60</td><td>588.20</td><td>654.20</td><td>score</td><td>15.65%</td><td>28.63%</td></tr><tr><td>VPT-FloatingPointMath VPT-</td><td>3929.60</td><td>4986.00</td><td>5332.40</td><td>score</td><td>26.88%</td><td>35.70%</td></tr><tr><td>TextCompression</td><td>4471.00</td><td>5576.00</td><td>5980.00</td><td>score</td><td>24.71%</td><td>33.75%</td></tr><tr><td rowspan="3">VPT-ImageCompression VPT-MachineLearning</td><td>3066.20</td><td>4428.80</td><td>4661.40</td><td>MB/sec</td><td>44.44%</td><td>52.03%</td></tr><tr><td>5481.80</td><td>5767.20</td><td>6471.60</td><td>Mpixels/sec</td><td>5.21%</td><td>18.06%</td></tr><tr><td>2707.80</td><td>2690.40</td><td>2721.00</td><td>Images/sec</td><td>-0.64%</td><td>0.49%</td></tr></table>
Table III: GPU Test Results
<table><tr><td>Performed test</td><td>Ubuntu</td><td>Linux Mint</td><td>Pop!_OS</td><td>Unit</td><td>Diff LM to Ubuntu</td><td>Diff PopOS to Ubuntu</td></tr><tr><td>NUH-FPS-D3D9</td><td>110.79</td><td>111.32</td><td>114.35</td><td>FPS</td><td>0.48%</td><td>3.22%</td></tr><tr><td>NUH-FPS-D3D11</td><td>111.12</td><td>110.91</td><td>114.59</td><td>FPS</td><td>-0.19%</td><td>3.13%</td></tr><tr><td>NUH-FPS-OpenGL</td><td>111.69</td><td>110.85</td><td>114.95</td><td>FPS</td><td>-0.75%</td><td>2.92%</td></tr><tr><td rowspan="2">NUT-FPS</td><td>284.33</td><td>282.68</td><td>293.24</td><td>FPS</td><td>-0.58%</td><td>3.13%</td></tr><tr><td>354.11</td><td>351.92</td><td>360.20</td><td>FPS</td><td>-0.62%</td><td>1.72%</td></tr><tr><td>NUS-FPS</td><td>7915.80</td><td>7451.00</td><td>8008.60</td><td>score score</td><td>-5.87%</td><td>1.17%</td></tr><tr><td>VGT-GiMark</td><td>86958.80</td><td>87078.00 7268.00</td><td>86886.60</td><td>score score</td><td>0.14%</td><td>-0.08%</td></tr><tr><td rowspan="2">VGT-Plot3D</td><td>6981.80</td><td>19963.60</td><td>6976.40</td><td>score score</td><td>4.10%</td><td>-0.07%</td></tr><tr><td>21044.60</td><td>157746.00</td><td>21068.40</td><td>score</td><td>-5.14%</td><td>0.11%</td></tr></table>
Table V: SSD Test Results
<table><tr><td>Performed test</td><td>Ubuntu</td><td>Linux Mint</td><td>Pop!_OS</td><td>Unit</td><td>Diff LM to Ubuntu</td><td>Diff PopOS to Ubuntu</td></tr><tr><td rowspan="2">VGT-Plot3D</td><td>6981.80</td><td>19963.60</td><td>6976.40</td><td>score score</td><td>4.10%</td><td>-0.07%</td></tr><tr><td>21044.60</td><td>157746.00</td><td>21068.40</td><td>score</td><td>-5.14%</td><td>0.11%</td></tr><tr><td>VGT-FurMark</td><td>126924.40</td><td>2831.00</td><td>126842.20</td><td></td><td>24.28% -</td><td>-0.07%</td></tr><tr><td>VGT-TessMark</td><td>2896.20</td><td>5498.00</td><td>2893.80</td><td></td><td>2.25%</td><td>-0.08%</td></tr><tr><td>VGT-Triangle</td><td>5681.00</td><td></td><td>5702.60</td><td></td><td>-3.22%</td><td>0.38%</td></tr><tr><td colspan="7">VGT-PixmarkPiano</td></tr><tr><td colspan="7">VGT-Volplosion</td></tr><tr><td>VPT-Add-Integer</td><td>23212.53</td><td>22478.37</td><td>23182.48</td><td>MB/sec</td><td>-3.16%</td><td>-0.13%</td></tr><tr><td>VPT-Copy-Integer</td><td>20374.75</td><td>20393.41</td><td>20346.04</td><td>MB/sec</td><td>0.09%</td><td>-0.14%</td></tr><tr><td rowspan="2">VPT-Scale-Integer</td><td>20215.29</td><td>20244.68</td><td>20281.90</td><td>MB/sec</td><td>0.15%</td><td>0.33%</td></tr><tr><td>22964.19</td><td>18314.06</td><td>23034.80</td><td>MB/sec</td><td>-20.24%</td><td>0.31%</td></tr><tr><td>VPT-Triad-Integer VPT-Add-Float</td><td>23004.66</td><td>22495.91</td><td>23058.83</td><td>MB/sec</td><td>-2.21%</td><td>0.24%</td></tr><tr><td>VPT-Copy-Float</td><td>20281.12</td><td>20414.57</td><td>20326.60</td><td>MB/sec</td><td>0.65%</td><td>0.22%</td></tr><tr><td rowspan="2">VPT-Scale-Float VPT-Triad-Float</td><td>20320.05</td><td>20393.99</td><td>20369.09</td><td>MB/sec</td><td>0.36%</td><td>0.24%</td></tr><tr><td>23024.25</td><td>22500.23</td><td>23099.86</td><td>MB/sec</td><td>-2.28%</td><td>0.33%</td></tr><tr><td>VPT-MBW-128MB</td><td>13461.25</td><td>13616.97 8672.61</td><td>13483.04</td><td>MiB/sec</td><td>1.16%</td><td>0.16%</td></tr><tr><td rowspan="2">VPT-MBW-Fx128MB VPT-Latency</td><td>8498.87</td><td>15026.10</td><td>8611.88</td><td>MiB/sec</td><td>2.04%</td><td>1.33%</td></tr><tr><td>15177.63</td><td></td><td>14973.98</td><td>MB/sec</td><td>-0.99%</td><td>-1.34%</td></tr></table>
Table IV: Ram Test Results
<table><tr><td>Performed test</td><td>Ubuntu</td><td>Linux Mint</td><td>Pop!_OS</td><td>Unit</td><td>Diff LM to Ubuntu</td><td>Diff PopOS to Ubuntu</td></tr><tr><td>VPT-DiskSeqRead</td><td>556857.80</td><td>566100.66</td><td>572420.20</td><td>score score</td><td>1.66%</td><td>2.79%</td></tr><tr><td rowspan="2">VPT-DiskSeqWrite</td><td>35843.60</td><td>25108.66</td><td>31352.00</td><td>MB/sec</td><td>-29.95%</td><td>-12.53%</td></tr><tr><td>18100.65</td><td>12682.67</td><td>17947.04</td><td>MB/sec sec</td><td>-26.93%</td><td>-0.85%</td></tr><tr><td>VPT-CacheRead</td><td>192.18 5.94</td><td>180.56</td><td>191.98 5.90</td><td>files/sec</td><td>-6.04%</td><td>-0.10%</td></tr><tr><td rowspan="2">VPT-BufferedDiskRead VPT-UnpackingLK</td><td>283.84</td><td>5.65</td><td>270.66</td><td>files/sec</td><td>4.90%</td><td>0.69%</td></tr><tr><td>367.92</td><td>282.04</td><td>370.40</td><td>files/sec</td><td>-0.63%</td><td>-4.63%</td></tr><tr><td>VPT-1000files,1Mbsize</td><td>205.68</td><td>363.57</td><td>192.62</td><td>files/sec</td><td>-1.18%</td><td>0.67%</td></tr><tr><td rowspan="2">VPT-5000files,1Mbsize,4Threads</td><td>2454.82</td><td>170.40</td><td>2516.88</td><td>MB/sec</td><td>-17.15%</td><td>-6.35%</td></tr><tr><td>10545.32</td><td>2234.82</td><td>11870.39</td><td>MB/sec</td><td>-8.96%</td><td>2.53%</td></tr><tr><td>VPT-4000files,32SubDirs</td><td>4791.72</td><td>10708.96</td><td>5126.36</td><td>MB/sec</td><td>1.55%</td><td>12.57%</td></tr><tr><td>VPT-1000files,1MBSize,No Sync/Fsync</td><td>816.99</td><td>4815.24</td><td>748.38</td><td></td><td>0.49%</td><td>6.98%</td></tr><tr><td>VPTRead-RS:1MB,FS:8GB</td><td>728.93</td><td>718.11</td><td>749.67</td><td></td><td>-12.10%</td><td>-8.40%</td></tr><tr><td>VPTRead-RS:4KB,FS:8GB</td><td></td><td>675.33</td><td></td><td></td><td>-7.35%</td><td>2.85%</td></tr><tr><td>VPTWriteRS:1MB,FS:8GB</td><td></td><td></td><td></td><td></td><td></td><td></td></tr><tr><td>VPTWrite-RS:4KB,FS:8GB</td><td></td><td></td><td></td><td></td><td></td><td></td></tr></table>
Generating HTML Viewer...
References
24 Cites in Article
(.09%). .test Linux Mint Pop!-DiskSeqRead vPT-DiskSeqWrite vPT-CacheRead vPT-BufferedDiskRead vPT-UnpackingLK vPT-1000files,1Mbsize vPT-5000files,1Mbsize,4Threads vPT-4000files,32SubDirs vPT-1000files,1MBSize.
No ethics committee approval was required for this article type.
Data Availability
Not applicable for this article.
How to Cite This Article
Praval Pratap Singh. 2026. \u201cPerformance Evaluation of Linux Operating Systems\u201d. Global Journal of Computer Science and Technology - H: Information & Technology GJCST-H Volume 23 (GJCST Volume 23 Issue H2).
Explore published articles in an immersive Augmented Reality environment. Our platform converts research papers into interactive 3D books, allowing readers to view and interact with content using AR and VR compatible devices.
Your published article is automatically converted into a realistic 3D book. Flip through pages and read research papers in a more engaging and interactive format.
Our website is actively being updated, and changes may occur frequently. Please clear your browser cache if needed. For feedback or error reporting, please email [email protected]
Thank you for connecting with us. We will respond to you shortly.