Determination of the Influence of Factors on the Properties of Aerated Concrete Obtained on the Basis of Floating Ash Cenospheres and Analysis of the Results of the Experimental Study by the Method of Mathematical Modeling
Annotation- The article discusses the results of a study by the method of mathematical modeling and the influence of various factors on the properties of aerated concrete obtained on the basis of floating ash cenospheres. The use of the cenosphere of floating ash from thermal power plants for the production of aerated concrete and other materials is very important for solving many issues, including saving natural resources, reducing the cost of thermal energy, reducing the cost of building materials and environmental pollution from ash waste, etc. These studies pay great attention to devoted to the analysis and confirmation of the results of the experiment based on the methods of mathematical modeling. In the same mathematical way, conclusions were drawn on the correspondence between the results of preliminary and recent tests.
## I. INTRODUCTION AND RESEARCH METHOD
The cenosphere is an aluminosilicate microsphere composed of aluminosilicate cenospheres or fly ash cenospheres (FAC). It is emitted together with fly ash during the combustion of pulverized coal particles. Volatile and floating are synonymous with the lightest part of the ash, and floating ash is a special light particle that floats and accumulates on the surface of the ash storage water. Cenospheres, which belong to the group of fly ash microspheres, are currently widely used as fillers for artificial materials and other products [1-3]. Large volumes of fly ash are discharged into the natural lakes of the ash storage facilities of the Ekibastuz GRES-1 and GRES-2 in the Pavlodar region of Kazakhstan, most of which accumulates along the coast of the lakes. Therefore, they are called floating ash.
The main objective of the study is to use the cenosphere of fly ash from Ekibastuz GRES-1 and GRES-2 of Kazakhstan as part of aerated concrete, and it is planned to test the effect of the cenosphere of ash components in the concrete mix and other factors on the properties of aerated concrete. Tests and confirmation for compliance with the results of the preliminary and main tests were carried out by the method of mathematical modeling.
Currently, the use of fundamental and applied scientific methods to determine the optimal research regime is increasing. The survey data will be processed mathematically and statistically to determine the average values of the numerical indicators of the studies, change their values in a certain space to obtain a mathematical model of the study, and then analyze the model to obtain the most effective study option using optimization methods. Mathematical modeling is the representation of the number of research experiments, factors and their relationship to each other in the form of tables, graphs and equations.
Mathematical modeling research refers to the relationship between the characteristics of influencing factors, production technology and product characteristics. The mathematical notation of the general form of the mathematical model is as follows:
$$
Y = A \{X \}
$$
Here: Y- is the output parameter of the study. It represents the main characteristics of the product, which are variously called objective functions or optimization parameters. A-input parameter is an operator that defines the mathematical operation of the transition to the output factor, i.e. the mathematical model. X- is the input factor. It is often called arguments. To obtain a mathematical model of research work, when a combination of theoretical and experimental methods is achieved, in this case the best results are achieved. Here, the theoretical method is used to analyze the structural properties of the object of study and the product to obtain a general form of the equation (model), however, to determine the numerical values of the coefficients of the calculated part or equation and verify the theoretical conclusions, the experimental method should be used. If the result of the study of indicators is a random number, but in which the input parameter has a fixed value, and not random, then the mathematical model is called a regression model.
The experiment planning matrix is a numerical table showing the change in the values of factors in various sequences of experiments. Planning in which all factors change simultaneously is called experimental multi-factor planning. If the resulting equation for representing the object of study in the form of a mathematical model is non-linear, a second-order mathematical model is constructed [4,6,7].
## II. THE PURPOSE OF THE STUDY AND THE MAIN PART
The purpose of the study is to experimentally determine and establish the influence of constituent components and other factors on the physical and mechanical properties of aerated concrete. The correspondence between the results of the preliminary and main experiments is confirmed by mathematical modeling. For mathematical planning of the experiment, the compressive strength and average density of aerated concrete were taken as the main parameters (output parameters), the amount of ash- $X_1$, the amount of lime- $X_2$ and the water temperature- $X_3$ were chosen as influencing factors. On this basis, the planning matrix (table 1.) and the test matrix (table 2.) were compiled. The total number of experiments in the three-factor matrix is $N = 20$. Here, the number of repeated experiments at the main point $(n0 = 8)$, the number of experiments at the hot point $(ng = 6)$, the number of tests at the remote point $(ny = 6)$ and the values of the remote point of the lines $(a = (-) (+) 1.682)$. The purpose of the study and the main part. When planning an experiment of mathematical modeling, changes in the amount of ash, lime and water temperature are based on the results of previous experiments on the influence of factors on the properties of aerated concrete with a floating ash mixture at Ekibastuz GRES. In the composition of aerated concrete, Portland cement was chosen as the main binder, sand was used as an aggregate, and aluminum powder was used as a blowing agent. For testing, standard samples of cubes $10 \times 10 \times 10$ cm in size were made, which were removed from the mold after being kept in a heat-moist treatment chamber at a temperature of $80^{\circ}\mathrm{C}$ for 14 hours. Based on the test, data on compressive strength and bulk density after hardening were obtained. within 28 days under normal conditions.
Table 1: Experiment planning matrix (initial data)
<table><tr><td rowspan="2">Influencing factors (code)</td><td rowspan="2">Unit
measu
rements</td><td colspan="5">Level of influencing factors</td><td rowspan="2">Intermediate
value, Ji</td></tr><tr><td>-X remote -1,682</td><td>Xi lower (-1)</td><td>Xi0 (0)</td><td>Xi upper (+1)</td><td>+X remote 1,682</td></tr><tr><td>Number of ash cenospheres.,(X1)</td><td>%</td><td>14,7</td><td>25</td><td>40</td><td>55</td><td>65,2</td><td>15</td></tr><tr><td>Amount of lime, (X2)</td><td>%</td><td>1,6</td><td>5</td><td>10</td><td>15</td><td>18,4</td><td>5</td></tr><tr><td>Water temperature, (X3)</td><td>°C</td><td>53,2</td><td>60</td><td>70</td><td>80</td><td>96,8</td><td>10</td></tr></table>
Table 2: Trial Matrix and Results
<table><tr><td rowspan="2">n</td><td rowspan="2">N</td><td colspan="3">Coded factor values</td><td colspan="3">Actual values of factors</td><td colspan="4">Outgoing indicators (MPa), test repetition</td><td rowspan="2">σN2(Y)</td><td rowspan="2">YR(MHa)</td><td rowspan="2">Yρ(V)(Kr/M3)</td></tr><tr><td>x1</td><td>x2</td><td>x3</td><td>x1</td><td>x2</td><td>x3</td><td>Y1</td><td>Y2</td><td>Y3</td><td>Y̅</td></tr><tr><td rowspan="8">nh</td><td>1</td><td>+</td><td>+</td><td>+</td><td>55</td><td>15</td><td>80</td><td>1,40</td><td>1,33</td><td>1,28</td><td>1,34</td><td>0.0073</td><td>1,73</td><td>790</td></tr><tr><td>2</td><td>+</td><td>+</td><td>-</td><td>55</td><td>15</td><td>60</td><td>1,28</td><td>1,31</td><td>1,36</td><td>1,31</td><td>0,0017</td><td>1,73</td><td>810</td></tr><tr><td>3</td><td>+</td><td>-</td><td>+</td><td>55</td><td>5</td><td>80</td><td>1,79</td><td>1,72</td><td>1,81</td><td>1,77</td><td>0,0021</td><td>2,08</td><td>880</td></tr><tr><td>4</td><td>+</td><td>-</td><td>-</td><td>55</td><td>5</td><td>60</td><td>1,66</td><td>1,60</td><td>1,83</td><td>1,70</td><td>0,0142</td><td>2,08</td><td>861</td></tr><tr><td>5</td><td>-</td><td>+</td><td>+</td><td>25</td><td>15</td><td>80</td><td>2,65</td><td>2,59</td><td>2,67</td><td>2,63</td><td>0,0016</td><td>2,61</td><td>844</td></tr><tr><td>6</td><td>-</td><td>+</td><td>-</td><td>25</td><td>15</td><td>60</td><td>2,58</td><td>2,54</td><td>2,65</td><td>2,59</td><td>0,0031</td><td>2,61</td><td>835</td></tr><tr><td>7</td><td>-</td><td>-</td><td>+</td><td>25</td><td>5</td><td>80</td><td>2,80</td><td>2,83</td><td>2,87</td><td>2,83</td><td>0,0012</td><td>2,72</td><td>877</td></tr><tr><td>8</td><td>-</td><td>-</td><td>-</td><td>25</td><td>5</td><td>60</td><td>2,78</td><td>2,82</td><td>2,84</td><td>2,81</td><td>0,009</td><td>2,72</td><td>872</td></tr><tr><td rowspan="3">nr</td><td>9</td><td>-1,682</td><td>0</td><td>0</td><td>14,7</td><td>10</td><td>70</td><td>2,92</td><td>2,97</td><td>2,90</td><td>2,93</td><td>0,0013</td><td>3,17</td><td>932</td></tr><tr><td>10</td><td>+1,682</td><td>0</td><td>0</td><td>65,2</td><td>10</td><td>70</td><td>2,68</td><td>2,60</td><td>2,61</td><td>2,63</td><td>0.0019</td><td>1,90</td><td>783</td></tr><tr><td>11</td><td>0</td><td>-</td><td>0</td><td>40</td><td>1,6</td><td>70</td><td>2,62</td><td>2,53</td><td>2,50</td><td>2,55</td><td>0,0039</td><td>2,39</td><td>840</td></tr><tr><td rowspan="4"></td><td></td><td></td><td>1,682</td><td></td><td></td><td></td><td></td><td></td><td></td><td></td><td></td><td></td><td></td><td></td></tr><tr><td>12</td><td>0</td><td>+1,682</td><td>0</td><td>40</td><td>18,4</td><td>70</td><td>2,40</td><td>2,37</td><td>2,36</td><td>2,34</td><td>0,0014</td><td>2,00</td><td>857</td></tr><tr><td>13</td><td>0</td><td>0</td><td>-1,682</td><td>40</td><td>10</td><td>53,2</td><td>2,30</td><td>2,31</td><td>2,31</td><td>2,31</td><td>0,0001</td><td>2,14</td><td>819</td></tr><tr><td>14</td><td>0</td><td>0</td><td>+1,682</td><td>40</td><td>10</td><td>96,8</td><td>2,45</td><td>2,54</td><td>2,44</td><td>2,47</td><td>0,0031</td><td>2,14</td><td>805</td></tr><tr><td rowspan="6">n0</td><td>15</td><td>0</td><td>0</td><td>0</td><td>40</td><td>10</td><td>70</td><td>2,40</td><td>2,49</td><td>2,40</td><td>2,43</td><td>0,0027</td><td>2,41</td><td>831</td></tr><tr><td>16</td><td>0</td><td>0</td><td>0</td><td>40</td><td>10</td><td>70</td><td>2,40</td><td>2,35</td><td>2,42</td><td>2,39</td><td>0,0013</td><td>2,41</td><td>826</td></tr><tr><td>17</td><td>0</td><td>0</td><td>0</td><td>40</td><td>10</td><td>70</td><td>2,37</td><td>2,39</td><td>2,41</td><td>2,39</td><td>0,0005</td><td>2,41</td><td>833</td></tr><tr><td>18</td><td>0</td><td>0</td><td>0</td><td>40</td><td>10</td><td>70</td><td>2,35</td><td>2,48</td><td>2,43</td><td>2,42</td><td>0,0043</td><td>2,41</td><td>834</td></tr><tr><td>19</td><td>0</td><td>0</td><td>0</td><td>40</td><td>10</td><td>70</td><td>2,36</td><td>2,40</td><td>2,35</td><td>2,37</td><td>0,0007</td><td>2,41</td><td>828</td></tr><tr><td>20</td><td>0</td><td>0</td><td>0</td><td>40</td><td>10</td><td>70</td><td>2,40</td><td>2,43</td><td>2,41</td><td>2,41</td><td>0,0002</td><td>2,41</td><td>833</td></tr><tr><td></td><td></td><td></td><td></td><td></td><td></td><td></td><td></td><td></td><td></td><td></td><td>46,62</td><td>0,0534</td><td></td><td>16791</td></tr></table>
Based on the results of three-factor matrix experiments, a mathematical regression model was developed for three second-order factors of type $2^{3}$, representing changes in the strength and average density of aerated concrete, and the results of the study were determined. Next, the values of the influencing factors were determined, the values were changed in a certain space to obtain a mathematical model of the technological operation by experimental planning, and the output parameters of the model were optimized by the objective function formulas and by the graphical composition central planning method [5].
## III. EXPERIMENT RESULTS
Based on the results of the experiments, the three-factor matrix of the multifactor mathematical regression model representing the change in the strength of aerated concrete is written as follows
$$
\begin{array}{l} Y _ {R} = 2, 4 1 - 0, 3 8 x _ {1} - 0, 1 1 6 6 x _ {2} + 0, 0 3 1 x _ {3} - 0, 0 5 x _ {1} x _ {2} + 0, 0 4 5 x _ {1} ^ {2} - \\- 0, 0 7 3 4 x _ {2} ^ {2} - 0, 0 9 3 x _ {3} ^ {2} \\\end{array}
$$
As a result of the experiment, the three-factor mathematical regression model for expressing the change in the volumetric mass of concrete is written as follows
$$
Y_{\rho} = 830 - 24,71x_{1} - 13,28x_{2} - 8,87x_{1}x_{2} - 4,37x_{2}x_{3} + 11,28x_{1}^{2} + 8,06x_{2}^{2} - 4,87x_{3}^{2}
$$
When analyzing mathematical models, the following was revealed: the ash content $(x_{1})$ and water temperature $(x_{3})$ more effectively affect the strength parameters, and the ash content $(x_{1})$ and lime $(x_{2})$ effectively affect the bulk mass parameters. To optimize the values of mathematical models representing the results of the experiment, the analytical method of the multifactorial objective function and the graphical method of central composition planning were used.
## IV. CONCLUSION
When optimizing the analytical method of the multivariate objective function of the value of the output parameters of the three-factor mathematical regression model that expresses the properties of aerated concrete, the parameters found cover the indicated values in previous studies, with a minimum compressive strength of aerated concrete at a fixed point $\mathrm{YR} = 2.41$ and a maximum average density $\mathrm{Y\rho} = 916$.
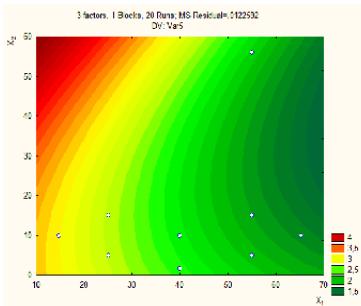
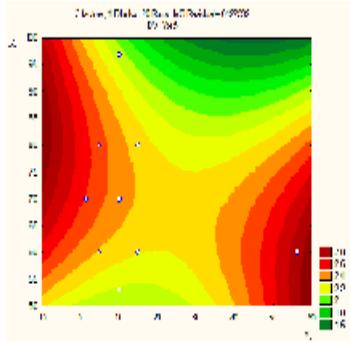
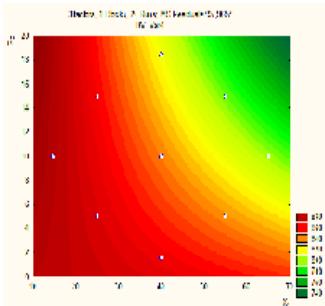
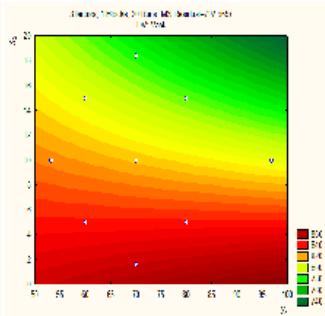
The graphical method for optimizing the values of mathematical models is based on central compositional planning. For optimizations by a graphical method, we obtain an equation based on experimental results to plot the relationship between compressive strength and bulk density of concrete. Therefore, the steady state reflection function is curved and relatively well expressed as a second order polynomial. Since 6 parallel experiments were performed at the zero level of testing, the results of which allow us to evaluate the model. On the test graph, the red lines show the central test points, the yellow lines show the main test points, and the green lines show the remote test points.
a) Characterizing the equations of the output parameters of the compressive strength and graphs of the surface of the reflection function depending on the value of the influencing factors
$$
Y _ {R} = 3. 0 5 7 + 0. 0 9 X _ {1} + 0. 3 3 X _ {2} + 0. 0 0 1 5 X _ {1} ^ {2} + 0. 0 0 0 4 X _ {2} ^ {2} - 0. 0 4 4 X _ {1} X _ {2}
$$
 $\mathrm{X}_{3} = 60$
 $X_{3} = 70$
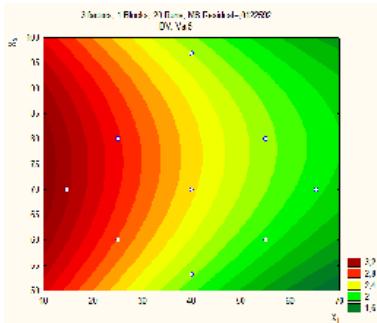 $X_{3} = 80$ Figure 1: Graphs of synonymous lines on the reflection surface of the function $Y_{R}$ depending on the values of the influencing factor $X_{3}$
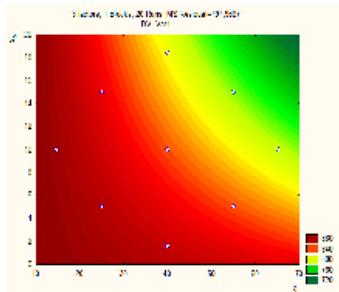
$$
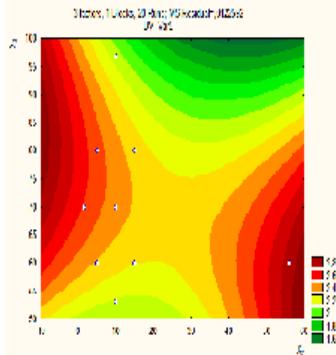
Y _ {R} = 0. 0 4 X _ {1} + 1 0. 0 9 X _ {2} + 0. 0 0 0 1 5 X _ {1} ^ {2} - 0. 0 0 6 X _ {2} ^ {2} + 0. 1 9
$$
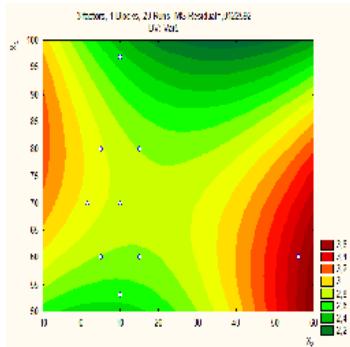 $\mathrm{X}_{2} = 5$
 $\mathrm{X}_{2} = 10$
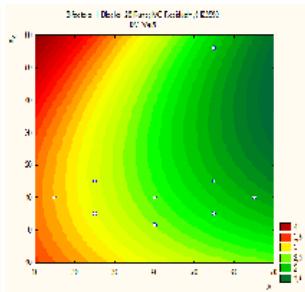
 $X_{2} = 15$ Figure 2: Graphs of synonymous lines on the reflection surface of the function $Y_{R}$ depending on the values of the influencing factor $X_{2}$
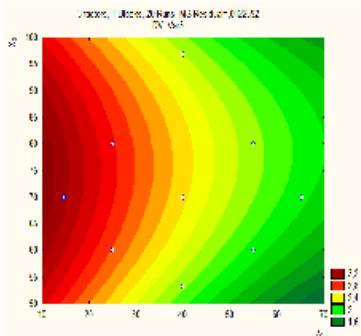
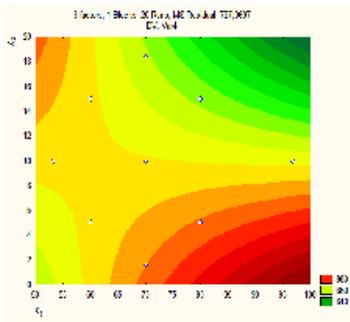
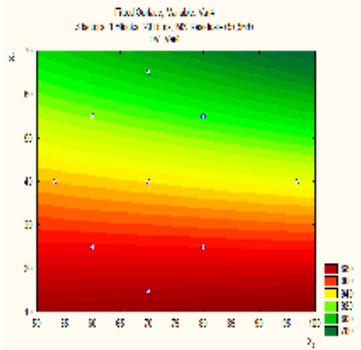
$$
Y _ {R} = 0. 0 3 X _ {1} + 0. 0 9 X _ {2} + 0. 0 0 0 4 X _ {1} ^ {2} - 0. 0 0 0 6 X _ {2} ^ {2} - 1. 6 8
$$
 $X_{1} = 25$
 $X_{1} = 40$
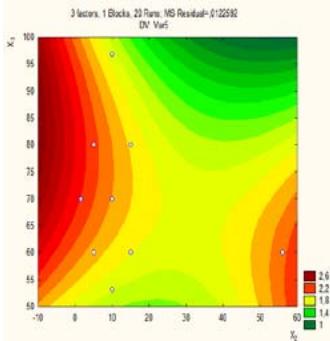 $X_{1} = 55$ Figure 3: Graphs of synonymous lines on the reflection surface of the function $Y_{R}$ depending on the values of the influencing factor $X_{1}$
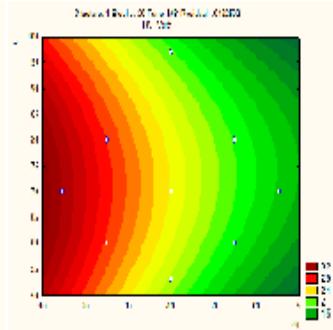
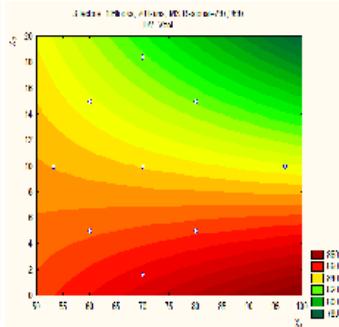
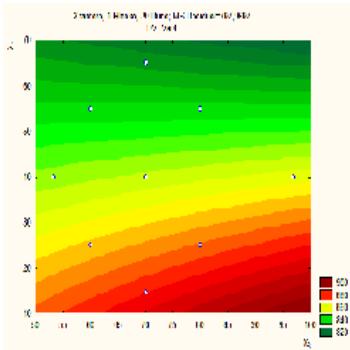
b) Characterizing equations for the output density parameter and graphs of the surface of the reflection function depending on the value of the influencing factors
$$
Y _ {p} = 0. 4 1 X _ {1} + 8. 1 8 X _ {2} + 8 7 1. 5
$$
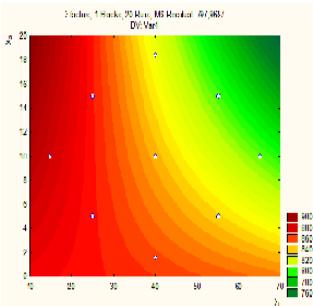 $\mathrm{X}_{3} = 60$
 $X_{3} = 70$
 $\mathrm{X}_{3} = 80$ Figure 4: Graphs of synonymous lines on the reflection surface of the function $Y_{P}$ depending on the values of the influencing factor $X_{3}$
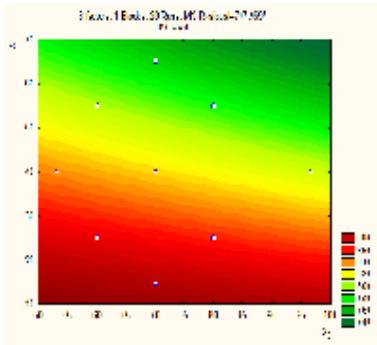
$$
Y _ {p} = 1. 1 2 X _ {1} + 8. 1 8 X _ {2} + 8 1 6. 7
$$
 X1=25
 $X_{1} = 40$
 $\mathrm{X}_{1} = 55$ Figure 5: Graphs of synonymous lines on the reflection surface of the function $Y_{\mathfrak{p}}$ depending on the values of the influencing factor $X_{1}$
$$
Y_{\rho} = 1.12X_{1} + 0.4X_{2} + 846.9
$$
 $\mathrm{X}_{2} = 5$
 $X_{2} = 10$
 $X_{2} = 15$ Figure 6: Graphs of synonymous lines on the reflection surface of the function $Y_{P}$ depending on the values of the influencing factor $X_{2}$
As a result of graphical optimization for the outgoing strength indicators, the values of the points of the dependence graphs are 2.50; 2.40; 2.40 at the level of influencing factors $X3 = 80$, $X1 = 40$, $X2 = 10$ are close or correspond to the values of the central and main points of the experiment 2.61; 2.41; 2.40. According to the outgoing density indicators, their values correspond to 800; 820; 800 at the level of
influencing factors $X3 = 80$, $X1 = 40$, $X2 = 10$, which are close or correspond to the values of the central and main points of the experiment 844; 819;
805.
The fly ash cenosphere used in the study was relatively coarse-grained, consisted of up to $90\%$ mullite crystals and a low content of calcium oxide and quartz, which weakened the reactivity and did not contribute to the achievement of high concrete strength.
Generating HTML Viewer...
References
7 Cites in Article
James Hannan (2015). Chemical Makeup of Fly and Bottom Ash Varies Significantly; Must Be Analyzed Before Recycled.
T Shaixlam,D Sunjidmaa,G Batdemberel (2019). A study of Ferrospheres in the Coal Fly Ash Open.
E Fomenko,N Anshits,N Vasil'eva,E Rogovenko,O Mikhailova,E Mazurova,L Soloviev,A Anshits (2016). The composition and structure of the shell of aluminosilicate microspheres of fly ash formed from the combustion of Ekibastuz coal.
Avdai Ch,D Enkhtuyaa (2015). Technique of performance (static processing, modeling, diagnostics) of research works.
No ethics committee approval was required for this article type.
Data Availability
Not applicable for this article.
How to Cite This Article
Shaikhslam Takibayuly. 2026. \u201cDetermination of the Influence of Factors on the Properties of Aerated Concrete Obtained on the Basis of Floating Ash Cenospheres and Analysis of the Results of the Experimental Study by the Method of Mathematical Modeling\u201d. Global Journal of Research in Engineering - A : Mechanical & Mechanics GJRE-A Volume 22 (GJRE Volume 22 Issue A2).
Explore published articles in an immersive Augmented Reality environment. Our platform converts research papers into interactive 3D books, allowing readers to view and interact with content using AR and VR compatible devices.
Your published article is automatically converted into a realistic 3D book. Flip through pages and read research papers in a more engaging and interactive format.
Our website is actively being updated, and changes may occur frequently. Please clear your browser cache if needed. For feedback or error reporting, please email [email protected]
Thank you for connecting with us. We will respond to you shortly.
Lorem ipsum dolor sit amet, consectetur adipiscing elit. Ut elit tellus, luctus nec ullamcorper mattis, pulvinar dapibus leo.
Determination of the Influence of Factors on the Properties of Aerated Concrete Obtained on the Basis of Floating Ash Cenospheres and Analysis of the Results of the Experimental Study by the Method of Mathematical Modeling