## I. INTRODUCTION
URA users' body composition results are used to provide information regarding the position of individual user's among the population: for example, if he/she has lower or higher body fat ratio or muscle mass than others. The comparison with other users is good for extra motivation since it creates a competitive element of training or/and diet.
1. Can I compare my body composition with AURA users' body composition results?
Brief answer: Yes, you can. In the AURA app we use data based on thousands of AURA Strap measurements conducted by a huge number of our users. All data were processed in order to exclude any incorrect data caused by various factors. As a result the final dataset provides a representation of an actual body composition of AURA users.
### 2. Is the comparison correct?
No doubt, it is really important to know if AURA users body composition data is reliable and how it relates with body composition of other populations of the US. There were many studies conducted in the US for evaluation of the health status of Americans, including body composition surveys. One of the largest of them is organized by the National Health and Nutrition Examination Survey (NHANES), a program of studies designed to assess the health and nutritional status of adults and children in the United States.
According to the number of participants which took part in the NHANES surveys and its long time duration (body composition servers were conducted for 8 years: from 1999 till 2006), it was chosen as a population sample to compare with AURA users. In the period of the DEXA data collecting, NHANES oversampled Mexican-Americans, African Americans, low-income White and Other Race people, adolescents aged 12-19, and non-Hispanic White and Other Race adults aged 70 and over than in other years of examinations (https://www.cdc.gov/visionhealth/vehss/data/national-surveys/national-health-and-nutrition-examination-survey.html) The most NHANES examination centers where DEXA data were collected were located in the south part of USA in general (see the map below):
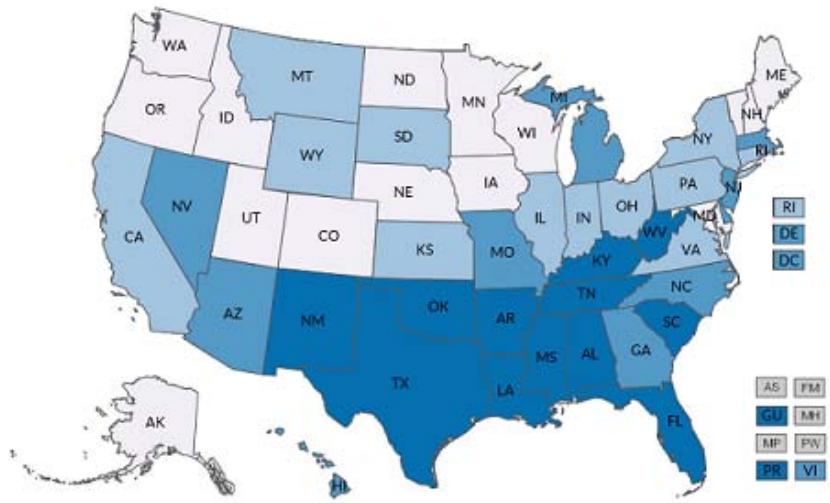 Fig. 1: The map of NHANES study
The analyzed sample consists of 27029 subjects ( $N_{\text{male}} = 14226$, $N_{\text{female}} = 12763$ ) of age 8-85 years and different ethnicity:
- Non-Hispanic White: 10870
- Mexican American: 7179
- Non-Hispanic Black: 6848
- Other Hispanic: 1077
- Other Race - Including Multi-Racial: 1055
NHANES body composition data are based on Dual energy X-ray absorptiometry (DEXA) which is regarded as the "gold standard" in body fat assessment. In contrast, AURA Strap users data were determined via bioelectrical impedance analysis (BIA). AURA Strap BIA is based on formulas designed by AURA Devices, Inc. and requires the following parameter: sex, age, body weight, height (anthropometric data) and upper-body impedance. The anthropometric data are self-provided by AURA users while upper-body impedance is measured with AURA Strap.
Since there are sex and aging differences in body composition, the both dataset were divided into 10 subsets: age 18-23, 24-30, 31-40, 41-50 and 51-65 of male and female, respectively. As main parameters to compare height, weight, and body fat ratio was used because the DEXA based NHANES dataset does not provide reliable information about muscle mass or total body water.
Before the start of any statistical analysis, let us look at sample distributions of selected age groups. As it can be seen on fig. 2, AURA Strap samples for both males and females are notably smaller than NHANES. This can present a challenge for many statistical tests, as they usually assume that samples have equal variances, and variances are directly affected by sample size. Considering this, we will employ the Welch's modification of popular Student's t-test, which does not have an equal variance assumption and thus can provide reliable results for two samples of unequal sizes.
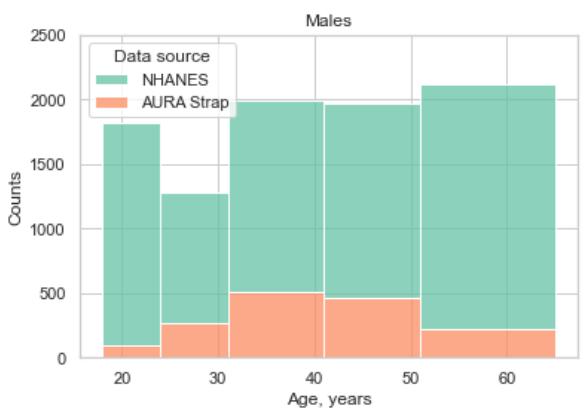
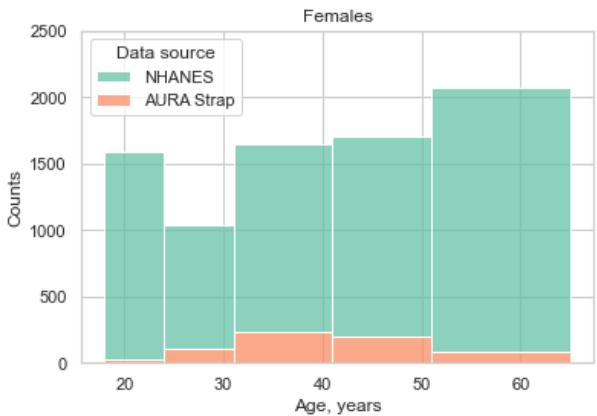 Fig. 2: Histogram of age distributions of NHANES and AURA Strap samples
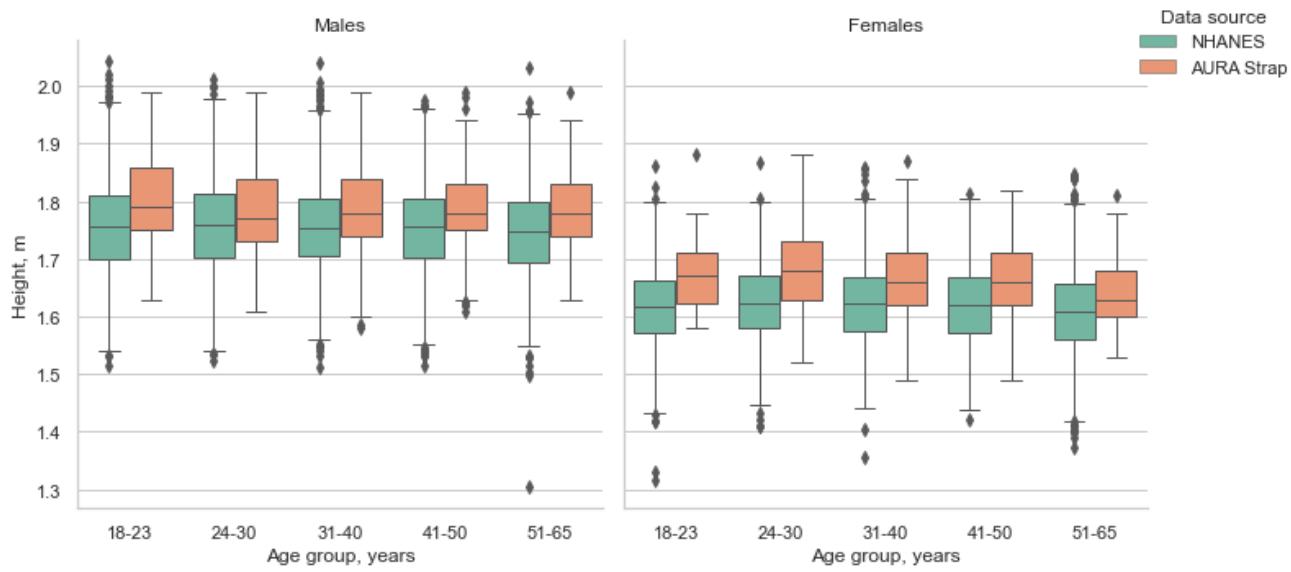 a) Comparing Heights Fig. 3: Comparison of height in different age groups of males and females of NHANES and AURA Strap populations
Table 1: Height mean and standard deviation in different age groups of males and females of NHANES and AURA Strap populations
<table><tr><td></td><td colspan="5">NHANES</td><td colspan="5">AURA Strap</td></tr><tr><td>Males</td><td>18-23</td><td>24-30</td><td>31-40</td><td>41-50</td><td>51-65</td><td>18-23</td><td>24-30</td><td>31-40</td><td>41-50</td><td>51-65</td></tr><tr><td>Mean</td><td>1.76</td><td>1.76</td><td>1.76</td><td>1.75</td><td>1.75</td><td>1.79</td><td>1.78</td><td>1.79</td><td>1.79</td><td>1.78</td></tr><tr><td>SD</td><td>0.08</td><td>0.08</td><td>0.08</td><td>0.08</td><td>0.08</td><td>0.08</td><td>0.07</td><td>0.08</td><td>0.08</td><td>0.07</td></tr><tr><td>Females</td><td>18-23</td><td>24-30</td><td>31-40</td><td>41-50</td><td>51-65</td><td>18-23</td><td>24-30</td><td>31-40</td><td>41-50</td><td>51-65</td></tr><tr><td>Mean</td><td>1.62</td><td>1.62</td><td>1.62</td><td>1.62</td><td>1.61</td><td>1.68</td><td>1.68</td><td>1.66</td><td>1.66</td><td>1.64</td></tr><tr><td>SD</td><td>0.07</td><td>0.07</td><td>0.07</td><td>0.07</td><td>0.07</td><td>0.07</td><td>0.07</td><td>0.07</td><td>0.07</td><td>0.06</td></tr></table>
While comparing samples heights, one can note, that heights of AURA Strap sample subjects are both higher and more variable between age groups, than NHANES (fig. 3, table 1). Welch t-test confirms, that AURA Strap users, both males and females, are significantly taller than NHANES study subjects $(p < 0.001$ in all cases, $\alpha = 0.05)$. This can be a result of US population generally becoming taller with time (see Fogel RW, Grotte N. Major Findings from The Changing Body: Health, Nutrition, and Human Development in the Western World since 1700. J Econ Asymmetries.
2011\. 8(2):1-9), as the AURA Strap data was collected at 2020 - 2022, while the majority of NHANES measurements were taken a few decades ago.
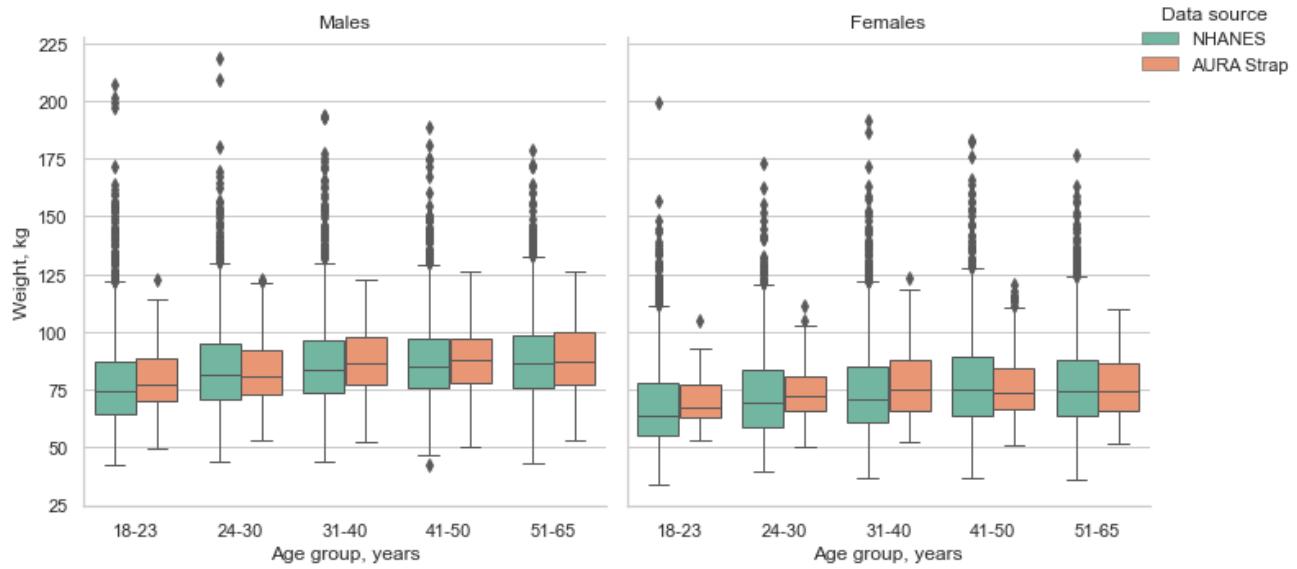 b) Comparing Weights Fig. 4: Comparison of weight in different age groups of males and females of NHANES and AURA Strap populations
Table 2: Weight mean and standard deviation in different age groups of males and females of NHANES and AURA Strap populations
<table><tr><td></td><td colspan="5">NHANES</td><td colspan="5">AURA Strap</td></tr><tr><td>Males</td><td>18-23</td><td>24-30</td><td>31-40</td><td>41-50</td><td>51-65</td><td>18-23</td><td>24-30</td><td>31-40</td><td>41-50</td><td>51-65</td></tr><tr><td>Mean</td><td>78.64</td><td>85.08</td><td>87.26</td><td>87.83</td><td>88.53</td><td>79.87</td><td>82.01</td><td>87.07</td><td>87.73</td><td>88.36</td></tr><tr><td>SD</td><td>20.45</td><td>20.77</td><td>20.01</td><td>18.34</td><td>18.66</td><td>13.60</td><td>13.22</td><td>14.55</td><td>14.25</td><td>15.33</td></tr><tr><td>Females</td><td>18-23</td><td>24-30</td><td>31-40</td><td>41-50</td><td>51-65</td><td>18-23</td><td>24-30</td><td>31-40</td><td>41-50</td><td>51-65</td></tr><tr><td>Mean</td><td>68.78</td><td>73.24</td><td>75.58</td><td>78.62</td><td>77.66</td><td>71.42</td><td>74.06</td><td>77.44</td><td>76.84</td><td>76.68</td></tr><tr><td>SD</td><td>19.12</td><td>20.00</td><td>20.69</td><td>20.50</td><td>19.38</td><td>12.51</td><td>13.00</td><td>14.97</td><td>15.06</td><td>14.06</td></tr></table>
As it can be seen on Fig. 4 and in table 2, NHANES weight data have a long-tailed distribution with a considerable amount of outliers for both genders in all age groups. These outliers, however, have no specific effect on Welch test results, which in most cases reveals no significant difference between NHANES and AURA
Strap samples. The only exception are males of 24-30 years, who are slightly heavier in NHANES data $(p = 0.003, \alpha = 0.05)$.
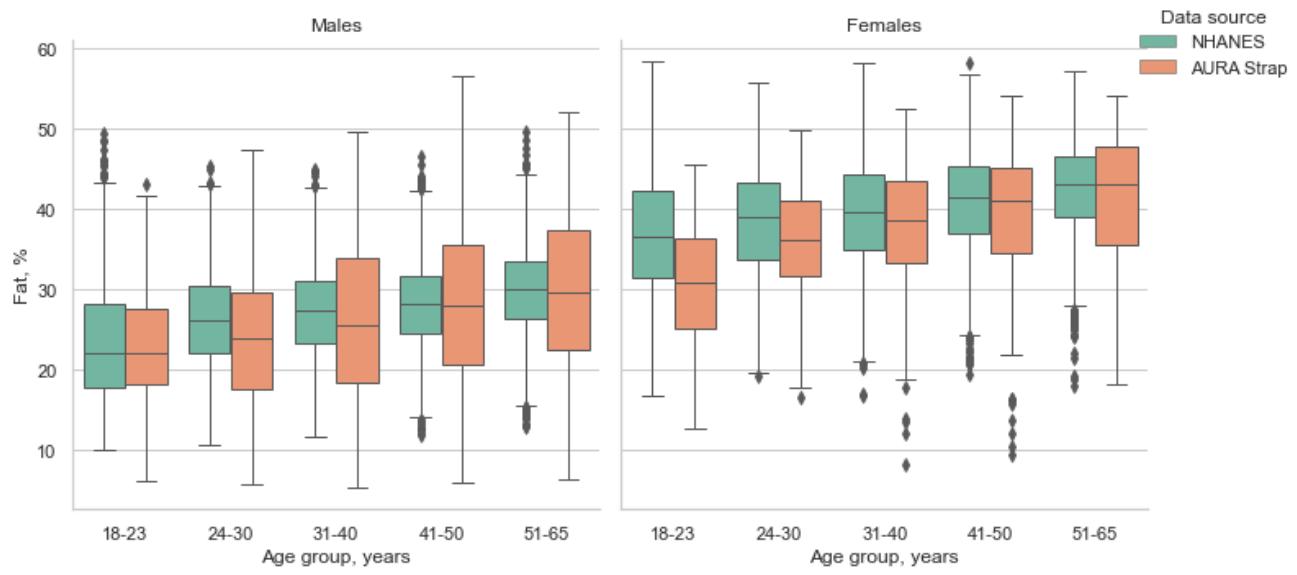
### c) Comparing Body Fat Ratio
 Fig. 5: Comparison of fat ratio in different age groups of males and females of NHANES and AURA Strap populations
Table 3: Fat ratio mean and standard deviation in different age groups of males and females of NHANES and AURA Strap populations
<table><tr><td></td><td colspan="5">NHANES</td><td colspan="5">AURA Strap</td></tr><tr><td>Males</td><td>18-23</td><td>24-30</td><td>31-40</td><td>41-50</td><td>51-65</td><td>18-23</td><td>24-30</td><td>31-40</td><td>41-50</td><td>51-65</td></tr><tr><td>Mean</td><td>23.54</td><td>26.33</td><td>27.20</td><td>28.07</td><td>29.79</td><td>22.45</td><td>23.99</td><td>25.99</td><td>28.11</td><td>29.57</td></tr><tr><td>SD</td><td>7.35</td><td>6.41</td><td>5.98</td><td>5.68</td><td>5.70</td><td>7.54</td><td>8.91</td><td>10.00</td><td>10.35</td><td>10.46</td></tr><tr><td>Females</td><td>18-23</td><td>24-30</td><td>31-40</td><td>41-50</td><td>51-65</td><td>18-23</td><td>24-30</td><td>31-40</td><td>41-50</td><td>51-65</td></tr><tr><td>Mean</td><td>36.89</td><td>38.35</td><td>39.43</td><td>40.88</td><td>42.53</td><td>30.66</td><td>35.51</td><td>37.73</td><td>38.87</td><td>41.58</td></tr><tr><td>SD</td><td>7.26</td><td>6.98</td><td>6.79</td><td>6.48</td><td>5.86</td><td>8.94</td><td>7.32</td><td>8.24</td><td>8.87</td><td>8.82</td></tr></table>
For body fat ratio, the samples are not statistically different in following cases: males of 18-23 years, males of 41-50 years, both males and females of 51-65 years. In all other cases, one can assume that AURA Strap users and NHANES subjects significantly differs in body fat ratio (males: $p < 0.001$ for 24-30 years group, $p = 0.01$ for 31-40 years; females: $p = 0.002$ for 18-23 years, $p = 0.003$ for 24-30 years, $p = 0.003$ for 31-40 years, and $p = 0.002$ for 41-50 years; $\alpha = 0.05$ in all cases). Summarizing that, AURA Strap users are either have the same or lesser body fat ratio than NHANES subjects. It can also be noted, that the variability of AURA Strap data is rather high – and it is most probably the effect of different measurement technique: AURA Strap uses BIA for body fat estimation, which is much more sensitive for various environmental and internal conditions than DEXA.
## II. CONCLUSION
Our comparison study demonstrates that AURA strap users body composition is indeed have many similarities with NHANES study participants. The observed differences originated in either data collecting methodology, lifestyle differences, or even population change with time.
Generating HTML Viewer...
References
1 Cites in Article
F Andersen (1999). Final Report on the Safety Assessment of Ceteareth-2, -3, -4, -5, -6, -7, -8, -9, -10, -11, -12, -13, -14, -15, -16, -17, -18,-20,-22,-23,-24,-25,-27, -28, -29, -30, -33, -34, -40, -50, -55, -60, -80, and -100.
No ethics committee approval was required for this article type.
Data Availability
Not applicable for this article.
How to Cite This Article
Dr. Aleksandr Polokhin. 2026. \u201cBody Composition Differences between US Population and AURA Strap Users: A Comparison with NHANES Dataset\u201d. Global Journal of Research in Engineering - G: Industrial Engineering GJRE-G Volume 22 (GJRE Volume 22 Issue G2).
Explore published articles in an immersive Augmented Reality environment. Our platform converts research papers into interactive 3D books, allowing readers to view and interact with content using AR and VR compatible devices.
Your published article is automatically converted into a realistic 3D book. Flip through pages and read research papers in a more engaging and interactive format.
Our website is actively being updated, and changes may occur frequently. Please clear your browser cache if needed. For feedback or error reporting, please email [email protected]
Thank you for connecting with us. We will respond to you shortly.