This study investigated the environmental factors that influence the reliability of grid electricity at the generation subsystem, in Uganda. The systems reliability theory and the auto regressive distributed lag (ARDL) model were used to estimate the effects of hydrology levels of Lake Victoria and rainfall on both the frequency and duration of power outages on the Ugandan power grid network. Both the short and long run effects were estimated and the findings revealed that hydrology levels of Lake Victoria significantly affected grid electricity reliability in the generation subsystem of the Ugandan power grid network in both the short and long runs. On the other hand, rainfall significantly affected the generation grid electricity reliability in only the short run, implying that rainfall effects on grid electricity reliability on the generation subsystem, do not spill over onto the long run. The study recommends proper management of lake Victoria and other water resources so that reliability of grid electricity at the generation subsystem is not disrupted by the environmental factors under study.
## I. INTRODUCTION
Electricity is a vital resource in modern society and its reliability is essential for economic development, public safety, and general wellbeing (Alhelou et al., 2019; Worldbank, 2018). Therefore, the lack of reliable electricity (especially grid electricity) is a constraint on economic development (Worldbank 2017). According to the World Bank, sub-Saharan Africa is facing significant challenges in terms of grid reliability. An example of such a challenge is the cumulative time of power outages in the region, which amounts to approximately three months of production time lost per year (Karekezi et al., 2012; World Bank, 2017).
Approximately 15 years ago, Uganda had electricity challenges of electricity demand exceeding supply by a 2-to-1 ratio and this was because low water levels in Lake Victoria (Wabukala et al., 2021). Although environmental factors have been reported to cause power outages, empirical studies on their effect of Uganda's case especially in terms of their effect on the frequency and duration of power interruptions are scarce.
Furthermore, despite the fact that environmental factors have been documented to influence grid electricity reliability (Alhelou et al., 2019; Cadini et al., 2017; Rentschler et al., 2019; Veloza & Santamaria, 2016; Wabukala et al., 2021), studies that have used the systems reliability theory are rare. In addition, some of the studies like (Alhelou et al., 2019; Veloza & Santamaria, 2016; Ward, 2013) used a qualitative approach to review, discuss and report environmental related challenges of grid electricity reliability. The studies that have used a quantitative approach such as Kabir et al., (2019) and Sahai & Pahwa (2006) used probability analysis to assess the reliability of the grid components whereas, Andersson et al., 2005; Davidson et al., 2003; Ivanova et al., 2020; Mitchell, 2013; Vinogradov et al., 2020) used descriptive analysis to investigate environmental factors that influence grid systems reliability performance. The studies that have used ARDL to investigate the environmental factors that influence grid electricity reliability are scarce. The econometric ARDL model separates the long run from the short run effects. This helps policy makers to plan accordingly for both the short run shocks as the long run approaches.
This study uses the autoregressive distributed lag (ARDL) model and systems reliability theory to estimate the effect of environmental factors in particular hydrology levels of Lake Victoria, as well as rainfall, on generation grid electricity reliability, in terms of both frequency and duration of power outages.
The generation subsystem of the Ugandan power grid is largely dependent on hydropower sources (Katutsi et al., 2021; Wabukala et al., 2021), whose water levels are easily vulnerable to changes in the environment, weather patterns, and other natural disasters. In addition, natural disasters, such as floods, are serious and recurring events that can result in, among others, the destruction of power grids, leading to power outages (Kumar & Biswanath, 2020). Disasters such as floods could be triggered by heavy rains. To avoid such electricity supply interruptions, it is necessary to investigate whether environmental factors such as hydrology levels of water resources and rainfall could be responsible for unreliable electricity power generation in Uganda.
### a) Main Objective
This study aims to investigate the effect of environmental factors on the reliability of grid electricity in the generation subsystem in Uganda.
### b) Specific Objectives
1. To examine the effect of hydrology levels of lake Victoria on the generation grid electricity reliability in Uganda.
2. To examine the effect of rainfall on the generation grid electricity reliability in Uganda.
### c) Motivation of the study
This study gets its motivation from the United Nations Sustainable Developmental Goal Seven (SDG 7) which is "ensuring access to affordable, reliable, sustainable and modern energy for all by 2030" United Nations (2017). However, Uganda like other developing countries, continues to suffer from unreliable grid electricity supply. Uganda was ranked 108 out of 137 countries, by the World Economic Forum (WEF) in 2019, with an electricity reliability score of 3.4 out of 7. This was a decline for Uganda, from 103 in 2016 to 108 in 2019(WEF, 2019). In addition, grid reliability in Uganda is currently at $73.3\%$ with customers experiencing power outage durations and power outage frequency averagely at 189.6 hours and 84 times per month (ERA, 2020b). This supply of unreliable grid electricity continues to compromise the functions sectors ranging from residential, manufacturing, agriculture, transport as well as service sectors that depend to a large extent on electricity in particular to function (Fashina et al., 2018). However, grid electricity is subject to a range of factors that influence it reliability and some could be environmental in nature. It is therefore important to examine these factors and address the grid electricity related challenges, so that the electricity dependent functions of these sectors are not compromised.
## II. LITERATURE REVIEW AND HYPOTHESIS TESTING
### a) Theoretical Review
In this study, we use systems reliability theory (Shewhart & Wilks, 2021) to argue that reliability is the ability of a system to perform as required in a stated operating context and for a given time. This theory further states that a system is made up of interrelated elements that are organized to achieve one or more stated purposes. These interrelated elements are usually classified as subsystems (Shewhart & Wilks, 2021) such that a failure on one subsystem leads to failure on the other subsystems and hence failure of the whole system. A failed system is not able to deliver as expected and therefore becomes unreliable. The systems reliability theory, assumes that all systems are used in some sort of environment that may influence the system and could make them susceptible to faults and failures (Shewhart & Wilks, 2021). These system failures and faults lead to system unreliability. System failures and faults are defined as a set of circumstances that lead to system failure and these can be an environmental event, including but not limited to; rainfall and hydrology levels of water resources (Ward, 2013).
Relatedly, grid electricity system, reliability has been defined as the ability of power grid elements to supply electricity to all consumers connected to it (Borecki et al., 2020). The power grid is an electrical system network which is comprised of subsystems that include; generation, transmission and distribution subsystems. These subsystems are connected and interrelated together in such a way that a failure on one subsystem of the grid leads to failure on the entire grid system, thus compromising the reliability of the power grid system. The generation subsystem is essential on the power grid in such a way that, failure or fault on this part of the power grid compromises grid electricity reliability on the entire power grid system since it's the genesis of the power grid system. The power grid system too resides in an environment that makes it susceptible to system failures and system faults and these comprise the reliability of the power grid system. These system failures and system faults could be caused by rainfall and hydrology levels of water resources.
### b) Empirical Review And Hypothesis Testing
The effect of weather and other changes in the environment on the reliability of grid electricity have been studied (Alhelou et al., 2019; Wang & Billinton, 2002; Ward, 2013). For example, (Davidson et al., 2003) looked at the effect of different cover types on grid electricity reliability but focused on only the distribution subsystem. In addition, (Carreras et al., 2019; Ivanova et al., 2020; Vinogradov et al., 2020) studied the effect of different tree characteristics on grid electricity reliability (Carreras et al., 2019; Ivanova et al., 2020; Vinogradov et al., 2020) but these studies concentrated on the transmission and distribution subsystems. Other studies that also looked at environmental factors considered antecedents such flooding (Koks et al., 2019; Kwasinski et al., 2009) but had a qualitative approach and also were done in the distribution subsystem. A few studies that have looked at the generation grid electricity reliability, have looked at the effect of hurricanes and mainly had a qualitative approach and have been done in developed countries (Alhelou et al., 2019; Liu & Singh, 2011). However, the above studies seem to be silent on the effect of hydrology levels of water resources on grid electricity reliability specifically in the generation subsystem on the Uganda.
Furthermore, Ward (2013) reviewed the effects of weather on the reliability of power grid systems and found out that in North America, some of the grid faults were caused by rainfall. However this study was done in the distribution subsystem, and had a qualitative approach. Davidson et al., (2003) also examined the relationships between power grid disruptions caused by rainfall and found out that rainfall led to power grid outages while Kabir et al., (2019) in their study on predicting power outages point out rainfall as one of the influences of grid electricity reliability. These studies were also done in the distribution subsystem. In addition most of these studies have been done in the developed countries and a few in developing countries and besides, there is no empirical evidence in literature on the effect of both hydrology levels of Lake Victoria and rainfall, especially in terms of frequency and duration of power outages in Uganda. Therefore this study hypothesizes that;
- H1: Hydrology levels of lake Victoria have a significant effect on generation grid electricity reliability in Uganda in both the short and long run.
- H2: Rainfall has a significant effect on the generation grid electricity reliability in Uganda in both the short and long run.
## III. RESEARCH METHODOLOGY
### a) Data and Data Sources
To attain the objective of this study took on an explanatory research design which focuses on explaining the aspects of the effect of hydrology levels of Lake Victoria and rainfall on the generation grid electricity reliability. The study used monthly time series data covering a period from 2012-2022. Time series data was used because it provides insights into how a given variable changes over time, identifies patterns in the data and can be used to predict the future behaviour of a variable. Data containing the dependent variables of the study was obtained from Uganda Electricity Generation Company Limited (UEGCL). This was power outage data from four large hydropower generation plants in Uganda and also connected to the power grid. (Kiira hydropower plant, Owen falls hydropower plant, Bujagali hydropower plant, and Isimba hydropower plant), collected and recorded using the SCADA software system. Power outage data was measured using both the frequency of power outages and duration of power outage.
The study also obtained monthly data for the independent variables which included hydrology levels of lake Victoria and rainfall from the Ministry of Water and Environment and Uganda National Metrological Authority databases. These organisations collect and record data on weather, environmental features and power utility parameters. In this context, hydrology levels of lake Victoria refers to the amount of water available in
Lake Victoria and used for electricity generation. It was measured in meters from a reference point of 1122.892m to Mombasa from Jinja. On the other hand, rainfall refers to the amount of precipitation in form of rain that is received throughout the country and measured in mill meters (mm) per month.
### b) Variables of the Study
The variables of the study were defined in line with the systems reliability theory, previous literature and also according to ERA and Ministry of Water and Environment (ERA, 2020a; Haes Alhelou et al., 2018; Shewhart & Wilks, 2021; Tsimtsios & Safigianni, 2016). The dependent variables were frequency and duration of powers which are used to measure grid electricity reliability.
## i. Dependent Variable
### Frequency of Power Outages:
This is defined as how often electricity disruptions occur on the grid subsystems. It was measured by the No. of power interruptions experienced by the large hydropower plants per month.
#### Duration of Power Interruptions:
This is a measure of the length of time that a power outage lasts from the moment it begins until power is restored and it was measured by the No. of hours of power interruption experienced by the large hydropower plants per month.
## ii. Independent Variables
### Rainfall:
In this context, rainfall refers to the amount of precipitation in form of rain that is received throughout the country in mill meters (mm) per month.
#### Hydrology levels:
This refers to the amount of water available in Lake Victoria and used for electricity generation. It was measured in meters from reference point of 1122.892m.
#### System overload:
This occurs when the demand for electricity exceeds the supply capacity of the grid. It was measured using the number of system overload events experienced by the large experienced by the large hydropower plants per month.
#### Failed Equipment:
This refers to any malfunction or damaged equipment within the grid infrastructure such as transformers, power lines or circuit breakers. It was measured using the number of failed equipment recorded by the large hydropower plants per month.
#### Technical Faults:
They refer to any technical issue that occurs within the grid infrastructure such as faults in control systems, communication systems or protection systems. It was measured using the number of technical faults recorded by the large hydropower plants
#### Repair and maintenance costs:
The amount of money power utilities spend on maintaining and repairing the power grid and was measured using repair and maintenance costs incurred by the large hydropower plants per month.
#### System shutdowns:
These include unplanned shutdowns caused external or internal operations and planned shutdowns caused by planned operations. It was measured using the number of times the large hydropower plants experienced system shutdowns per month.
### c) Estimation Model Procedure
One of the basic parameters that define the reliability of the power grid is the number of and length of time of power grid system failures (Tsimtsios & Safigianni, 2016). This paper sought to determine the effect of environmental factors on the reliability of generation grid electricity. Theoretically and empirically, grid reliability can be influenced by environmental factors (Alhelou et al., 2019; Shewhart & Wilks 2021).
$$
\text{Reliability} _ {t} = \alpha + \beta_ {1} \text{environmentalfactors} _ {t} + e _ {t} \dots \dots
$$
Equation 1
The study first carried out pre estimation tests on the data before deciding on which time series model to use for estimation. In order to observe the long term movement in the data this study used time series line plots. The time series line plots of the study variables are documented in the appendix section this paper. It is paramount to do unit root tests of all the variables in the model before estimating the model in order to avoid the problem of spurious results which emanate from estimation of non-stationary time series. Therefore the study carried unit root tests for stationarity using Augmented Dickey Fuller (ADF) (1979 and 1981) and (Phillips and Perron, 1986) tests to determine the order of integration of the variables in the model both in levels and in first difference. The results of the unit root test as shown in the appendix section, show that all the variables except hydrology levels, were stationary in levels. Hydrology levels became stationary after differencing it once. Therefore, since the variables had a mixture of both I (0) and I (1) orders of integration, it was possible to estimate the ARDL model for the generation subsystem.
To ascertain if the independent variables had a long run relationship with their dependent variables, the study carried out co-integration tests. The results for the cointegration test(s) for the are shown in the appendix section.
For the generation subsystem, the dependent variables are frequency of power outages $(FOU_{t})$ and duration of power outages $(DOU_{t})$ and their lagged values were expressed as $F O U_{t - 1}$ and $DOU_{t - 1}$ for frequency of power outages and duration of power outages respectively. The explanatory variables in the model include; hydrology levels of lake Victoria (HL) and rainfall (RF). Their lagged values are expressed as $HL_{t-1}$ and $RF_{t-1}$. This study controlled for system shutdowns $(SH_{t})$, maintenance and repair costs $(MR_{t})$, technical faults $(TF_{t})$, failed equipment $(BE_{t})$ and system overload $(O_{t})$. The lagged values of the control variables were expressed as; shutdowns $(SH_{t-1})$, maintenance and repair costs $(MR_{t-1})$, technical faults $(TF_{t-1})$, failed equipment $(BE_{t-1})$ and system overload $(O_{t-1})$, which have been documented as influencers of grid electricity reliability.
### d) Econometric model Estimation for the study
According to the systems reliability theory Shewhart and Wilks (2021) and Ward (2013) grid electricity reliability is influenced by environmental factors such as hydrology levels and rainfall. Basing on such a background, the study therefore formulated the ARDL regression model (s) shown equations 2 and 3 for both frequency and duration of power outages;
$$
\boldsymbol{FOU}_{t} = \mathfrak{f}\left(SH_{t},MR_{t},RF_{t},HL_{t},BE_{t},TF_{t},O_{t}\right)\dots\dots\text{Equation 2}
$$
$$
\boldsymbol {D O U} _ {t} = f \left(S H _ {t}, M R _ {t}, R F _ {t}, H L _ {t}, B E _ {t}, T F _ {t}, O _ {t}\right) \dots \dots \text {E q u a t i o n 3}
$$
Equation 4 is the ARDL estimation model, which was used to analyze the long term and short term relationship between the variables of the study plus the error correction term for the frequency of power outages.
$$
\begin{array}{l} \ln F O U _ {t} = \beta_ {0} + \beta_ {1} \ln F O U _ {t - 1} + \beta_ {2} \ln S H _ {t - 1} + \beta_ {3} \ln M R _ {t - 1} + \beta_ {4} \ln R F _ {t - 1} + \beta_ {5} \Delta \ln H L _ {t - 1} + \beta_ {6} \ln T F _ {t - 1} + \\\beta_ {7} \ln B E _ {t - 1} + \beta_ {8} \ln O _ {t - 1} + \sum_ {i = 1} ^ {a} \beta_ {9, i} \ln F O U _ {t - 1} + \sum_ {i = 1} ^ {b} \beta_ {1 0, i} \ln S H _ {t - i} + \sum_ {i = 1} ^ {c} \beta_ {1 1, i} \ln M R _ {t - i} + \sum_ {i = 1} ^ {d} \beta_ {9, i} \ln R F _ {t - i} + \\+ \sum_ {i = 0} ^ {e} \beta_ {1 0, i} \Delta \ln H L _ {t - 0} + \sum_ {i = 0} ^ {f} \beta_ {1 0, i} \ln F T _ {t - 0} + \sum_ {i = 0} ^ {g} \beta_ {1 0, i} \ln B E _ {t - 0} + \sum_ {i = 0} ^ {h} \beta_ {1 0, i} \ln O _ {t - 0} + \\\dots \dots \dots \dots \dots + \theta_ {6} E C M _ {t - 1} + e _ {t}. \\\end{array}
$$
Equation 4
Relatedly, for duration of power outages the same steps were followed and the ARDL model was established as below in equation 5;
$$
\begin{array}{l} \ln D O U _ {t} = \beta_ {0} + \beta_ {1} \ln D O U _ {t - 1} + \beta_ {2} \ln S H _ {t - 1} + \beta_ {3} \ln M R _ {t - 1} + \beta_ {4} \ln R F _ {t - 1} + \beta_ {5} \Delta \ln H L _ {t - 1} + \beta_ {6} \ln T F _ {t - 1} + \\\beta_{7}\ln{BE_{t - 1}} + \beta_{8}\ln{O_{t - 1}} + \sum_{i = 1}^{a}\beta_{9,i}\ln{FOU_{t - 1}} + \sum_{i = 1}^{b}\beta_{10,i}\ln{SH_{t - i}} + \sum_{i = 1}^{c}\beta_{11,i} \ln{MR_{t - i}} + \sum_{i = 1}^{d}\beta_{9,i}\ln{RF_{t - i}} + \\+ \sum_ {i = 0} ^ {e} \beta_ {1 0, i} \Delta \ln H L _ {t - 0} + \sum_ {i = 0} ^ {f} \beta_ {1 0, i} \ln T F _ {t - 0} + \sum_ {i = 0} ^ {g} \beta_ {1 0, i} \ln B E _ {t - 0} + \sum_ {i = 0} ^ {h} \beta_ {1 0, i} \ln O _ {t - 0} + \\\dots \dots \dots \dots \dots + \theta_ {6} E C M _ {t - 1} + \lambda_ {t}. \tag{Equation 5} \end{array}
$$
Where $\Delta$ was the first order differential operator, $\lambda_{t}$ and $e_t$ represent the white noise.
## IV. RESULTS OF THE STUDY
### a) Descriptive Statistics
Table 1 presents the descriptive statistics of the study variables (dependent and independent) for the generation subsystem.
Table 1: Descriptive Statistics of Variables of the Study (N= 128)
<table><tr><td>Variable</td><td>Mean</td><td>Std. dev.</td><td>Min</td><td>Max</td><td>Skewness</td><td>Kurtosis</td></tr><tr><td>Maintenance and repair costs</td><td>408.01</td><td>651.29</td><td>54</td><td>3860</td><td>3.99</td><td>20.24</td></tr><tr><td>System shutdowns</td><td>21.86</td><td>18.18</td><td>1</td><td>118</td><td>2.08</td><td>9.46</td></tr><tr><td>Hydrology levels</td><td>12.174</td><td>0.47</td><td>11.31</td><td>13.4</td><td>-0.49</td><td>8.41</td></tr><tr><td>Rainfall</td><td>111.65</td><td>52.59</td><td>32.90</td><td>247.71</td><td>0.03</td><td>2.25</td></tr><tr><td>Technical Faults</td><td>53.57</td><td>39.48</td><td>6</td><td>248</td><td>1.85</td><td>7.58</td></tr><tr><td>Failed Equipment</td><td>2.81</td><td>3.42</td><td>0</td><td>21</td><td>2.39</td><td>10.67</td></tr><tr><td>Frequency of Outages</td><td>230.08</td><td>74.36</td><td>92</td><td>643</td><td>2.52</td><td>13.45</td></tr><tr><td>Duration of Outages</td><td>4757.02</td><td>1351.44</td><td>17.38</td><td>5976.38</td><td>0.57</td><td>7.42</td></tr></table>
Source: STATA Software 17 outputs.
All the large hydropower plants combined experienced an average of 230 power interruptions per month. The average duration of power interruption was $4757\mathrm{~h}$ per month. On average, the water levels were $12.17\mathrm{~m}$ above $1122.892\mathrm{~m}$ in reference to Mombasa from Jinja. On average, technical faults occurred 54 times per month, whereas grid components failed on average three times per month. The average amount of rainfall received throughout the country is $11.65\mathrm{~mm}$ per month. The generation grid spends an average of 408 million (Uganda Shillings) on maintaining and repairing the grid. On average, system shutdowns took place 21 times per month.
## V. RESULTS OF THE STUDY
### a) Estimation results of the short term and long term ARDL model for the frequency and duration of power outages
Table 2 shows the estimation results on the effect of the effect of hydrology levels of lake Victoria and rainfall on both the frequency and duration of power outages on the generation subsystem in both the short and long run. The optimal lag order of each variable in the models was identified using HQIC, AIC and SBIC. Therefore, the ARDL (1, 4, 3, 1, 3, 2, 2, 2) was identified to be the most appropriate. The coefficients together with their respective probabilities are displayed below.
Table 2: The Estimation Results of the Long Term and Short Term Model of ARDL for the Frequency and Duration of Power Outages.
<table><tr><td></td><td></td><td colspan="2">Frequency of power outages</td><td colspan="2">Duration of power outages</td></tr><tr><td>Models</td><td>Variable</td><td>Coefficient</td><td>P-value</td><td>Coefficient</td><td>P-value</td></tr><tr><td>Long term model</td><td>In system shutdowns</td><td>0.1720</td><td>0.010</td><td>0.1201</td><td>0.273</td></tr><tr><td></td><td>In maintenance and repair costs</td><td>-0.0348</td><td>0.330</td><td>-0.7555</td><td>0.011</td></tr><tr><td></td><td>In rainfall</td><td>0.1949</td><td>0.009</td><td>0.1125</td><td>0.326</td></tr><tr><td></td><td>D. Hydrology levels</td><td>-0.9151</td><td>0.043</td><td>-0.4486</td><td>0.518</td></tr><tr><td></td><td>In technical faults</td><td>0.2080</td><td>0.002</td><td>-0.0141</td><td>0.907</td></tr><tr><td></td><td>In failed equipment</td><td>-0.0125</td><td>0.833</td><td>0.2102</td><td>0.066</td></tr><tr><td></td><td>System overload</td><td>0.0442</td><td>0.077</td><td>-0.1001</td><td>0.809</td></tr><tr><td></td><td>C</td><td>3.004</td><td>0.000</td><td>4.8252</td><td>0.001</td></tr><tr><td>Short term model</td><td>In system shutdowns</td><td></td><td></td><td></td><td></td></tr><tr><td></td><td>D1.</td><td>0.0077</td><td>0.895</td><td>-0.0003</td><td>0.996</td></tr><tr><td></td><td>LD.</td><td>-0.0309</td><td>0.526</td><td>-0.0060</td><td>0.920</td></tr><tr><td></td><td>L2D.</td><td>-0.5952</td><td>0.140</td><td>-0.0362</td><td>0.448</td></tr><tr><td></td><td>L3D.</td><td>-0.0901</td><td>0.004</td><td>-0.0430</td><td>0.209</td></tr><tr><td></td><td>In maintenance and repair costs</td><td></td><td></td><td></td><td></td></tr><tr><td></td><td>D1.</td><td>-0.0424</td><td>0.347</td><td>0.0572</td><td>0.266</td></tr><tr><td></td><td>LD.</td><td>-0.0046</td><td>0.906</td><td>0.0104</td><td>0.822</td></tr><tr><td></td><td>L2D.</td><td>-0.0248</td><td>0.523</td><td>0.0608</td><td>0.160</td></tr><tr><td></td><td>In rainfall</td><td></td><td></td><td></td><td></td></tr><tr><td></td><td>D1.</td><td>-0.0951</td><td>0.065</td><td>-0.0194</td><td>0.724</td></tr><tr><td></td><td>D. Hydrology levels</td><td></td><td></td><td></td><td></td></tr><tr><td></td><td>D1.</td><td>0.7626</td><td>0.019</td><td>0.3039</td><td>0.405</td></tr><tr><td></td><td>LD.</td><td>0.1913</td><td>0.276</td><td>0.3649</td><td>0.070</td></tr><tr><td></td><td>L2D.</td><td>0.0448</td><td>0.707</td><td>0.0074</td><td>0.958</td></tr><tr><td></td><td>In failed equipment</td><td></td><td></td><td></td><td></td></tr><tr><td></td><td>D1.</td><td>-0.0207</td><td>0.642</td><td>-0.1125</td><td>0.044</td></tr><tr><td></td><td>LD.</td><td>0.1018</td><td>0.162</td><td>0.0527</td><td>0.149</td></tr><tr><td></td><td>In technical faults</td><td></td><td></td><td></td><td></td></tr><tr><td></td><td>D1.</td><td>-0.0231</td><td>0.754</td><td>0.0863</td><td>0.228</td></tr><tr><td></td><td>LD.</td><td>0.1018</td><td>0.108</td><td>0.1376</td><td>0.844</td></tr><tr><td></td><td>System overload</td><td></td><td></td><td></td><td></td></tr><tr><td></td><td>D1.</td><td>-0.0020</td><td>0.911</td><td>0.0306</td><td>0.128</td></tr><tr><td></td><td>LD.</td><td>-0.0025</td><td>0.839</td><td>0.0070</td><td>0.617</td></tr><tr><td></td><td>ECM</td><td>-0.8679</td><td>0.000</td><td>-0.5672</td><td>0.002</td></tr></table>
In table 2, the study found that a unit increase in meters in the hydrology levels of Lake Victoria led to 91.5 percent (significant) decrease in the frequency of generation grid power interruptions hence increasing grid electricity reliability. The coefficient of hydrology levels in the long run implies that high hydrology levels improve grid reliability to large extent. In the short run however, hydrology levels of lake Victoria were negatively associated with grid electricity reliability in the long run because a unit increase in meters in the hydrology levels of Lake Victoria led to 76 percent (significant) increase in the frequency of generation grid power interruptions hence compromising grid electricity reliability. This implies that the increases in the water levels of lake Victoria were not sufficient enough for power generation purposes.
In terms of duration of power outages, a unit increase in meters in the hydrology levels of Lake Victoria in the long run, led to 44 percent (not significant) decrease in the duration of power outages, hence improving grid electricity reliability. In the short run, however, a unit increase in meters in the hydrology levels of Lake Victoria led to 36 percent (significant) increase in the duration of power outages. This implies that the increases in the water levels of lake Victoria were not sufficient enough for power generation purposes.
Therefore the H1 was supported in both in terms of frequency of power outages in both the long and short runs. In terms of duration of power outages, H1 was supported only in the short run.
In normal practice, in Uganda, the River Nile Basin management, with the permission of the Directorate Water Resources under the Ministry of water and Environment, regulates the amount of water that each generator can draw from Lake Victoria for power generation purposes. This is referred to as the flow rate usage. In the event that the flow rate usage is $Q = 1000 \text{cc}$ per second, this implies that a generator can only supply 4173.6 MWh an equivalent of 17 MWh. This could sometimes be below the capacity of the generator. This poses a big challenge in the face of growing demand for energy amidst climate change shocks especially in the future. Bujagali, Owen falls and Kiira dams all experienced low hydrology levels between 2012 and 2022.
In terms of frequency of power outages, a unit increase in the percentage of rainfall in the generation subsystem led to 19.5 percent (significant) increase in the frequency of generation grid power interruptions hence reducing grid electricity reliability in the long run. In the short run, rainfall significantly reduced power interruptions by 9 percent. This implies that rainfall did not disrupt the power generation activities at the hydro power plants in the short run.
In terms of duration of power outages, the study found out that a unit increase in the percentage of rainfall in the generation subsystem led to 11.3 percent (not significant) increase in the duration of generation grid power interruptions, hence reducing grid electricity reliability in the long run. In the short run, a unit increase in the percentage of rainfall in the generation subsystem led to 1.9 percent (not significant) decrease in the duration of generation grid power interruptions, hence improving grid electricity reliability. The coefficients of rainfall in both the long and short runs imply that rainfall, did not significantly affect the duration of power interruptions in the generation of hydropower. Therefore the H2 was supported in terms of frequency of power outages both the long and short runs. In terms of duration of power outages H2 was not supported.
b) Dynamic ARDL Simulations for the Frequency of Power Outages Due to Changes in Environmental Variables.
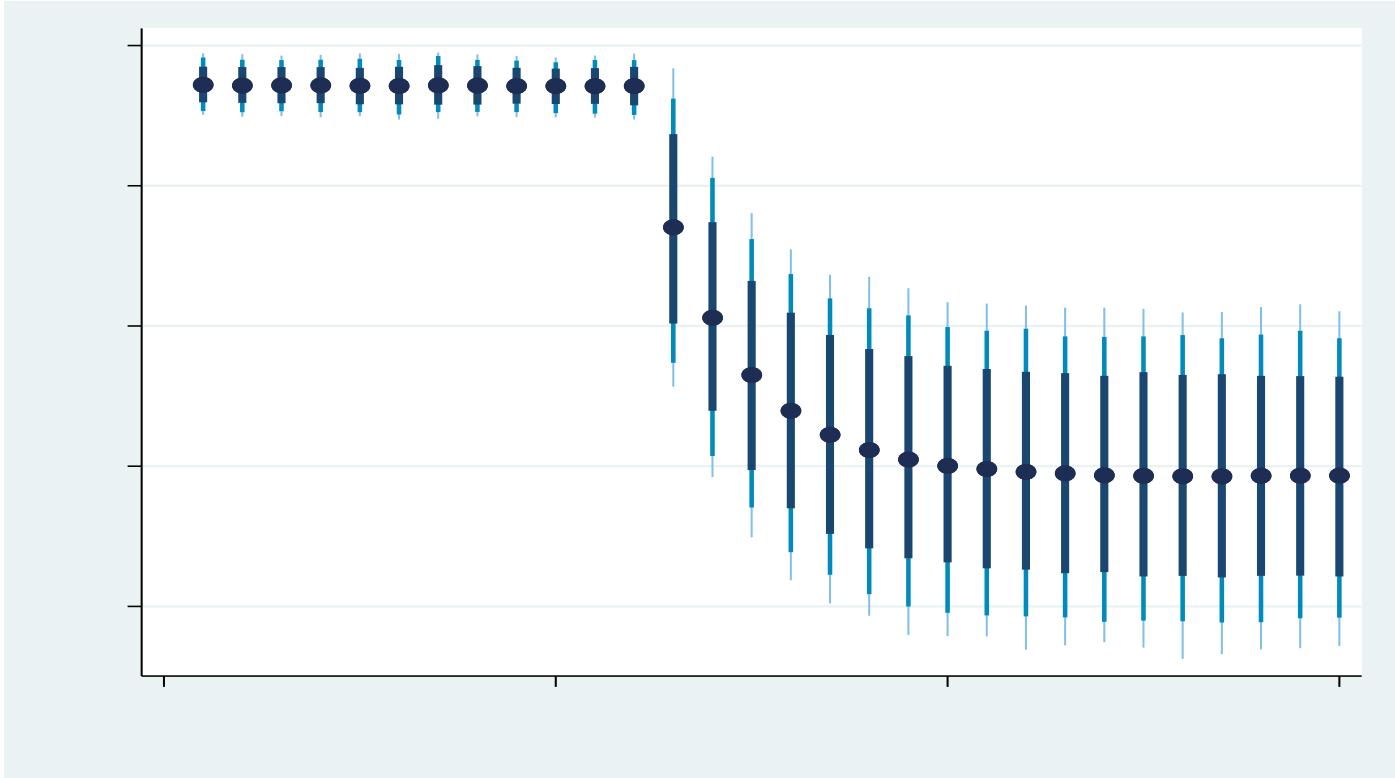
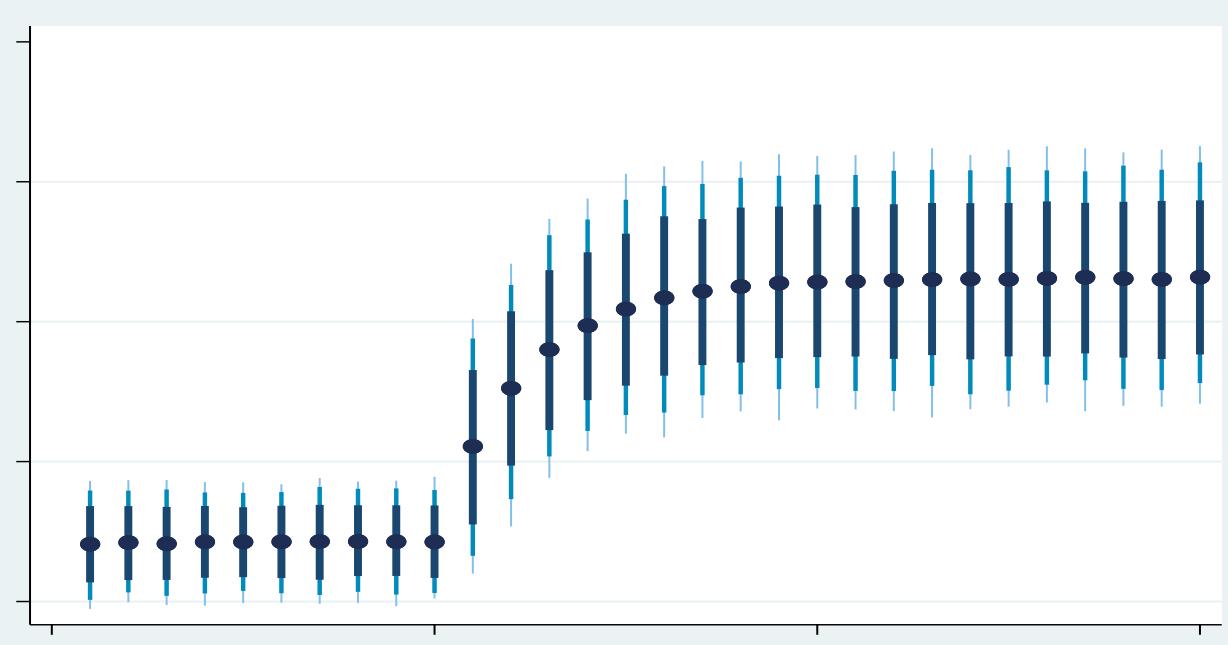
This study also carried out dynamic ARDL simulations to capture future shocks in the frequency of power outage due to changes in both hydrology levels of lake Victoria of in the generation subsystem. The dynamic ARDL simulations revealed that a 10 percent shock in predicted decrease in hydrology levels of lake Victoria may increase the frequency of power outages in the short only at 75 percent, 90 percent and 95 percent confidence levels as shown in figure 1.
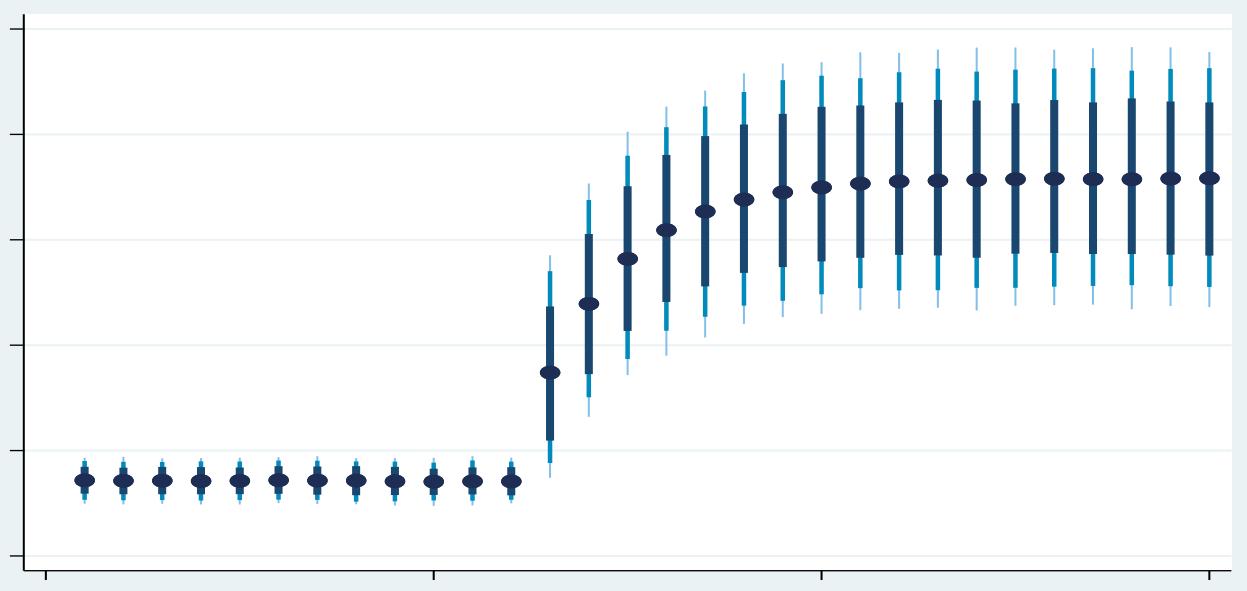
Source: STATA Software 17 outputs Figure 1: Dynamic ARDL Simulations for Frequency of Power Outages in the Generation Subsystem Due to -10% Shock in Hydrology Levels On the other hand, the dynamic ARDL simulations revealed that a 10 percent shock in predicted increase in hydrology levels of lake Victoria may reduce in the frequency of power outages in only the short run only at 75 percent, 90 percent and 95 percent confidence levels as shown in figure 2.
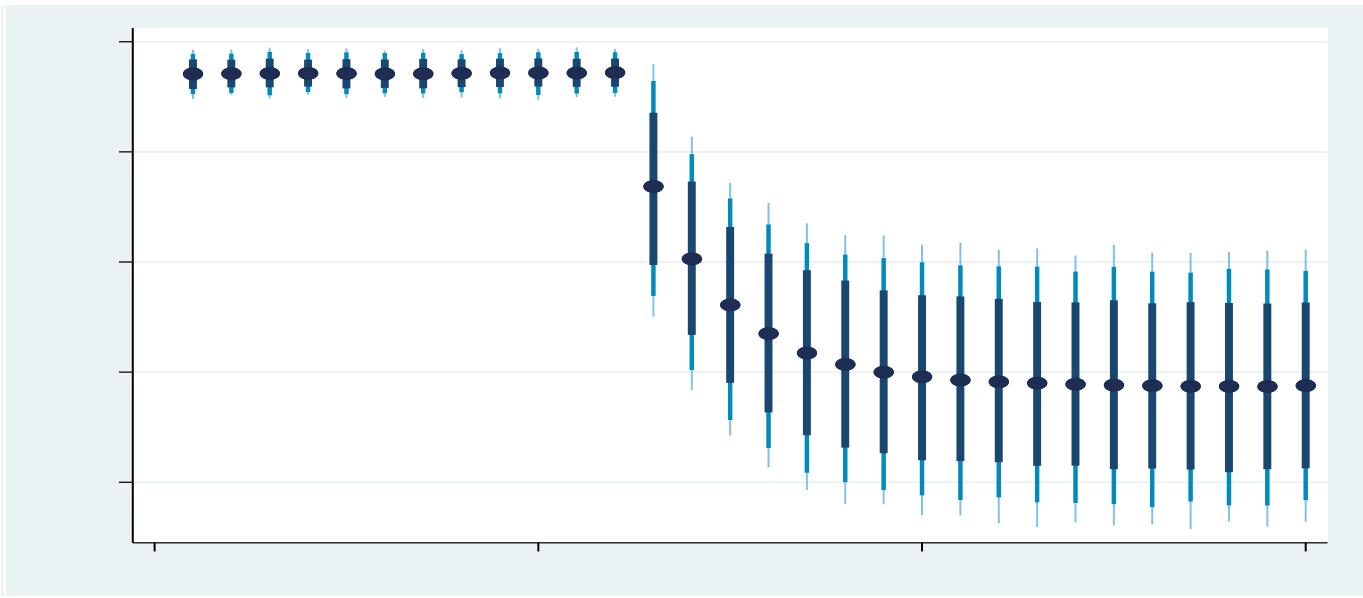 Figure 2: Dynamic ARDL Simulations for Frequency of Power Outages in the Generation Subsystem Due to
$10\%$ Shock in Hydrology Levels
Source: STATA Software 17 outputs
The dynamic ARDL simulations revealed that a 10 percent shock in predicted increase in rainfall may increase the frequency of power outages in the short only at 75 percent, 90 percent and 95 percent confidence levels as shown in figure3.
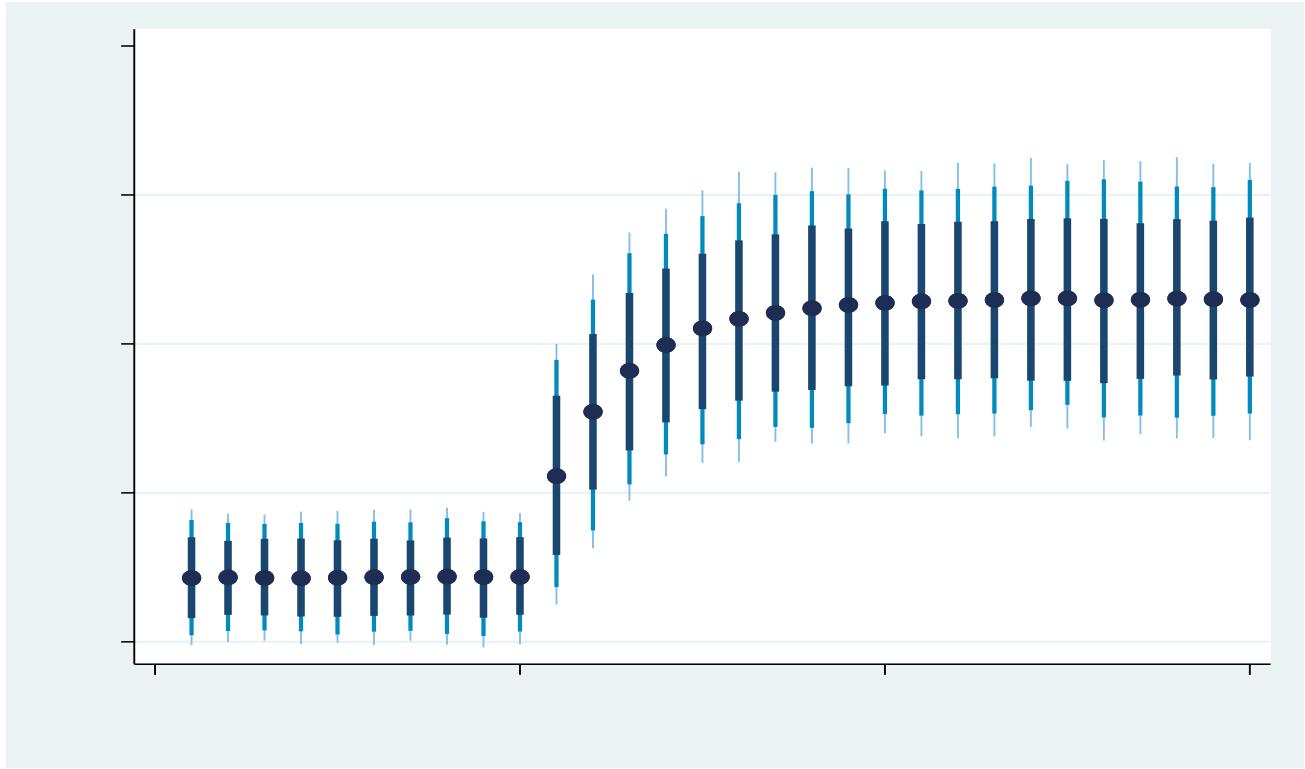 Figure 3: Dynamic ARDL Simulations for Frequency of Power Outages in the Generation Subsystem Due to 10 Percent Shock in Rainfall
Source: STATA Software 17 outputs
The dynamic ARDL simulations revealed that a 10 percent shock in predicted decrease in rainfall may reduce the frequency of power outages in the short only at 75 percent, 90 percent and 95 percent confidence levels as shown in figure 4.
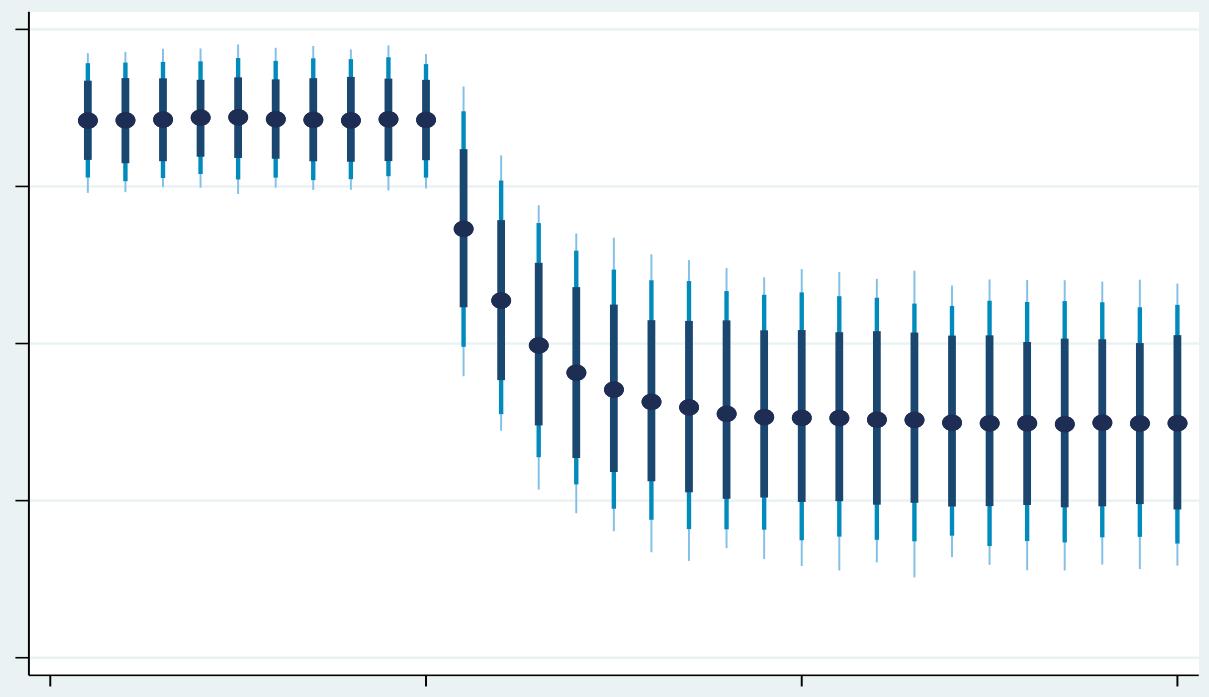 Figure 4: Dynamic ARDL Simulations for Frequency of Power Outages in the Generation Subsystem Due to 10 Percent Shock in Rainfall
Source: STATA Software 17 outputs
### c) Dynamic ARDL Simulations for the Frequency of Power Outages Due to Changes in Environmental Variables
This study also carried out dynamic ARDL simulations to capture future shocks in the duration of power outage due to future changes in both hydrology levels of lake Victoria and rainfall in the generation subsystem. The dynamic ARDL simulations revealed that a 10 percent shock in predicted decrease in hydrology levels will reduce the duration of power outages in the short only at 75 percent, 90 percent and 95 percent confidence levels in figure 5.
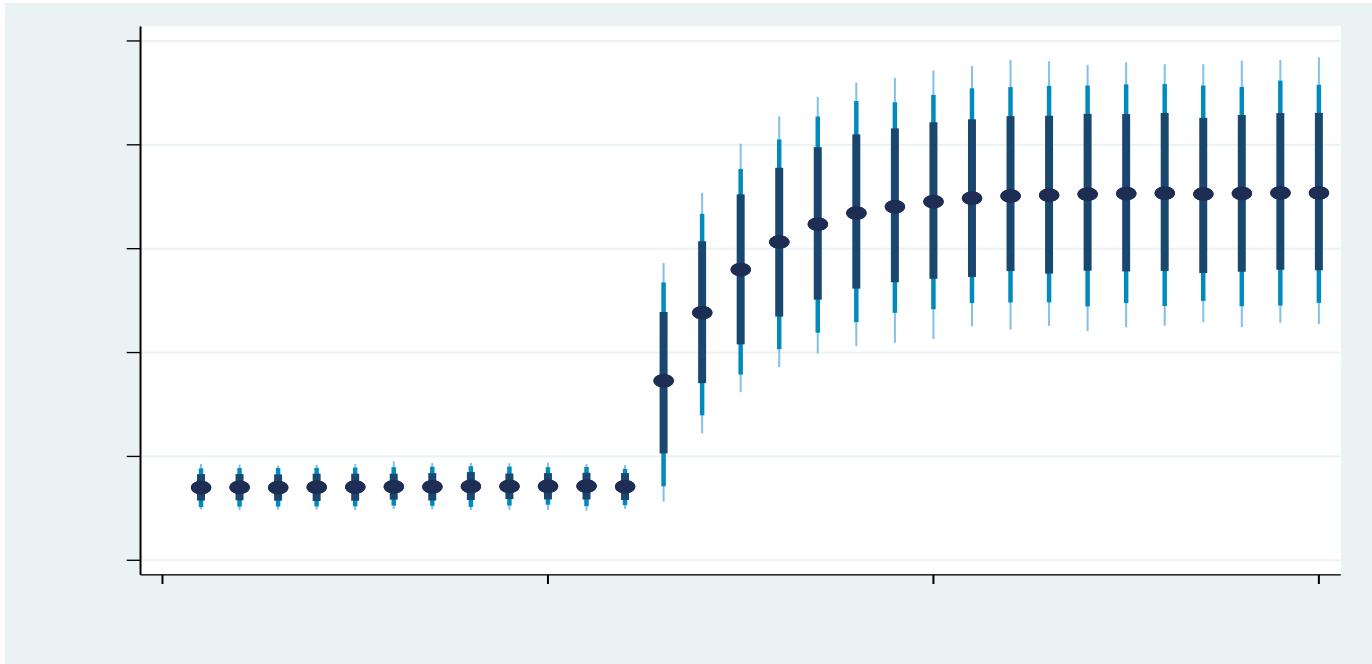 Figure 5: Dynamic ARDL Simulations for Duration of Power Outages in the Generation Subsystem Due to -10% Shock in Hydrology Levels
Source: STATA Software 17 outputs
Similarly, the dynamic ARDL simulations revealed that a 10 percent shock in predicted increase in hydrology levels of lake Victoria may decrease the duration of power outages in the short run only 75 percent, 90 percent and 95 percent confidence levels as shown in figure 6.
 Figure 6: Dynamic ARDL Simulations for Duration of Power Outages in the Generation Subsystem Due to
$10\%$ Shock in Hydrology Levels
Source: STATA Software 17 outputs
The dynamic ARDL simulations further revealed that a 10 percent shock in predicted increase in rainfall may increase the duration of power outages in the short run only 75 percent, 90 percent and 95 percent confidence levels as shown in figure 7.
Source: STATA Software 17 outputs
Figure 7: Dynamic ARDL simulations for duration of power outages in the generation subsystem due to 10 percent shock in rainfall On the other hand, the dynamic ARDL simulations further revealed that a 10 percent shock in predicted decrease in rainfall may reduce the duration of power outages in the short run only 75 percent, 90 percent and 95 percent confidence levels as shown in figure 8.
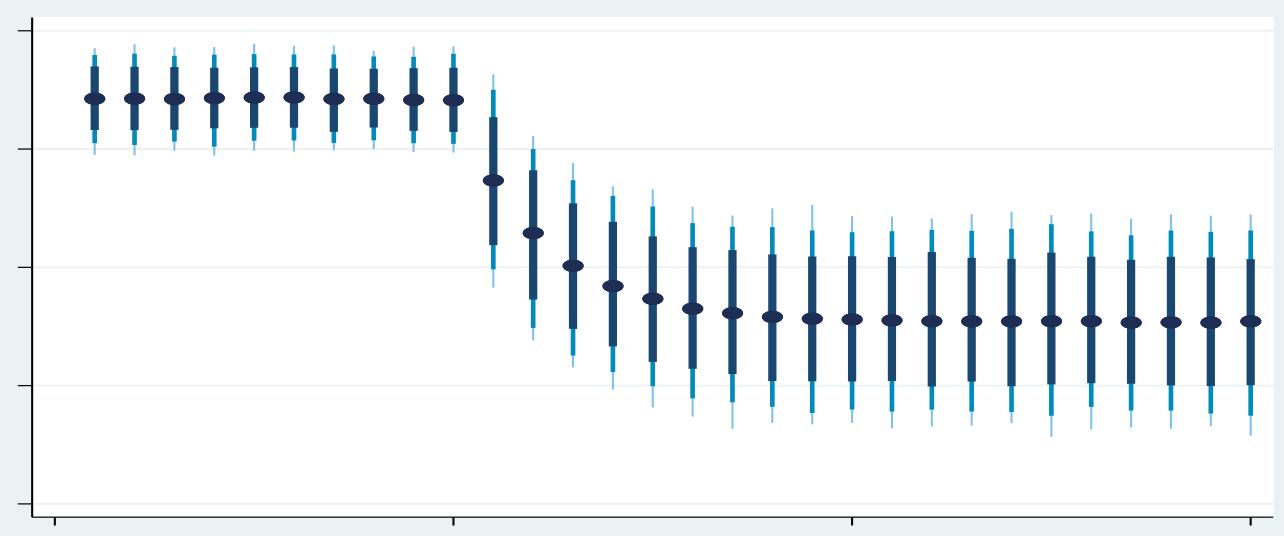 Figure 8: Dynamic ARDL Simulations for Duration of Power Outages in the Generation Subsystem Due to
$10\%$ Shock in Rainfall
Source: STATA Software 17 outputs
### d) 4.2 Validity of the Estimated Models
The study first carried out pre estimation tests on the data before deciding on which time series model to use for estimation. The time series line plots of the study variables to observe the long term movement in the data were carried out by the study. Unit root and co integration tests of all the variables in the model were also carried out. The study also carried out some post estimation tests including Breusch-Godfrey serial correlation test, Ramsey reset model specification test, Cameron and Trivedi's decomposition of IM test for heteroskedasticity test and the multicollinearity test, to ensure the validity of the estimated models. The results of the tests presented in the appendix show that the models ware robust.
## VI. DISCUSSION OF RESULTS
The outcomes from the model estimation reveal that in the long run, both rainfall and hydrology levels of Lake Victoria, have statistically significant effect on both the frequency and duration of power outages. Hydrology levels of Lake Victoria had a positive and statistically significant effect on the frequency of power outages in the generation subsystem in the long run. This implies that high hydrology levels of Lake Victoria will improve grid electricity in the generation subsystem in the long run through reduced frequency of power outages. However, hydrology levels of lake Victoria in the short run, had a negative effect on the frequency of grid electricity reliability in the generation subsystem. This implies that, despite the increase of hydrology levels of lake Victoria, power outages will still take place in the short run. This could be because this increase in hydrology levels will not besufficient for the power generation purposes as earlier pointed out.
In terms of duration of power interruptions, hydrology levels of lake Victoria significantly affected the duration of power outages in only the short run. This implies that the hydrology levels of Lake Victoria have not been sufficient enough for power generation activities in the recent time periods and therefore this led to long hours of power outages. This study notes that this challenge did not spill over to the later time periods because the duration of this duration of the power outages was insignificant in the long run. The study notes that the effect of hydrology levels of Lake Victoria no the generation grid reliability in terms of both frequency and duration of power outages have not been discussed before in empirical literature.
This finding is in line with the theory of system reliability which states that environmental factors influence the reliability of a system in one or the other, by leading to either system failures or system faults (Shewhart & Wilks, 2021). Other studies also agree with the findings of this study, which point out that Uganda's power sector is sensitive to water fluctuations from climatic change effects and this has caused unreliable power supply on the grid network (ERA, 2019; Wabukala et al., 2021) although these studies do not explain this fluctuation in terms of both frequency and duration of power outages.
Rainfall had a statistically significant (at 1 percent level of significance) positive effect on the frequency of power interruptions in the long run. This implies that rainfall will interrupt negatively the future power generating activities for the hydropower plants because by increasing the frequency of power outages. In the short run, rainfall has a negative effect on the frequency of power interruptions (at 10 percent level of significance). This implies that rainfall will not significantly interrupt power generating activities for the hydropower plants, despite an increase in the rainfall intensity.
In terms of duration of power interruptions, rainfall did not significantly affect the duration of power outages in both short and long run. This implies that rainfall leads to power outages on the generation grid but not for a long duration. The power generation activities quickly resume after rainfall events.
This result is consistent with the works of (Ward, 2013) who points out that the effects of weather on power grid systems and revealed that rainfall has an effect on grid systems, hence influencing grid electricity reliability. Additionally, (Ward, 2013) adds that heavy rain is normally associated with strong winds or lightning and concludes that faults brought about by normal weather usually have no significant effect on the supply of electricity to the customers. However (Ward, 2013) studied the distribution subsystem while this study looked at the generation subsystem. In addition, Davidson et al., (2003) also found out that rainfall led to power grid outages while Kabir et al., (2019) in their study also document rainfall as one of the influences of grid electricity reliability. However, these studies were also done in the distribution subsystem.
This results of this study are supported by the systems reliability theory which states that environmental factors can influence the reliability of a system hence resulting in either system interruptions (Shewhart & Wilks, 2021). In the past, rainfall has also been associated with floods (Ward, 2013) and floating vegetation (UEGCL, 2020) which are common features of Lake Victoria usually and have in the past disrupted electricity generation activities hence leading to power outages.
### a) Conclusion and Policy Recommendation
This study investigated the environmental factors that influence grid reliability in the generation subsystem. The study focused on the large hydropower plants that are connected to the national grid network that is kiira, Owenfall, Bujagali and Isimba hydropower plants. The study estimated an ARDL to model secondary time series data from 2012 to 2022 and found out that;
1. Rainfall increased frequency of power interruptions in the generation subsystem in both the short and long runs.
2. Rainfall did not increase duration of power interruptions in the generation subsystem in both the short and long runs.
3. Hydrology levels of Lake Victoria reduced frequency of power interruptions in the generation subsystem in the long run, but increased frequency of power interruptions in the generation subsystem in the short.
4. Hydrology levels of Lake Victoria significantly increased the duration of power interruptions in the generation subsystem in only the short run.
Our findings contribute to literature in the following ways. a). Analysing the effect of hydrology levels of Lake Victoria and rainfall on the generation grid electricity reliability in the Ugandan context b). The use of the systems reliability theory to analyse the effect of environmental factors on grid electricity reliability c). Using the ARDL model to estimate the short and long run effect of hydrology levels of Lake Victoria rainfallon both the frequency and duration of power outages.
Our findings imply that government should devise policies that increase grid electricity reliability in Uganda at the generation subsystem. We therefore suggest in order to reduce power interruptions in the generation subsystem, the government should invest in also strengthen policy in line with climate related action. This will help reduce the effect of environmental factors on grid electricity reliability. Hydropower generating firms are stakeholders of water resources and should participate in protecting them the environment if we are to have sustainable water resources for future use. Government needs to sensitize both the water users as well as the water source stakeholders of the need to appreciate the risks of poorly managed or neglected water sources that result in the compromised quality and quantity of water supply. This will increase the necessity to protect and preserve water sources in order to solve the ever-increasing challenges of sustaining acceptable supply of clean water required for among others the generation of grid power.
Government should also mobilise the various hydropower generating firms to contribute in all spheres towards the management of water sources. This will create a sense of ownership and of the water resource by its users and this could increase the protection of the water resources. We suggest stringent punishments for organisations and individuals who misuse the water resources. This will go an extra mile in the protection of water resources thus ensuring quality and quantity for hydropower production and also other uses.
In addition, we also suggest investing in robust power generating infrastructure as an alternative way of adapting to the changing environmental conditions as well as considering having alternative energy sources such as solar and wind onto the grid to diversify the energy mix and reduce dependence on hydropower.
### b) Areas for Further Research
This study focused rainfall and hydrology levels of Lake Victoria as factors that influence generation grid electricity reliability. However, there could be more environmental factors that influence grid electricity reliability. Future research in Uganda should investigate further the effect of floods and floating vegetation that influence grid electricity reliability. In addition further research needs to investigate the effect of the environmental factors on each of the hydro power plants for better future policy direction
#### Appendix
For the Frequency of power outages
#### Validity of the estimated model
The study carried out some post estimation tests to ensure the validity of the model.
### a) Serial Correlation Test
The study tested for serial correlation at 5 lags as shown in table A1 and concluded that the errors were not serially correlated.
Table A1: Breusch-Godfrey Test for Serial Correlation
<table><tr><td>Lags(p)</td><td>Chi2</td><td>Degrees of Freedom</td><td>Prob> chi2</td></tr><tr><td>5</td><td>14.374</td><td>5</td><td>0.0134</td></tr></table>
The results show that the p value (0.0134) is greater than 0.01 implying that we fail to reject the null hypothesis and conclude that there is no serial correlation at 1 percent level of significance.
### b) Model Specification Test
The results in table A2 show that the p value (0.0752) is greater than 0.05 implying that we fail to reject the null hypothesis and conclude that the model is correctly specified.
Table A2: Ramsey Reset Test for Model Specification
<table><tr><td>Test statistic</td><td>Degrees of Freedom</td><td>P-Value</td><td>Result</td></tr><tr><td>2.58</td><td>3</td><td>0.0752</td><td></td></tr></table>
### c) Heteroskedasticity Test
The results in table A3 show that the p value (0.4365) is greater than 0.05 implying that we fail to reject the null hypothesis and conclude that homoscedasticity is present.
Table A3. Cameron and Trivedi's Decomposition of IM test
<table><tr><td>Source</td><td>Chi</td><td>Degrees of Freedom</td><td>P-value</td></tr><tr><td>Heteroskedasticity</td><td>55.00</td><td>54</td><td>0.4365</td></tr><tr><td>Skewness</td><td>32.99</td><td>25</td><td>0.1313</td></tr><tr><td>Kurtosis</td><td>0.00</td><td>1</td><td>0.9766</td></tr><tr><td>Total</td><td>87.99</td><td></td><td>0.2533</td></tr></table>
### d) Multicollinearity Test
The results in table A4 show that the mean VIF value (3.26) is less than 5 implying that the variables do not have multicollinearity. The study concludes that there is a moderate level of correlation among the independent variables of the study.
Table A4: VIF test for multicollinearity
<table><tr><td>Variable</td><td>VIF</td><td>1/VIF</td></tr><tr><td>In maintenance and repair cost L1.</td><td>8.59</td><td>0.11</td></tr><tr><td>In frequency of power outages L1.</td><td>8.28</td><td>0.12</td></tr><tr><td rowspan="2">In maintenance and repair cost L2.</td><td>6.94</td><td>0.14</td></tr><tr><td>5.93</td><td>0.16</td></tr><tr><td>In Technical faults L1.</td><td>5.39</td><td>0.18</td></tr><tr><td>In maintenance and repair cost L3.</td><td>4.36</td><td>0.22</td></tr><tr><td rowspan="2">In system shutdowns L1.</td><td>3.72</td><td>0.26</td></tr><tr><td>3.65</td><td>0.27</td></tr><tr><td>In Technical faults L2.</td><td>3.09</td><td>0.32</td></tr><tr><td>In Rainfall L1.</td><td>2.52</td><td>0.39</td></tr><tr><td>In system shutdowns L3.</td><td>2.29</td><td>0.43</td></tr><tr><td>In Technical faults</td><td>2.25</td><td>0.44</td></tr><tr><td>Hydrology levels L3.</td><td>2.21</td><td>0.45</td></tr><tr><td>In system shutdowns L2.</td><td>2.17</td><td>0.46</td></tr><tr><td>In Rainfall</td><td>2.08</td><td>0.48</td></tr><tr><td>System overload</td><td>2.07</td><td>0.48</td></tr><tr><td>Hydrology levels</td><td>1.99</td><td>0.50</td></tr><tr><td>In Failed equipment</td><td>1.95</td><td>0.51</td></tr><tr><td>Hydrology levels L1.</td><td>1.94</td><td>0.51</td></tr><tr><td>In System overload L1.</td><td>1.90</td><td>0.52</td></tr><tr><td>Hydrology levels L2.</td><td>1.78</td><td>0.56</td></tr><tr><td>In Failed equipment L2.</td><td>1.75</td><td>0.57</td></tr><tr><td>In system shutdowns
L4.</td><td>1.65</td><td>0.60</td></tr><tr><td>In Failed equipment
L1.</td><td>1.64</td><td>0.60</td></tr><tr><td>System overload
L2.</td><td>1.48</td><td>0.67</td></tr><tr><td>Mean VIF</td><td>3.26</td><td></td></tr></table>
For the Duration of Power Outages
#### Validity of the Estimated Model
The study carried out some post estimation tests to ensure the validity of the model.
### a) Serial correlationtest
The study tested for serial correlation at 4 lags as shown in table A5 and concluded that the errors were not serially correlated.
Table A6: Breusch- Godfrey Test for Serial Correlation
<table><tr><td>Lags(p)</td><td>Chi2</td><td>Df</td><td>prob> chi2</td></tr><tr><td>4</td><td>7.810</td><td>4</td><td>0.0988</td></tr></table>
The results show that the p value (0.0988) is greater than 0.05 implying that we fail to reject the null hypothesis and conclude that there is no serial correlation at five percent level of significance.
### b) Model Specification Test
The results in table A6 show that the p value (0.0054) is less than 0.05 implying that we reject the null hypothesis and conclude that model could be having some missing variables.
Table A6: Ramsey Reset Test for Model Specification
<table><tr><td>Test statistic</td><td>Degrees of Freedom</td><td>P -Value</td><td>Result</td></tr><tr><td>5.33</td><td>3</td><td>0.0054</td><td></td></tr></table>
### c) Heteroscedasticity Test
The results in table A7 show that the p value (0.4365) is greater than 0.05 implying that we fail to reject the null hypothesis and conclude that homoscedasticity is present.
Table A7: Cameron and Trivedi's Decomposition of IM Test
<table><tr><td>Source</td><td>Chi</td><td>Degrees of Freedom</td><td>P-value</td></tr><tr><td>Heteroscedasticity</td><td>55.00</td><td>54</td><td>0.4365</td></tr><tr><td>Skewness</td><td>25.06</td><td>25</td><td>0.4592</td></tr><tr><td>Kurtosis</td><td>0.30</td><td>1</td><td>0.5859</td></tr><tr><td>Total</td><td>80.35</td><td>80</td><td>0.4678</td></tr></table>
### d) Multicollinearity Test
The results in table A8 show that the mean VIF value (2.98) is less than 5 implying that the variables do not have multicollinearity. The study concludes that
Time Series Plots for the Independent Variables there is a moderate level of correlation among the independent variables of the study.
Table A8: VIF Test for Multicollinearity
<table><tr><td>Variable</td><td>VIF</td><td>1/VIF</td></tr><tr><td>In maintenance and repair cost</td><td>8.75</td><td>0.11</td></tr><tr><td>L1.</td><td>6.82</td><td>0.14</td></tr><tr><td>L2.</td><td>6.11</td><td>0.16</td></tr><tr><td>In Technical faults</td><td rowspan="2">4.25</td><td rowspan="2">0.23</td></tr><tr><td>L1.</td></tr><tr><td>In maintenance and repair cost</td><td rowspan="2">4.13</td><td rowspan="2">0.24</td></tr><tr><td>L3.</td></tr><tr><td>In Duration of outages</td><td rowspan="2">3.65</td><td rowspan="2">0.27</td></tr><tr><td>L1.</td></tr><tr><td>In system shutdowns</td><td>3.10</td><td>0.32</td></tr><tr><td>In Technical faults</td><td rowspan="2">3.08</td><td rowspan="2">0.32</td></tr><tr><td>L2.</td></tr><tr><td>In system shutdowns</td><td rowspan="2">2.44</td><td rowspan="2">0.40</td></tr><tr><td>L1.</td></tr><tr><td>D. Hydrology levels</td><td rowspan="2">2.40</td><td rowspan="2">0.41</td></tr><tr><td>L3.</td></tr><tr><td>In In Rainfall</td><td rowspan="2">2.39</td><td rowspan="2">0.41</td></tr><tr><td>L1.</td></tr><tr><td>In system shutdowns</td><td rowspan="2">2.34</td><td rowspan="2">0.41</td></tr><tr><td>L3.</td></tr><tr><td>In Technical faults</td><td>2.22</td><td>0.44</td></tr><tr><td>In system shutdowns</td><td rowspan="2">2.19</td><td rowspan="2">0.45</td></tr><tr><td>L2.</td></tr><tr><td>System overload</td><td>2.14</td><td>0.46</td></tr><tr><td>D. Hydrology levels</td><td rowspan="2">2.07</td><td rowspan="2">0.48</td></tr><tr><td>L1.</td></tr><tr><td>In Rainfall</td><td>2.05</td><td>0.48</td></tr><tr><td>In Failed equipment</td><td rowspan="2">1.92</td><td rowspan="2">0.48</td></tr><tr><td>L2.</td></tr><tr><td>D. Hydrology levels</td><td>1.87</td><td>0.52</td></tr><tr><td>System overload</td><td rowspan="2">1.85</td><td rowspan="2">0.56</td></tr><tr><td>L1.</td></tr><tr><td>In system shutdowns</td><td rowspan="2">1.75</td><td rowspan="2">0.57</td></tr><tr><td>L4.</td></tr><tr><td>In Failed equipment</td><td rowspan="2">1.75</td><td rowspan="2">0.60</td></tr><tr><td>L1.</td></tr><tr><td>D. Hydrology levels</td><td rowspan="2">1.48</td><td rowspan="2">0.60</td></tr><tr><td>L2.</td></tr><tr><td>System overload</td><td rowspan="2">1.40</td><td rowspan="2">0.67</td></tr><tr><td>L2.</td></tr><tr><td>Mean VIF</td><td>2.98</td><td></td></tr></table>
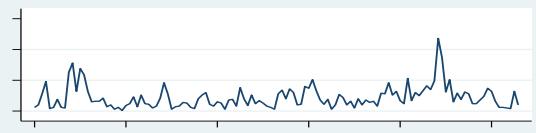
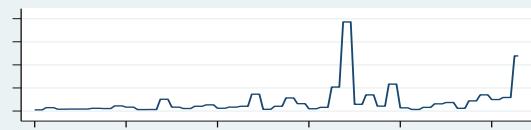
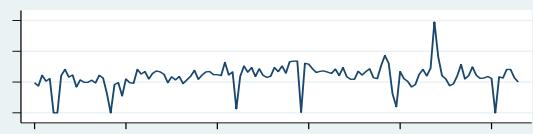
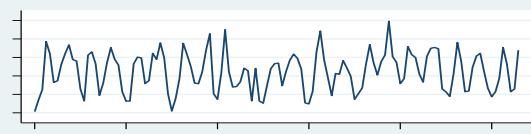
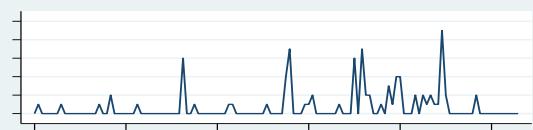
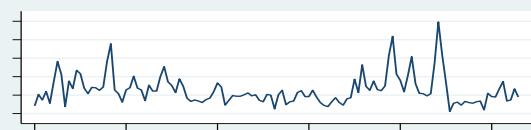 Figure 9: Time Series Line Plots Independent Variables (Generation Subsystem)
Source: STATA Software 17 outputs
Table 5: Results for the Unit Root Test for the Study Variables
<table><tr><td>Variable</td><td>Test statistic</td><td>1% critical value</td><td>5% critical value</td><td>10% Critical value</td><td>P-value</td></tr><tr><td>Frequency of outages</td><td></td><td></td><td></td><td></td><td></td></tr><tr><td>Dickey fuller</td><td>-4.643</td><td>-3.502</td><td>-2.888</td><td>-2.578</td><td>0.0001</td></tr><tr><td>Phillips Perrone</td><td>-4.635</td><td>-3.501</td><td>-2.888</td><td>-2.578</td><td>0.0001</td></tr><tr><td>Duration of outages</td><td></td><td></td><td></td><td></td><td></td></tr><tr><td>Dickey fuller</td><td>-4.280</td><td>-3.502</td><td>-2.888</td><td>-2.578</td><td>0.0005</td></tr><tr><td>Phillips Perrone</td><td>-5.253</td><td>-3.501</td><td>-2.888</td><td>-2.578</td><td>0.0000</td></tr><tr><td>System shutdowns</td><td></td><td></td><td></td><td></td><td></td></tr><tr><td>Dickey fuller</td><td>-4.231</td><td>-3.502</td><td>-2.888</td><td>-2.578</td><td>0.0006</td></tr><tr><td>Phillips Perrone</td><td>-6.393</td><td>-3.501</td><td>-2.888</td><td>-2.578</td><td>0.0000</td></tr><tr><td>Maintenance and repair costs</td><td></td><td></td><td></td><td></td><td></td></tr><tr><td>Dickey fuller</td><td>-4.759</td><td>-3.502</td><td>-2.888</td><td>-2.578</td><td>0.0001</td></tr><tr><td>Phillips Perrone</td><td>-3.952</td><td>-3.501</td><td>-2.888</td><td>-2.578</td><td>0.4592</td></tr><tr><td>Rainfall</td><td></td><td></td><td></td><td></td><td></td></tr><tr><td>Dickey fuller</td><td>-9.819</td><td>-3.502</td><td>-2.888</td><td>-2.578</td><td>0.0000</td></tr><tr><td>Phillips Perrone</td><td>-6.687</td><td>-3.501</td><td>-2.888</td><td>-2.578</td><td>0.0000</td></tr><tr><td>Hydrology levels</td><td></td><td></td><td></td><td></td><td></td></tr><tr><td>Dickey fuller</td><td>-2.406</td><td>-4.032</td><td>-3.447</td><td>-3.147</td><td>0.3765</td></tr><tr><td>Phillips Perrone</td><td>-2.955</td><td>-3.501</td><td>-2.888</td><td>-2.578</td><td>0.000</td></tr><tr><td>Technical faults</td><td></td><td></td><td></td><td></td><td></td></tr><tr><td>Dickey fuller</td><td>-5.301</td><td>-3.502</td><td>-2.888</td><td>-2.578</td><td>0.0000</td></tr><tr><td>Phillips Perrone</td><td>-5.732</td><td>-3.502</td><td>-2.888</td><td>-2.578</td><td>0.0000</td></tr><tr><td>Failed equipment</td><td></td><td></td><td></td><td></td><td></td></tr><tr><td>Dickey fuller</td><td>-4.823</td><td>-3.502</td><td>-2.888</td><td>-2.578</td><td>0.0000</td></tr><tr><td>Phillips Perrone</td><td>-9.011</td><td>-3.501</td><td>-2.888</td><td>-2.578</td><td>0.0000</td></tr><tr><td>System overload</td><td></td><td></td><td></td><td></td><td></td></tr><tr><td>Dickey fuller</td><td>-5.610</td><td>-3.502</td><td>-2.888</td><td>-2.578</td><td>0.0000</td></tr><tr><td>Phillips Perrone</td><td>-9.520</td><td>-3.501</td><td>-2.888</td><td>-2.578</td><td>0.0000</td></tr></table>
Co-integration test results (Frequency of outages)
Table 2: Pesaran, Shin, and Smith (2001) Bounds Test for Cointegration
<table><tr><td rowspan="2" colspan="2">Statistics</td><td colspan="2">10%</td><td colspan="2">5%</td><td colspan="2">1%</td><td colspan="2">P-value</td></tr><tr><td>I(0)</td><td>I(1)</td><td>I(0)</td><td>I(1)</td><td>I(0)</td><td>I(1)</td><td>I(0)</td><td>I(0)</td></tr><tr><td>F</td><td>5.183</td><td>2.03</td><td>3.13</td><td>2.32</td><td>3.50</td><td>2.96</td><td>4.26</td><td>0.0000</td><td>0.0000</td></tr><tr><td>t</td><td>-4.878</td><td>-2.57</td><td>-4.23</td><td>-2.86</td><td>-4.57</td><td>-3.45</td><td>-5.19</td><td>0.0000</td><td>0.0000</td></tr></table>
Co-integration test results (Duration of outages)
Table 3: Pesaran, Shin, and Smith (2001) Bounds Test for Cointegration
<table><tr><td rowspan="2" colspan="2">Statistics</td><td colspan="2">10%</td><td colspan="2">5%</td><td colspan="2">1%</td><td colspan="2">P-value</td></tr><tr><td>I(0)</td><td>I(1)</td><td>I(0)</td><td>I(1)</td><td>I(0)</td><td>I(1)</td><td>I(0)</td><td>I(0)</td></tr><tr><td>F</td><td>2.899</td><td>2.03</td><td>3.13</td><td>2.32</td><td>3.50</td><td>2.96</td><td>4.26</td><td>0.0000</td><td>0.0000</td></tr><tr><td>t</td><td>-3.394</td><td>-2.57</td><td>-4.23</td><td>-2.86</td><td>-4.57</td><td>-3.45</td><td>-5.19</td><td>0.0000</td><td>0.0000</td></tr></table>
Generating HTML Viewer...
References
28 Cites in Article
K Schwab (2018). The global competitiveness report 2018.
H Alhelou,M Hamedani-Golshan,T Njenda,P Siano (2019). A survey on power system blackout and cascading events: Research motivations and challenges.
G Andersson,P Donalek,R Farmer,N Hatziargyriou,I Kamwa,P Kundur,N Martins,J Paserba,P Pourbeik,J Sanchez-Gasca,R Schulz,A Stankovic,C Taylor,V Vittal (2005). Causes of the 2003 Major Grid Blackouts in North America and Europe, and Recommended Means to Improve System Dynamic Performance.
M Borecki,M Ciuba,Y Kharchenko,Y Khanas (2020). Substation reliability evaluation in the context of the stability prediction of power grids.
Francesco Cadini,Gian Agliardi,Enrico Zio (2017). A modeling and simulation framework for the reliability/availability assessment of a power transmission grid subject to cascading failures under extreme weather conditions.
Benjamin Carreras,Jose Reynolds Barredo,Ian Dobson,David Newman (2019). Validating the OPA Cascading Blackout Model on a 19402 Bus Transmission Network with Both Mesh and Tree Structures.
R Davidson,H Liu,I Sarpong,P Sparks,D Rosowsky (2003). Electric Power Distribution System Performance in Carolina Hurricanes.
Svetlana Ekisheva,Milorad Papic,Michael Pakeltis,G Tillis,Matthew Mcclure,Daniel King (2020). Assessment of North American Transmission Outages by Fault Type.
Era (2020). Annual Report FY 2018-19.
Milena Ivanova,Rositsa Dimitrova,Anton Filipov (2020). Analysis of Power Outages and Human errors in the Operation of Equipment in Power Grids.
E Kabir,S Guikema,S Quiring (2019). Predicting Thunderstorm-Induced Power Outages to Support Utility Restoration.
Stephen Karekezi,Susan Mcdade,Brenda Boardman,John Kimani,Nora Lustig (2012). Energy, Poverty, and Development.
Vincent Katutsi,Milly Kaddu,Adella Migisha,Muhumuza Rubanda,Muyiwa Adaramola (2021). Overview of hydropower resources and development in Uganda.
Elco Koks,Raghav Pant,Scott Thacker,Jim Hall (2019). Understanding Business Disruption and Economic Losses Due to Electricity Failures and Flooding.
P Kumar,S Biswanath (2020). A Systematic Analysis of Flood Ontologies : A Parametric Approach.
A Kwasinski,W Weaver,P Chapman,P Krein (2009). Telecommunications Power Plant Damage Assessment for Hurricane Katrina– Site Survey and Follow-Up Results.
Yong Liu,Chanan Singh (2011). A Methodology for Evaluation of Hurricane Impact on Composite Power System Reliability.
Joseph Mitchell (2013). Power line failures and catastrophic wildfires under extreme weather conditions.
Milorad Papic,Sudhir Agarwal,Ron Allan,Roy Billinton,Chris Dent,Svetlana Ekisheva,Daniel Gent,Kai Jiang,Wenyuan Li,Joydeep Mitra,Andrea Pitto,Alexander Schneider,Chanan Singh,Vijay Vadlamudi,Matthew Varghese (2017). Research on Common-Mode and Dependent (CMD) Outage Events in Power Systems– A Review.
J Rentschler,M Kornejew,S Hallegatte,J Braese,M Obolensky (2019). Underutilized Potential: The Business Costs of Unreliable Infrastructure in Developing Countries. Underutilized Potential: The Business Costs of Unreliable Infrastructure in Developing Countries.
Swati Sahai,Anil Pahwa (2006). A Probabilistic Approach for Animal-Caused Outages in Overhead Distribution Systems.
W Shewhart,S Wilks (2021). System Reliability Theory.
(2017). State of Electricity Access Report 2017.
Uegcl (2020). PVH Corp..
Nadini Persaud,Ruby Dagher (2018). The United Nations: 2030 Sustainable Development Goals Agenda.
Anton Veldhuis,Matthew Leach,Aidong Yang (2017). The impact of increased decentralised generation on the reliability of an existing electricity network.
Olga Veloza,Francisco Santamaria (2016). Analysis of major blackouts from 2003 to 2015: Classification of incidents and review of main causes.
A Vinogradov,A Vinogradova,V Bolshev (2020). Analysis of the quantity and causes of outages in LV/MV electrical grids.
Explore published articles in an immersive Augmented Reality environment. Our platform converts research papers into interactive 3D books, allowing readers to view and interact with content using AR and VR compatible devices.
Your published article is automatically converted into a realistic 3D book. Flip through pages and read research papers in a more engaging and interactive format.
Our website is actively being updated, and changes may occur frequently. Please clear your browser cache if needed. For feedback or error reporting, please email [email protected]
Thank you for connecting with us. We will respond to you shortly.