This study examines the impact of inflation on unemployment in Nigeria from 1985 to 2019.In analyzing the data, nonlinear autoregressive distributive lag (NARDL) was employed. The result of the nonlinear ARDL shows that in the short-run inflation (positive) has a negative and significant effect on unemployment while inflation (negative) has a positive and significant impact on unemployment. Similarly, in the long run, inflation (positive) has a negative and significant effect on unemployment. The study concludes that there is a piece of empirical evidence for the existence of the nonlinear Phillips curve in Nigeria, within the period of the study. It is recommended that the government should reduce the positive rise in price by implementing policies that encourage production. An increase in agricultural production for example increases the level of employment which has great potential to boost food supply and reduce the level of inflation and unemployment in the economy. In addition, the study identifies the benefits and inherent potentials in natural resources in Nigeria that can be harnessed to address the problem of inflation and unemployment.
## I. INTRODUCTION
Inflation and unemployment have become a central issue to policymakers and analysts both in developed and developing countries of the world; hence, the two variables are widely acknowledged to pose one of the persistent macro-economic challenges facing the global economies. As a result, the need to achieve macroeconomic goals is imperative. In the 1930s when Keynes wrote his general theory, unemployment was the major problem in the world. Indeed, after the Second World War, inflation becomes a global economic problem. In essence, from the post-war period to late 1960s, another macroeconomic variable that becomes a major economic issue is unemployment. Besides, from the 1960 to 1970, new global phenomenon appears in form of stagflation a situation where both inflation and unemployment are higher (Jhinghan, 2011). In addition, a great contribution to the study about the connection between inflation and unemployment was made by Philips (1958) who proposed that there was a trade-off or a negative relationship between inflation and unemployment. Philip drew this conclusion using data and statistics sources from the British economy from
1861 to 1957. Along these lines, the hypothesis claims that, if inflation increases, unemployment would decrease. Such a scenario becomes an issue of great concern to policymakers. Consequently, from the 1970s, one of the key areas of debates in macroeconomic theory and policy literature is the effects of inflation on unemployment. This has prompted some economists began to question the effectiveness of the Philip curve hypothesis in general because the stagflation that existed was caused by instability in global oil price resulting in a supply shift for the global economies (Kairo, et al., 2019).
In the global context, inflation surely is not a new phenomenon, but the global inflation rate has progressively risen from $2.13\%$ in 2015 to $2.94\%$ in 2017 before it declined from $2.76\%$ to $2.32\%$ in 2018 and 2019. The decline in global inflation was due to an effective macroeconomic policy adopted by some countries of the world. In the African context, inflation wave experiences have also been different across the continent, and it has always been an issue that produces so many problems like eroding the purchasing ability of unit national currency. Inflation increases the cost of living and makes the life of individuals to become more miserable. The profile of inflation rates in Africa shows the average rate was $6.8\%$ in 2015; it declined from $10.7\%$ to $8.5\%$ in 2017 and 2019 respectively. In Nigeria, inflation has been a problem for many decades. Its persistence is always sided with many negative macroeconomics indices like unemployment, GDP growth, and interest rate. More so, the trend of inflation becomes worsening again because of the prevalence of insecurity in Nigeria ranging from insurgency, kidnapping, cattle rustling prevented lots of farmers to go back to farming. Indeed, this is associated with an increase in the inflation rate from $15.7\%$ in 2016 to $16.5\%$ in 2017, with a negative growth rate of $-0.61\%$ in 2016, as the Nigerian economy entered into a recession. In the same connection, as of 2016 and 2017, the unemployment rates thus in double-digit fall from $25.9\%$ to $18.8\%$. Subsequently, the inflation rate dropped from $12.1\%$ to $11.4\%$ in 2018 and 2019, with the corresponding unemployment rate rising from $23.1\%$ to $28.6\%$ in 2018 and 2019. Despite the prudent policy implemented, the growth rate of inflation side by side with unemployment multiplied the problem of Nigerians as many people willing to work are without jobs (World Bank, 2019).
Taken together, unemployment and inflation are issues that are central to both the social and economic life of Nigeria. The growing inflation and unemployment associated with poverty have continued to eat deeply into the growth fabric thereby causing challenges for Nigeria like raising the welfare package of the government. In more explicit form, the Nigerian economy has suffered immensely from the shackles of inflation and challenges of unemployment and it remains the major source of an economic and social problem despite the increases in growth rate declare every year. In addition, the continuous rising in prices coexists with unemployment to a large extent affects economic performance. Indeed, the two variables have been found to reduce national wealth, increase crime, and sociopolitical violence (Ademola & Badiru, 2016).
Various successive governments and regimes in Nigeria had ushered in several macroeconomic policies and programmes to achieve the desired goals of a low and stable inflation rate, reducing the growing unemployment and cartelized economic growth. Unfortunately, they failed to solve the problems of inflation and unemployment in the country. It is imperative to note that the little success recorded by these policies should serve as enduring lessons to the policymakers. This is because the pressures of the two variables have continued to be on the rise and gained more attention to economists, policymakers, and politicians than any other macroeconomic problem. After all, the sources of the inflationary trends and unemployment are many and dynamic. With the foregoing, this research work is designed to examine the nonlinear (asymmetric) impact of inflation on unemployment in the Nigerian context from 1985 to 2019, using Philip Curve as the theoretical framework to attain an even growth rate.
## II. REVIEW OF EMPIRICAL LITERATURE
Literatures reviews on the impact of inflation on unemployment that captured the asymmetries effects are as follows: Anil and Pia (2015) estimated the Phillips curve for the United State of America, using state-level data from 1982 to 2013, with the use of nonlinear model. The study found strong evidence that the wage-price Phillips curve has a negative nonlinear relationship with the unemployment rate. In the case of Jordan, Hussein and Saleh (2015) used the nonlinear ARDL to examine the relationship between the inflation rate and the unemployment rate within the Jordanian economy from 1976 to 2013. In the findings of the study, there was a negative and nonlinear relationship between inflation and unemployment. Similarly, Bildirici and Özaksoy (2016) used the nonlinear ARDL approach and the nonlinear Granger causality method to analyze Post-Keynesian Phillips Curve for the period from 1957 to 2015 in Canada. The results show there is a long-run negative asymmetric relationship between inflation and unemployment. In the case of Nigeria, Iyeli and Edame (2017) determined if there is an asymmetry relationship between price expectation and unemployment from 1970 to 2011. The result obtained revealed a positive nonlinear relationship between inflation and unemployment in Nigeria. In support of the above result, N'Guessan (2018) adopted the nonlinear Engel-Granger cointegration technique to test the relationship between the price level and employment in Côte d'Ivoire from 1960 to 2014. However, a positive nonlinear relationship exists between inflation and unemployment. Meanwhile, Malik and Mansur (2018) re-examined the relationship between inflation and unemployment in Nigeria from 1991 to 2017. It applied the Nonlinear ARDL approaches. The study confirms the presence of a nonlinear negative relationship between inflation and unemployment in Nigeria. In the African context, Nkoba and Masih (2018) re-examined the long-run relationship that exists between inflation and unemployment in Tanzania from 1991 to 2017. The study adopts the nonlinear autoregressive distributive lag (NARDL). The results show that there is an asymmetrical short-run negative relationship between inflation and unemployment. Annalisa and Piero (2021) examined the nonlinear impact of inflation on unemployment in the USA from 1961 Q1 to 2019 Q4. The study found a nonlinear negative and significant impact between inflation and unemployment. Moreover, Ait, et al. (2021) examined if inflation has nonlinear effects on unemployment in the OECD. The study used quarterly data from 1948Q1 to 2019Q4. The result shows, there is a positive nonlinear relationship between anticipated inflation and unemployment. Recently, Binh and Hector (2021) investigated the asymmetrical relationship between inflation and unemployment with the use of monthly data from 1991Q1 to 2019Q4. The findings show a positive nonlinear relationship between CPI and unemployment.
### a) Gap in the Literature
The review of empirical literature shows that there is an inconclusive result on the relationship between inflation and unemployment. This is because some studies have shown either a negative or positive nonlinear relationship exists between unemployment and Inflation. The existing literature that finds evidence of the asymmetric negative impact of inflation on unemployment include Annalisa and Piero (2021), Nkoba and Masih (2018), Malik and Mansur (2018), Bildirici and Ozaksoy (2016), Anil and Pia (2015) and Hussein and Saleh (2015). On the other hand, those studies that claim that inflation has an asymmetric positive impact on unemployment are those by Ait, et al. (2021), Binh and Hector (2021), N'Guessan (2018), and Iyeli and Edame (2017).
Specifically, after the in-depth review of the previously asymmetric studies on the impact of inflation on unemployment, across the countries of the world, it shows that studies focusing on the nonlinear relationship between inflation and unemployment in Nigeria are limited. Therefore, the shortcoming identified is that studies such as Anil and Pa (2015), Bldiric and Ogzakoas (2016), N'Guessan (2018), Iyeli and Edame (2017), has been criticized for they do not capture the 2016-2017 economic recessions and 2019 Covid-19 induced economic recession that occurred in Nigeria and other economies.
To extend the frontiers of knowledge and to fill this gap in this study area, this study differs from previous studies as it introduces foreign direct investment as one of the control variables based on the premise that the inflow of foreign direct investment would result in lower unemployment. Included in the model also is the real interest rate because the monetary authority makes use of interest rate as a tool to influence economic activities. Also, the study adopted the Nonlinear ARDL approach to capture possible asymmetry in both the long-run and short-run. This is because Baldric and Turkmen (2015) pointed out that asymmetric models have more explanatory power than linear models. In addition, the NARDL framework developed by Shin, Yu, and Greenwood (2014) is an extension of the Autoregressive Distributed Lag (ARDL) approach propounded by Pesaran and Shin (1999) and Pesaran et al. (2001). In the case of the Nigerian economy, this study contributes to the macroeconomic literature in general by considering asymmetries between inflation and unemployment.
### b) Theoretical Literature
The theoretical framework on the impact of inflation on unemployment in Nigeria is the Philip curve hypothesis. This theory is adopted because it is considered the best framework that links the variables and it is significant to the study. The Philips curve theory was developed by Philips (1958) using empirical data from the United Kingdom. The Philips curve theory postulates that there is an inverse relationship between inflation and unemployment. The argument is that whenever there is inflation in a country, economic activities increases, because producers may be willing to produce more output to make higher revenue and consequently higher profit. For the producers to produce additional output they must employ additional workers on the existing number, and hence the level of unemployment will fall. On the other hand, the flatter the curve, the higher will be the fall in unemployment that will be attained by a small increase in the rate of inflation. The trade-off relationship implied by the Philips curve meant that policymakers could determine the opportunity cost of a lowered inflation rate in terms of the employment forgone. It was their task therefore to optimize this trade-off relationship by selecting the inflation-unemployment-combination that maximized social benefit or minimized social cost. Besides, in the early 1970s, the first empirical failure of the Philip curve occurred when both inflation and unemployment increased simultaneously, primarily due to oil-price shocks. The Philip curve concluded based on the above arguments that the relationship between the rate of unemployment and change of money wage would be highly nonlinear when shown on a diagram. As a result, the Philip curve is regaining interest after a period of neglect and there has been considerable theoretical work suggesting a nonlinear relationship between inflation and unemployment (Jhingan, 1997).
## III. METHODOLOGY
### a) Data and its Sources
This study employed secondary data spanning from 1985 to 2019. As expected, the annual time series data on the unemployment rate, real GDP, and interest rate were drawn from Nigeria's Central Bank statistical bulletin (2019) while the inflation rate and foreign direct investment are sourced from the World Bank report (2019). In this study, this time frame was chosen to capture the independent impact of both positive and negative changes in inflation on unemployment.
### b) Model Specification
To facilitate the analysis of data in this study, the dependent variable is the unemployment rate while the explanatory variable is the inflation rate. As well, the control variables are real GDP, foreign direct investment, and interest rate. Therefore, the nonlinear model for this study is expressed as follows:
$$
\mathrm{UR}_{t} = \beta_{0} + \beta_{1} \mathrm{INFR}_{t}^{+} + \beta_{2} \mathrm{INFR}_{t}^{-} + \beta_{3} \mathrm{RGDP}_{t}^{+} +
$$
$$
\beta_{4} \mathrm{RGDP}_{t}^{-} + \beta_{5} \mathrm{FDI}_{t}^{+} + \beta_{6} \mathrm{FDI}_{t}^{-} + \beta_{7} \mathrm{INTR}_{t}^{+} +
$$
$$
\beta_ {8} \operatorname{INTR} _ {t} ^ {-} + \quad \mu_ {\mathrm{t}} \dots \tag{1}
$$
Where UR= Unemployment rate
$$
\operatorname{INFR} _ {t} ^ {+} = \text{Positiveinflation}
$$
$$
\operatorname{INFR} _ {t} ^ {-} = \text{Negativeinflation}
$$
$$
\mathrm{R G D P} _ {t} ^ {+} = \text{PositiveRealGDP}
$$
$$
\mathrm{R G D P} _ {t} ^ {-} = \text{NegativeRealGDP}
$$
$$
\mathrm{F D I} _ {t} ^ {+} = \text{Positiveforgind}
$$
$$
\mathrm{F D I} _ {t} ^ {-} = \text{Negativeforgindrectinvestments}
$$
$$
\mathrm{I N T R} _ {t} ^ {+} = \text{Positiveinterstrate}
$$
$$
\mathrm{I N T R} _ {t} ^ {-} = \text{Negativeinterstrate}
$$
$$
\text{The} \mu = \text{Stochasticdistrubancetermorerrorterm}.
$$
The $t =$ Time as well as $\beta_0 =$ Constant or the intercept depicting the unemployment rate when the independent variables are equal to zero.
### c) Model Estimation Procedures
In the pre-estimation evaluation of the data, the Augmented Dickey-Fuller (1982), Phillips-Perron (1988), and the Kwiatkowski, Phillips, Schmidt, & Shin (1992) unit root tests are carried out. In addition, the study also conducted the Kapetanios, Shin, & Snell (2003) nonlinear unit root test to compare the results for consistency. This study employs the nonlinear ARDL proposed by Shin, Yu, and Greenwood-Nimmo (2014). The NARDL allows capturing both the short-run and
long-run asymmetries in the transmission mechanism. The NARDL method allows for possible increases and decreases in inflation, real GDP, foreign direct investment, and interest rate to affect unemployment differently. The study decomposes inflation, real GDP, foreign direct investment, and interest rate into positive and negative partial sums as specified as follows.
$$
\begin{array}{l} U R _ {t} = \beta_ {0} + \beta_ {1} I N F R _ {t} ^ {+} + \beta_ {2} I N F R _ {t} ^ {-} + \beta_ {3} R G D P _ {t} ^ {+} + \beta_ {4} R G D P _ {t} ^ {-} + \beta_ {5} F D I _ {t} ^ {+} + \beta_ {6} F D I _ {t} ^ {-} + \beta_ {7} I N T R _ {t} ^ {+} \\+ \beta_ {8} I N T R _ {t} ^ {-} + \sum_ {i = 1} ^ {p} \phi_ {1} \Delta I n \left( \right.U R _ {t - 1} + \sum_ {i = 1} ^ {q} \phi_ {2} \Delta I n \left(I N F R _ {t} ^ {+} \right. _ {t - 1} + \sum_ {i = 1} ^ {q} \phi_ {3} \Delta I n \left(I N F R _ {t} ^ {-} \right. _ {t - 1} + \sum_ {i = 1} ^ {r} \phi_ {4} \Delta I n \left(R G D P _ {t} ^ {+} \right. _ {t - 1} \\+ \sum_ {i = 1} ^ {r} \phi_ {5} \Delta I n \left(R G D P _ {t} ^ {-} \right. _ {t - 1} + \sum_ {i = 1} ^ {q} \phi_ {6} \Delta I n \left(F D I _ {t} ^ {+} \right. _ {t - 1} + \sum_ {i = 1} ^ {r} \phi_ {6} \Delta I n \left(F D I _ {t} ^ {+} \right. _ {t - 1} + \sum_ {i = 1} ^ {r} \phi_ {7} \Delta I n \left(F D I _ {t} ^ {-} \right. _ {t - 1} \\+ \sum_ {i = 1} ^ {q} \phi_ {8} \Delta I n \left(I N T R _ {t} ^ {+} {} _ {t - 1} + \sum_ {i = 1} ^ {q} \phi_ {8} \Delta I n \left(I N T R _ {t} ^ {-} {} _ {t - 1} + \varepsilon_ {t} \dots \right. \dots \dots \dots \dots \dots \dots \dots \dots \dots \dots \dots \dots \dots \dots \dots \dots \dots \dots \dots \dots \dots \dots \dots \dots \dots \dots \dots \dots \dots \dots \dots \dots \dots \dots \dots \dots \dots \dots \dots \dots \dots \dots \dots \dots \dots \dots \dots .\right) \\\end{array}
$$
In equation 2all the variables as defined in $p, q, r$, and $s$ are lag orders of the variables in the model. $B_1$ to $\beta_8$ denote the long run impacts of the positive and negative changes in inflation, real GDP, foreign direct investment, and interest rate on the unemployment rate.
Also, the $\sum_{i=1}^{q} \emptyset_{2}$ to $\sum_{i=1}^{r} \emptyset_{8}$ measures the short run impact of increase and decrease in inflation, real GDP, foreign direct investment and interest rate on unemployment rate respectively.
## IV. RESULT AND DISCUSSION
### a) Descriptive Statistics
Table 4.1: Results of Descriptive Statistics
<table><tr><td>Statistics</td><td>LUNR</td><td>LINFR</td><td>LRGDP</td><td>LFDI</td><td>LINTR</td></tr><tr><td>Mean</td><td>2.3447</td><td>2.6682</td><td>17.2569</td><td>0.3180</td><td>2.6026</td></tr><tr><td>Median</td><td>2.5416</td><td>2.5029</td><td>17.1132</td><td>0.3718</td><td>2.6391</td></tr><tr><td>Maximum</td><td>3.3534</td><td>4.2882</td><td>18.0640</td><td>1.7563</td><td>3.2581</td></tr><tr><td>Minimum</td><td>-.0.1165</td><td>1.6842</td><td>16.5205</td><td>-1.0426</td><td>1.5041</td></tr><tr><td>Std. Dev.</td><td>0.7863</td><td>0.7163</td><td>0.5381</td><td>0.6481</td><td>0.3768</td></tr><tr><td>Skewness</td><td>-0.8639</td><td>0.9359</td><td>0.2476</td><td>0.1825</td><td>-1.2308</td></tr><tr><td>Kurtosis</td><td>3.6973</td><td>2.8442</td><td>1.5445</td><td>2.6937</td><td>4.3706</td></tr><tr><td>Jarque-Bera</td><td>5.0630</td><td>5.1444</td><td>3.3486</td><td>0.3311</td><td>-1.2308</td></tr><tr><td>Probability</td><td>0.0795</td><td>0.0763</td><td>0.1874</td><td>0.8474</td><td>0.0031</td></tr><tr><td>Sum</td><td>82.0652</td><td>93.3860</td><td>586.7354</td><td>11.1311</td><td>91.0905</td></tr><tr><td>Sum Sq. Dev,</td><td>21.0226</td><td>17.4428</td><td>9.5554</td><td>14.2824</td><td>4.8271</td></tr><tr><td>Observations</td><td>35</td><td>35</td><td>34</td><td>35</td><td>35</td></tr></table>
Table 4.1 provides the descriptive statistics of the variables. The link between standard deviation and mean values explain the extent to which mean represents the actual dataset. The average growth rate of the unemployment rate is $2.34\%$. Inflation rate is $2.67\%$, Real GDP is $17.26\%$, foreign direct investment is $0.32\%$ and interest rate is $2.60\%$. In this case, a variable such as Real GDP appears to have significantly spread out from its average values. It implies it is unstable and somewhat volatile. Other variables like the unemployment rate, inflation rate, foreign direct investment and interest rate in the study are relatively stable and less volatile as their data appear to have somewhat clustered around their respective mean values.
The coefficients of Kurtosis indicate that the kurtosis is 3 or close to 3. The coefficients of skewness also support that the data are not symmetrically distributed. It rather shows properties of clear asymmetries in the data distribution. The data do not follow a typical bell shape. They are either skewed left or right. Indeed, the distributions are not symmetrical. Similarly, the Jarque-bera statistics reveal that unemployment rate was 0.079, inflation rate was 0.076 and interest rate was 0.003 which are not normally distributed while the Jarque-bera probability values for real GDP was 0.187 and foreign direct investment was 0.847 which are normally distributed. The data, therefore, portray elements of asymmetric distribution in their data spreading which call for the application of nonlinear ARDL methods in analyzing the relationship between inflation and unemployment in this study.
### b) Unit Root Test Results
This study used three popular linear unit root tests such as Augmented Dickey-Fuller (ADF), Phillip Peron (PP) tests, and Kwiatkowski, Philip, Schmidt, and
Shins Test (KPSS). In line with the methodology of the study, it will not be intellectually sound to rely solely on linear unit root tests when there is evidence of nonlinearity and asymmetries in the variables. Therefore, the study employs Kapetanios, Shin, and Snell (2003) unit root test to account for nonlinearity and asymmetries in an attempt to ensure the robustness of the results of unit root tests. The unit root results are presented as follows:
Table 4.2: Unit Root Tests
<table><tr><td colspan="3">ADF</td><td colspan="2">PP</td><td colspan="2">KPSS</td></tr><tr><td colspan="7">Level</td></tr><tr><td>Variables</td><td>Constant</td><td>Constant With Trend</td><td>Constant</td><td>Constant With Trend</td><td>Constant</td><td>Constant With Trend</td></tr><tr><td>LUR</td><td>-3.4353</td><td>-3.1502</td><td>-3.4181</td><td>-5.7045</td><td>0.7642*</td><td>0.0679*</td></tr><tr><td>LINFR</td><td>-1.9605</td><td>-2.4292</td><td>-2.9351</td><td>-3.0172</td><td>0.2876*</td><td>0.1237*</td></tr><tr><td>LRGDP</td><td>-0.2706</td><td>-1.9418</td><td>0.0480</td><td>-1.7614</td><td>0.6688</td><td>0.1439</td></tr><tr><td>LFDI</td><td>-3.6575*</td><td>-3.6439*</td><td>-3.3725*</td><td>-3.5659*</td><td>0.1350*</td><td>0.1299***</td></tr><tr><td>LINTR</td><td>1.7992</td><td>1.0271</td><td>-0.5641</td><td>-1.6812</td><td>0.3775*</td><td>0.1860*</td></tr><tr><td colspan="7">First Differences</td></tr><tr><td>LUR</td><td>-11.6587*</td><td>-11.2385*</td><td>-11.7240*</td><td>-11.3340*</td><td>0.1843</td><td>0.8999</td></tr><tr><td>LINFR</td><td>-2.8726***</td><td>-2.7873***</td><td>-6.5621*</td><td>-6.0827*</td><td>0.4446</td><td>0.4540</td></tr><tr><td>LRGDP</td><td>-2.9340***</td><td>-2.8307***</td><td>-2.9586**</td><td>-2.8513**</td><td>0.1612*</td><td>0.1337*</td></tr><tr><td>LFDI</td><td>-4.4619</td><td>-4.3884</td><td>-9.3548</td><td>-11.0618</td><td>0.3677</td><td>0.5000</td></tr><tr><td>LINTR</td><td>-6.5387*</td><td>-7.3156*</td><td>-6.5387*</td><td>-9.3470*</td><td>0.3192</td><td>0.1446</td></tr></table>
Table 4.2 show the results of the unit root test using a traditional method of ADF, PP, and KPSS where foreign direct investment is stationary at levels 1(0) while the unemployment rate, inflation rate, real gross domestic product, and interest rate are stationary at their first difference 1(1). The KPSS test result report that inflation, foreign direct investment and interest rate are integrated at level 1(0) while real GDP is integrated at its first difference $\mathrm{I}(1)$. Also, the Kwiatkowski et al. (1992) argue that their test is intended to complement unit root tests, such as the ADF and PP which suffer from the problem of low power and size distortion. Testing the unit root with three frameworks helps the researcher to compare the results for consistency.
Table 4.3: KSS Nonlinear Unit Root Tests (Nonlinear ESTAR Models)
<table><tr><td>Variables</td><td>Level 1(0)</td><td>First Difference 1(1)</td></tr><tr><td>UNR</td><td>-0.635</td><td>-3.866**</td></tr><tr><td>INF</td><td>-3.072*</td><td>-1.905</td></tr><tr><td>RGDP</td><td>-2.250</td><td>--2.768**</td></tr><tr><td>FDI</td><td>-9.299*</td><td>0.095</td></tr><tr><td>INTR</td><td>-0.016</td><td>-3.316**</td></tr></table>
Table 4.3 displays the results of the KSS nonlinear unit root. These tests are within the framework of a globally stationary exponential smooth transition autoregressive (ESTAR) process based on a nonlinear model. The results of KSS tests reveal that inflation and foreign direct investments are integrated at level 1(0) while unemployment real GDP and interest rate are integrated at the first difference I (1). It is important to note that the optimal lag length of the results of KSS reported in Table 4.3 is premised on the Schwarz information criterion (SIC). Another lag length criterion is important but for sake of consistency, SIC is chosen. Therefore, the study then proceeds to carry out the nonlinear Auto Regressive Distribution Lag (NARDL) bound test.
### c) Cointegration Test
The idea of cointegration is important in economic theory because it is used to determine whether there is a long-run relationship among the variables (e.g. unemployment rate, inflation rate, real gross domestic product, foreign direct investment, and interest rate). The results of bound testing for asymmetric cointegration are reported in Table 4.4.
Table 4.4: Bound Test for Nonlinear Cointegration Test
<table><tr><td>F-statistic</td><td>7.0182</td><td>5</td></tr><tr><td>Level of significance</td><td>The critical value 1(0) Bound</td><td>The critical value 1(1) Bound</td></tr><tr><td>10%</td><td>2.08</td><td>3.00</td></tr><tr><td>5%</td><td>2.39</td><td>3.38</td></tr><tr><td>1%</td><td>3.06</td><td>4.15</td></tr></table>
The results of the nonlinear cointegration test in Table 4.4 reveal that the F-statistic value of 7.0182 exceeds the upper bound and lower bound values at a $1\%$ level of significances. The null hypothesis of no cointegration is rejected. As supported by the results of theNARDL bound tests there is evidence that the inflation rate has a nonlinear long run relationship with the unemployment rate over the study period.
### d) Estimated Short run Coefficients
Table 4.6: Nonlinear Short-run Coefficients- Dependent Variable is LUNR
<table><tr><td>Variable</td><td>Coefficient</td><td>Std. Error</td><td>t-Statistic</td><td>Prob.</td></tr><tr><td>DLNINFL_POS</td><td>-0.7647</td><td>0.1464</td><td>-5.2237</td><td>0.0000</td></tr><tr><td>DLNINFL_NEG(-1)</td><td>0.6620</td><td>0.1111</td><td>-5.9547</td><td>0.0784</td></tr><tr><td>DLNRGDP</td><td>0.4935</td><td>0.2660</td><td>1.8553</td><td>0.0784</td></tr><tr><td>DLNFDI (-1)</td><td>0.1919</td><td>0.1059</td><td>1.8126</td><td>0.0849</td></tr><tr><td>D(NINTR)</td><td>-0.3801</td><td>0.1546</td><td>-2.4608</td><td>0.0231</td></tr><tr><td>C</td><td>-4.4403</td><td>4.2916</td><td>-2.4608</td><td>0.0231</td></tr><tr><td>CointEq(-1)</td><td>-0.7938</td><td>0.0993</td><td>-7.9916</td><td>0.0000</td></tr></table>
In Table 4.6 the results of the nonlinear short run coefficients tend to show that inflation (positive) has a negative and significant effect on unemployment at a $1\%$ level of significance. It indicates that an increase in positive inflation rate by $1\%$ would reduce unemployment by roughly $76\%$ while inflation (negative) has a positive and significant impact on unemployment at a $10\%$ level of significance. This implies that an increase in negative inflation rate by $1\%$ would increase unemployment by roughly $66\%$. Real GDP has a positive and significant effect on unemployment at a $10\%$ level of significance. It implies that an increase in real GDP by $1\%$ would increase unemployment by roughly $49\%$. Also, foreign direct investment has a positive and significant effect on unemployment at a $10\%$ level of significance. This shows that an increase in foreign direct investment by $1\%$ would increase unemployment by roughly $19\%$. The interest rate has a negative and significant effect on unemployment at a $5\%$ level of significance. It also shows that an increase in interest rate by $1\%$ would decrease unemployment by roughly $38\%$. As expected, the short-run error correction term for the model ECM (-1), has a coefficient value (-0.7938) with a negative sign, less than one, and is statistically significant at a $1\%$ level of significances. Again, the speed of adjustment for correcting disequilibrium from the previous year to equilibrium in the current year is $79\%$ respectively. This supports the previous confirmation of a long-term cointegration.
### e) Estimated Long run Coefficients
Table 4.7: Nonlinear Long run Coefficients- Dependent Variable is LUNR
<table><tr><td>Variable</td><td>Coefficient</td><td>Std. Error</td><td>t-Statistic</td><td>Prob.</td></tr><tr><td>LNINFL_POS</td><td>-0.5471</td><td>0.1639</td><td>-3.3378</td><td>0.0033</td></tr><tr><td>LNINFL_POS(-1)</td><td>-0.2174</td><td>0.1094</td><td>-1.9882</td><td>0.0606</td></tr><tr><td>LNINFL_NEG</td><td>-0.1492</td><td>0.1063</td><td>-1.4046</td><td>0.1755</td></tr><tr><td>LNINFL_NEG(-1)</td><td>0.0578</td><td>0.1220</td><td>0.4737</td><td>0.6409</td></tr><tr><td>LNRGDP_POS</td><td>-1.5148</td><td>1.5499</td><td>-0.9773</td><td>0.3421</td></tr><tr><td>LNRGDP_NEG</td><td>15.0901</td><td>15.3935</td><td>0.9803</td><td>0.3507</td></tr><tr><td>LNFDI_POS</td><td>0.2905</td><td>0.1031</td><td>2.8167</td><td>0.0103</td></tr><tr><td>LNFDI_NEG</td><td>-0.0968</td><td>0.1074</td><td>-0.9005</td><td>0.3780</td></tr><tr><td>LNINTR_POS</td><td>-1.2527</td><td>0.3749</td><td>-3.3412</td><td>0.0034</td></tr><tr><td>LNINTR_NEG</td><td>-0.0723</td><td>0.1997</td><td>-0.3621</td><td>0.7213</td></tr></table>
Similarly, Table 4.7 displays the results of the long run coefficients which show that inflation (positive) has a negative and significant effect on unemployment at a $5\%$ level of significance. Also, indicate that an increase in inflation (positive) by $1\%$ would reduce unemployment by roughly $55\%$. Foreign direct investment (positive) has a positive and significant effect on unemployment at a $5\%$ level of significance. This shows that an increase in foreign direct investment (positive) by $1\%$ would reduce unemployment by roughly $29\%$ respectively. Interest rate (positive) has a negative and significant effect on unemployment at a $5\%$ level of significance. Also, indicate that an increase in interest rate (positive) by $1\%$ would reduce unemployment by roughly $125\%$ in Nigeria during the study period.
### f) Post.-Estimation Tests
In this research stage, the adequacy of the nonlinear ARDL is also verified by using different diagnostic tests. The results are presented as follows.
Table 4.8: Nonlinear Normality Test
<table><tr><td>Statistic</td><td>Value</td></tr><tr><td>Skewness</td><td>0.2423</td></tr><tr><td>Kurtosis</td><td>2.2717</td></tr><tr><td>Jarque-Bera</td><td>1.0204</td></tr><tr><td>Probability</td><td>0.6004</td></tr></table>
The results of the normality test in Table 4.8, show that the Skewness is 0.2423, kurtosis 2.2717 and the Jargue-bera probability value is 1.0204 (0.6004). This implies that the conditions for normality are all met because the Skewness is positively skewed and less than one, kurtosis is close to 3, while Jarque-bera probability is not significant at any significances level. Therefore, the data is normally distributed.
Table 4.9: Nonlinear Autocorrelation Test Results
<table><tr><td>F-statistic</td><td>0.3427</td><td>Prob. F(2,17)</td><td>0.7146</td></tr><tr><td>Obs*R-squared</td><td>1.2402</td><td>Prob.Chi-Square(2)</td><td>0.5379</td></tr></table>
From Table 4.9, the Breusch-Godfrey serial correlation LM test result indicates the p-value statistics of 0.7146 is not significant at any level. Therefore, after conducting the unit root test and test for autocorrelation the Durbin-Watson (DW) statistics (1.64) is very high and are up to the conventional point 2. The variables are also not significant at a $5\%$ level of significances. We conclude that the model is free from autocorrelation problem.
Table 4.10: Nonlinear Heteroskedasticity Test Results
<table><tr><td>F-statistic</td><td>0.9265</td><td>Prob. F(11,20)</td><td>0.5355</td></tr><tr><td>Obs*R-squared</td><td>10.8021</td><td>Prob. Chi-Square(11)</td><td>0.4600</td></tr></table>
In Table 4.10 the result of tests for Breusch-Pagan-Godfrey Heteroskedasticity conducted reveals that the p-value 0.5355 is not statistically significant at any level which implies the absence of Heteroskedasticity problem. Consequently, the model is reliable for decision-making and forecasting.
Table 4.11: Nonlinear Ramsey RESET
<table><tr><td>Statistic</td><td>Value</td><td>Df</td><td>Probability</td></tr><tr><td>t-statistic</td><td>0.7390</td><td>19</td><td>0.4689</td></tr><tr><td>F-statistic</td><td>0.5461</td><td>(1,19)</td><td>0.4689</td></tr></table>
The results of the Ramsey (1969) Reset test of Misspecification in Table 4.11 indicate the computed F-statistic and p-value is 0.7390 (0.4689). As expected this test result is considered meaningful because the p-values are not significant at any significances level and it implies that the residuals in the models are free from any diagnostic problems. These results also reveal that there is a shred of evidence that the variables are stable and can be considered for predictions and other economic inferences.
### g) Stability Test Results
The research study makes use of nonlinear Cumulative Sum of recursive residuals (CUSUM) developed by Brown, Dublin, and Evans (1975) in testing the stability of the parameters of NARDL model within a $5\%$ level of significance. The results of the CUSUM and CUSUM Square test with the unemployment rate as the dependent variable and the explanatory variables such as inflation rate, real GDP, foreign direct investment, and interest rates are shown in Figure 4.3 and 4.4.
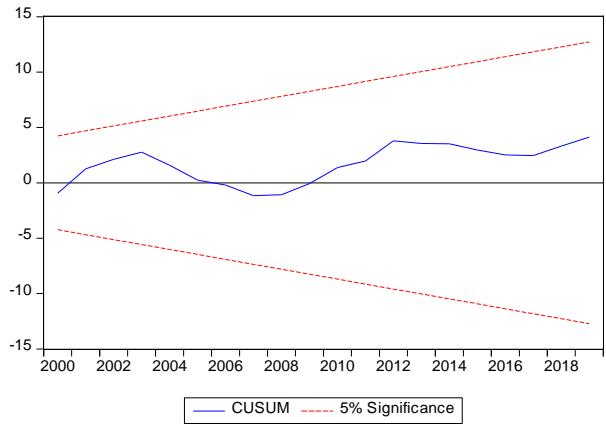
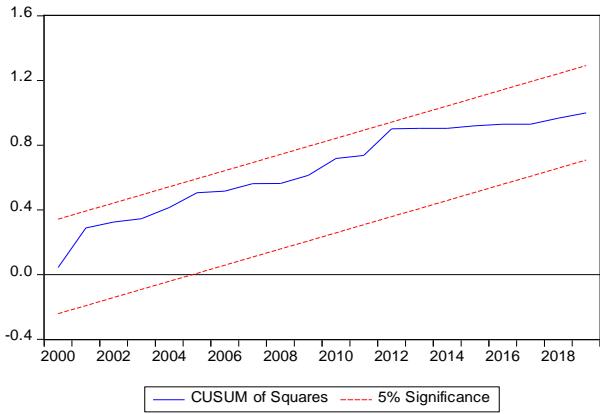 Source: Researcher's computations using E-Views 9 (2021). Figure 4.3: Nonlinear CUSUM plot of stability and CUSUM Square plot of stability In figure 4.3, the results of the CUSUM plot for the stability of the model show the CUSUM test is within $5\%$ level of significance. There are no chances of having spurious regression because the blue line is in-between the two red lines. The figure further shows that all the variables passed the CUSUM test. This implies that all the variables used are stationary and the model is stable. The results nonlinear CUSUM of Square test is within $5\%$ level of significance. The plot further shows there are no chances of having spurious regression since the blue line is in-between the two red lines. The decision rule is, all the coefficients of the error terms $\mathbf{e}_t$ in the regression estimates are normally distributed. This also implies variance stability and reliability of the model and parameters over the study period. Also, CUSUM and CUSUM squares tests show that the models are stable and can be used for policy formulation.
### h) Causality Test Results
The study employed the Toda and Yamamoto (1995) to uncover the direction of causal relationship between inflation and unemployment in Nigeria from 1985 to 2019. The preliminary test carried out indicates the conditions for the T.Y causality test are satisfied. The test include the lag selection test (the initial lag chosen is 4 and the lag used for the TY is consequently 5), stability (the inverse root of AR, and the Roots of Characteristic Polynomial), heteroskedasticity, and autocorrelation. All of them are satisfied from the results.
Table 4.12: TY Causality Test
<table><tr><td>Causality</td><td>Chi-sq</td><td>df</td><td>Prob.</td></tr><tr><td>UNR does not Granger cause INFL</td><td>10.9744</td><td>4</td><td>0.0269**</td></tr><tr><td>INFL does not Granger cause UNR</td><td>41.2143</td><td>4</td><td>0.0000*</td></tr><tr><td>INTR does not Granger cause UNR</td><td>46.6836</td><td>4</td><td>0.0000*</td></tr><tr><td>RGDP does not Granger cause UNR</td><td>40.6358</td><td>4</td><td>0.0000*</td></tr><tr><td>FDI does not Granger cause UNR</td><td>10.5098</td><td>4</td><td>0.0327**</td></tr><tr><td colspan="4">* and ** represent 1% and 5% level of significance.</td></tr></table>
The results of the causality tests are presented in Table 4.12. The first null hypothesis is that the unemployment rate does not granger cause inflation rate and inflation rate does not granger cause unemployment rate. Thus, as shown by the significance of the $\rho$ -values (0.0269) the null hypothesis of no causality between the variables is rejected because bidirectional causality exists between unemployment rate and inflation rate. Furthermore, the findings revealed a unidirectional causality between interest rate and unemployment rate, real GDP and unemployment rate, foreign direct investment and unemployment rate during the study period. The implication of the causality results is that unemployment can be easily predicted given the information on all the regressors employed over the study period.
## V. CONCLUSION
In this study, the impact of inflation on unemployment is examined, using the Philips curve hypothesis as the theoretical framework over the period 1985-2019. The study employed the nonlinear ARDL technique to analysis the tradeoff that exists between the variables. As rightly found by the Nonlinear ARDL results, in the short run, inflation (positive) has a negative and significant effect on unemployment while inflation (negative) has a positive and significant impact on unemployment. Similarly, in the long run inflation (positive) has a negative and significant effect on unemployment. The study concludes that there is trade-off between inflation and unemployment in Nigeria which is consistent with the findings of the empirical studies Annalisa and Piero (2021), Nkoba and Masih (2018), Malik and Mansur (2018), Bildirici and Özaksoy (2016), Anil and Pia (2015) and Hussein and Salah (2015). The important policy implication of this result is that it shows the extent to which monetary and fiscal measures can be applied as a means of controlling inflation without high levels of unemployment in Nigeria. Therefore, the fight against these two macroeconomic problems in
Nigeria should take a steady and holistic approach. As a result, the need for an economic approach and solution is imperative.
Based on the results of the study, the following recommendations are made:
The government should adopt prudent policy measures to deal with the factors identified as sources of inflation like the high cost of transport, exchange rates instability, persistent increase in the supply of money, inadequate electricity supply, and insecurity, among others. Government should give emphasize on the creation of vocational centers where the unemployed people can be trained on different kinds of trade after which low-interest loans should be given to them to become self-employed in the country to reduce unemployment rate.
Generating HTML Viewer...
References
24 Cites in Article
A Ademola,A Badiru (2016). The impact of unemployment and inflation on economic growth in Nigeria.
L Ait,M Garth,B Stanislav,R Hugo,V (2021). Nonlinear unemployment effects of the Inflation Tax.
Anil Kumar,Pia Orrenius (2015). A Closer Look at the Phillips Curve Using State Level Data.
C Annalisa,F Piero (2021). Nonlinear models of the Phillips curve.
Melike Bildirici,Fulya Özaksoy (2016). Non-Linear Analysis of Post Keynesian Phillips Curve in Canada Labor Market.
T Binh,S Hector (2021). Cross-Country connectedness in inflation and unemployment: Measurement and Macroeconomic Consequences.
R Brown,J Durbin,J Evans (1975). Techniques for Testing the Constancy of Regression Relationships Over Time.
D Dickey,W Fuller (1981). Likelihood ratio statistics for autoregressive time series with a unit root.
I Iyeli,G E Edame (2017). Investigating Tunneling from Nigerian non-finance Listed Companies.
Carlos Jarque,Anil Bera (1987). A Test for Normality of Observations and Regression Residuals.
M Jhingan (1997). Advanced Economic Theory.
M Jhingan (2011). Monetary economics.
A Hussein,A Salah (2015). Does Phillips curve really exist? AnEmpirical evidence from Jordan.
C Kairo,R Solomon,D Bitrus (2019). The Philip curve theory and the Nigeria Economy.
George Kapetanios,Yongcheol Shin,Andy Snell (2003). Testing for a unit root in the nonlinear STAR framework.
D Kwiatkowski,P Phillips,P Schmidt,Y Shin (1992). Testing the null hypothesis of stationary against the alternative of unit root.
A Malik,M Mansur (2018). Revisiting the Phillips curve trade-off: Evidence from Tanzania using nonlinear ARDL approach.
E Melike,B Fulya,O (2018). Backward bending structure of Phillips curve in Japan, France.
Coffie N'guessan (2018). Non linear equilibrium relationship between inflation and employment: evidence from Côte D ivoire.
M Nkoba,M Masih (2018). Revisiting the Phillips curve trade-off: Evidence from Tanzania using nonlinear ARDL approach.
A Philips (1958). The Relation Between Unemployment and the Rate of Change of Money Wage Rates in the United Kingdom, 1861–1957<sup>1</sup>.
Peter Phillips,Pierre Perron (1998). Testing for a unit root in time series regression.
J Ramsey (1969). Tests for Specification Errors in Classical Linear Least-Squares Regression Analysis.
Yongcheol Shin,Byungchul Yu,Matthew Greenwood-Nimmo (2014). Modelling Asymmetric Cointegration and Dynamic Multipliers in a Nonlinear ARDL Framework.
No ethics committee approval was required for this article type.
Data Availability
Not applicable for this article.
How to Cite This Article
Felix Emmanuel Dodo. 2026. \u201cImpact of Inflation on Unemployment in Nigeria (1985-2019): A Non-Linear Approach\u201d. Global Journal of Management and Business Research - C: Finance GJMBR-C Volume 22 (GJMBR Volume 22 Issue C2).
Explore published articles in an immersive Augmented Reality environment. Our platform converts research papers into interactive 3D books, allowing readers to view and interact with content using AR and VR compatible devices.
Your published article is automatically converted into a realistic 3D book. Flip through pages and read research papers in a more engaging and interactive format.
Our website is actively being updated, and changes may occur frequently. Please clear your browser cache if needed. For feedback or error reporting, please email [email protected]
Thank you for connecting with us. We will respond to you shortly.