The; Internet is currently being utilized to enable faster business activities among businesses and consumers for various goods and services. However; Online Grocery Shopping (OGS) is not popular in Sri Lanka. But; nowadays, people will struggle to go to shops physically during this Covid-19 pandemic. Therefore; many customers have turned to online platforms to meet their needs. This; study investigates a significant impact on the dependent variable is customer loyalty, and independent variables are customer satisfaction, customer confidence, customer trust, and technology adoption, and age; as a moderator in the COVID-19 period. The; Technology Acceptance Model (TAM) is used to impart the theoretical foundation for this research. The; data was gathered through the questionnaire distributed online to 384 people, and the sampling method is the purposive sampling technique. Derived; from the results of a survey’s; statistical studies, the TAM’s; studies reveal the ability to investigate OGS adoption in the Colombo District. Once; the data collection is completed, the results will be analyzed using SPSS software and reading the multiple linear regression method.
## I. INTRODUCTION
### a) Background of the study
The Coronavirus 2019 (COVID-19), which has infected more than 220 million people in more than 200 countries worldwide and killed more than four million, began in the Chinese city of Wuhan in Hubei Province in 2019 (BBC, 2020). In; the COVID-19 pandemic people's; behavior is moved in many paths by a critical situation, with some aspects of behavior becoming uncontrollable. Consumer; behavior is changing due to economic uncertainty, although how most of the change demonstrated during the COVID-19 crisis will last remains to be seen (Mehta, Saxena, and Purohit, 2020). Against; an environment wherein global powers have succumbed to COVID-19's; devastating pandemic, Sri Lanka is suffering dramatic change in its traditional social, cultural, and economic behavior. Today's; generation is fascinated with the internet; because of the vast amount of knowledge and numerous conveniences available the internet. In; 2021, around 4.6 billion people will utilize the Internet; out of an overall population of 7.8 billion. In; comparison to the previous year, this is a $7.3\%$ incensement, and internet penetration or internet utilization as a percentage of the population in the World was $59.5\%$ in January 2021 (Kemp, 2021).
According to these reports, it is visible that most of the population of Sri Lanka has shopped online at least once in their lifetime. On; the other hand, customers can order as many commodities as they prefer and as much as they can afford (Chen, 2006). As; consumers become more technologically savvy and knowledgeable about the use and acceptance of digital media and the internet; there has been an unprecedented growth in online shopping. Another; advantage of online groceries is good customer service and investigating factors influencing customer loyalty and repurchase intentions in online shopping services like prompt responses to queries online, cancel, and return options, different modes of payment like cards payments, COD and EMI are few other benefits that online shoppers experience. This; makes online groceries risky to the customer end, leading to a lack of trust, which at times causes consumer avoidance of online shopping (Ribbink et al., 2004). Since; a limited number of empirical research has been conducted taking the Sri Lankan context into concern, examining the influencing force of customer loyalty in online groceries. Therefore; the primary purpose of this study is to explore the influence of key factors such as product quality, customer trust, and customer confidence on customer loyalty in online groceries in the Sri Lankan context. Initially; the study will explore the nature of customer loyalty, product quality, customer trust, and confidence in the Sri Lankan context. In this study; a few hypotheses about the influence of each of these factors on customer loyalty in online groceries will be developed, and based on the research data collected from the selected sample, and those hypotheses will be examined. This; is followed by the methodology used in this study to explore the developed model. Finally; the study elaborately discuss the results and will provide potential implications for further research.
### b) Problem Statement
Shopping through the internet; is a part of E-Commerce; (Ouellette, 2019) says in the study, "In 2019, it estimated; there are 1.92 billion digital buyers, and E commerce sales account for $14.1\%$ of retail purchases worldwide"; Also; her study mentioned that"; In 2023, E-commerce retail purchases are expected to rise from $14.1\%$ to $22\%$ "; Purchasing goods and services through the online shopping system is trendy in the United States and European countries and has spread to third-world countries like India (Williams, 2021). The; primary issue that online grocery stores confront is gaining consumer loyalty. According; to (DAILY NEWS, 2020), before the COVID- 19 epidemic, online shopping stayed at $9\%$ in Sri Lanka. However; during the pandemic, the percentage of online shopping overgrew from $9\%$ to $47\%$. Keells; and Cargills supermarkets became the most used and popular online stores during the epidemic situation in Sri Lanka (DAILY NEWS, 2020). Other; than that, Sathosa, Laugh, Arpico, Glomark, and other supermarkets are also some popular supermarkets in Sri Lanka (DAILY NEWS, 2020). Says; that within the COVID-19 situation, $59\%$ of people browsed to buy their essential groceries online. However; fact, only $47\%$ of consumers purchased groceries online. The; remaining $12\%$ tried to purchase goods and services online but refrained from buying goods and services due to the inconvenience and shortcomings. Another; $41\%$ had not attempted to buy goods via the internet; because of unawareness about this online shopping mechanism, lack of confidence in the system, and lack of devices required to buy (DAILY NEWS, 2020).
### c) Research Gap
The studies overlooked the connection between how customer loyalty depends on other factors such as customer satisfaction, customer confidence, customer trust, product quality, and technology adoption regarding the age; of the people. According; to this study, age; is a theoretical gap because age; in other countries is not described as a research moderator under the research gap. Numerous; advantages of purchasing online encourage people of all ages to make online purchases (Pratminingsih, Lipuringtyas, and Rimenta 2013). Meanwhile; there is a scarcity of empirical evidence on the subject of how to deal with age; and other factors that change customer loyalty in online shopping, such as customer satisfaction, customer confidence, customer trust, product quality, and technology adoption, which are limited in information about the relationship. According; to this, these variables may be related. However; few current studies have investigated the effects of these online shopping parameters on the relationship between customer loyalty and the online shopping effect. Consumers; buying groceries online used to be common until COVID became dreadlocked in the; lives of humans. The customer's; perception of the internet shopping trend has completely shifted. People; are discovering alternate ways to meet their requirements despite the worldly challenges, due to shops closing and physical connections among both parties being restricted. Consumers; could communicate virtually as technology reached their hands, allowing marketers who were unable to get the market within regular days to do so. People; were concerned about the security of their information becoming vulnerable as technology innovation increased the number of consumers entering the digital realm and kept the economy going. In; prior research, technology adoption was used to analyze customer loyalty. However; the variables that engage and secure customers in their cultural, social, and personal characteristics were not explored. Here; product quality is a significant reason customers are reluctant to get involved in online purchasing. When; shopping in a physical store, customers expect to be delighted with the product's; quality (Singh et al., 2017). The; same commodities provided on an online platform stimulate the customer's; interest in a beautiful website, but the actual quality of the entity frustrates. Maintaining; consistent product quality at a fair price is critical in online shopping. There; have been few studies on the quality of grocery products. As; a result, in this research, we looked at how product quality and technology adoption impacted customer loyalty in Sri Lanka after COVID-19.
### d) Research Questions
1. Is there a significant impact between customer trust and customer loyalty?
2. Is there a significant impact between customer satisfaction and customer loyalty?
3. Is there a significant impact between customer confidence and customer loyalty?
4. Is there a significant impact between product quality and customer loyalty?
5. Is there a significant impact between technology adoption and customer loyalty?
6. Is there a significant impact between age; as the moderator and customer loyalty?
### e) Research Objectives
### Overall Objectives
- To identify the most significant factors affecting customer's; loyalty to online groceries during the COVID-19 pandemic situation in Sri Lanka.
#### Sub Objectives Use
- To identify whether there is a positive impact between customer satisfaction and customer loyalty during the COVID-19 pandemic situation.
- To identify whether there is a positive impact between customer confidence and customer loyalty during the COVID-19 pandemic situation.
- To identify whether there is a positive impact between product quality and customer loyalty during the COVID-19 pandemic.
- To identify whether there is a positive impact between customer trust and customer loyalty during the COVID-19 pandemic situation.
- To identify whether there is a positive impact between technology adoption and customer loyalty during the COVID-19 pandemic.
- To identify whether there is a positive impact between age; as the moderator and customer loyalty during the COVID-19 pandemic situation.
### f) Scope of the Study
The goal of this exploratory study is to look at how consumer loyalty in online groceries during the COVID-19 pandemic depended on other factors such as customer satisfaction, customer confidence, product quality, technology adoption, and age; as a moderator. One; of the things we considered a lot was how the Sri Lankan consumer faced this catastrophic situation, how they went about their daily lives, and how they changed their loyalty to COVID-19 in fulfilling their customer needs. According; to the readings and findings of various authors who have been able to find research on consumer changes in online groceries due to the situation in the research COVID-19 pandemic, which has many facts in finding data from different sources. But; they could to focus on the information about consumer changes in online groceries of product quality, and technology adoption was limited. Much; of the focus has been on customer loyalty and customer satisfaction. Therefore; this research finds out how consumer loyalty depends on customer satisfaction, customer trust, customer confidence, purchasing intention, product quality, and technology adoption that affect online groceries. Finding; information through research is essential for the government and the business community on how to break free from the traditional marketing system and sell and buy products online with customer loyalty.
## II. LITERATURE REVIEW
### a) COVID-19 Influence on Online Grocery Shopping
Over the age; of 55, the most significant change to online grocery buying occurred, nearly tripling the average online shopping. However; the number of individuals between the ages of 35 and 44 has increased dramatically, with 32 percent currently operating at least one online store; every week (Kemp, 2021). Survey; done in the United Kingdom shows that online purchasing was famous even before the crisis, but the disease spread quickly (Shveda, 2022). The; epidemic situation was a trigger of increased awareness for these solutions. According; to Statista Research Department data in 2021, Walmart Grocery app holds the top spot among shopping applications worldwide. This; shows that with the COVID-19 situation, most people had no choice but to shop online. In; the US, 75 percent of customers converted their regular buying pattern to shopping online due to COVID-19 (Redman, 2021). When; shopping for groceries online in the US, 45 percent of customers prefer to have their orders delivered to their homes. About; 9 percent of internet-based sellers use store; to fulfill customer orders. However; 20 percent of respondents are users of online subscription services, which often offer users unlimited free pickups various delivery based on transaction amount and frequency, among many other benefits. When; it comes to grocery shopping, 40 percent of people say they utilize these programs, online membership is particularly popular among young people, which we identify as Generation Z and Millennials. Generation; X was the most frequent consumers of store pickups, which are 20 percent percentage (Redman, 2021).
### b) Online Grocery Shopping in Sri Lanka
According to the from the Telecommunication Regulatory Commission of Sri Lanka, in 2017 overall quantity of mobile broadband services has quadrupled every year since its launch in 2009, averaging a roughly 96.5 percent increase over the last six years. By; the end of 2015, every 100 persons in Sri Lanka owned 113 smartphones and 13 fixed lines. These; statistics are related to the situation before COVID-19 broke in. Online; grocery shopping has grown steadily in Sri Lanka recently, which is actually quite significant. Over; 90 percent of people in Sri Lanka use their laptops and smartphones to access the internet; (Haq, 2020). With; the help of Daraz's; selling tools, merchants may now respond to rising client demands and start their own businesses. Eighty-five percent of all online consumers in Sri Lanka claim to have used Daraz, (Sunday Observer, 2020).
The Western province has the most significant online order share of 50 percent, followed by the Northwestern and central regions with 10 percent, 9 percent order shares, correspondingly. Colombo; and Gampaha have the highest district-level order share, with 31 percent earlier and 15 percent in the former. The; distribution in these areas reflects the country's; demographic density (Daily FT, 2022).
### c) Conceptual Framework
The study's; dependent variable is customer loyalty, whereas the study's; independent variables are customer satisfaction, customer trust, customer confidence, product quality, and technology adoption. Furthermore; as a result of the questionnaire, age has a significant impact on the online shopping system and, age act as a moderator variable in the study. The; below Figure 3.1 conceptual framework provides a more detailed description of this relationship between independent variables, dependent variables, and moderator variables.
H1: There is a significant impact on customer trust and customer loyalty.
H2: There is a significant impact on customer satisfaction and customer loyalty.
H3: There is a significant impact on customer confidence and customer loyalty.
H4: There is a significant impact on product quality and customer loyalty.
H5: There is a significant impact on technology adoption and customer loyalty.
H6: There is a significant impact on age; as a moderator and customer loyalty.
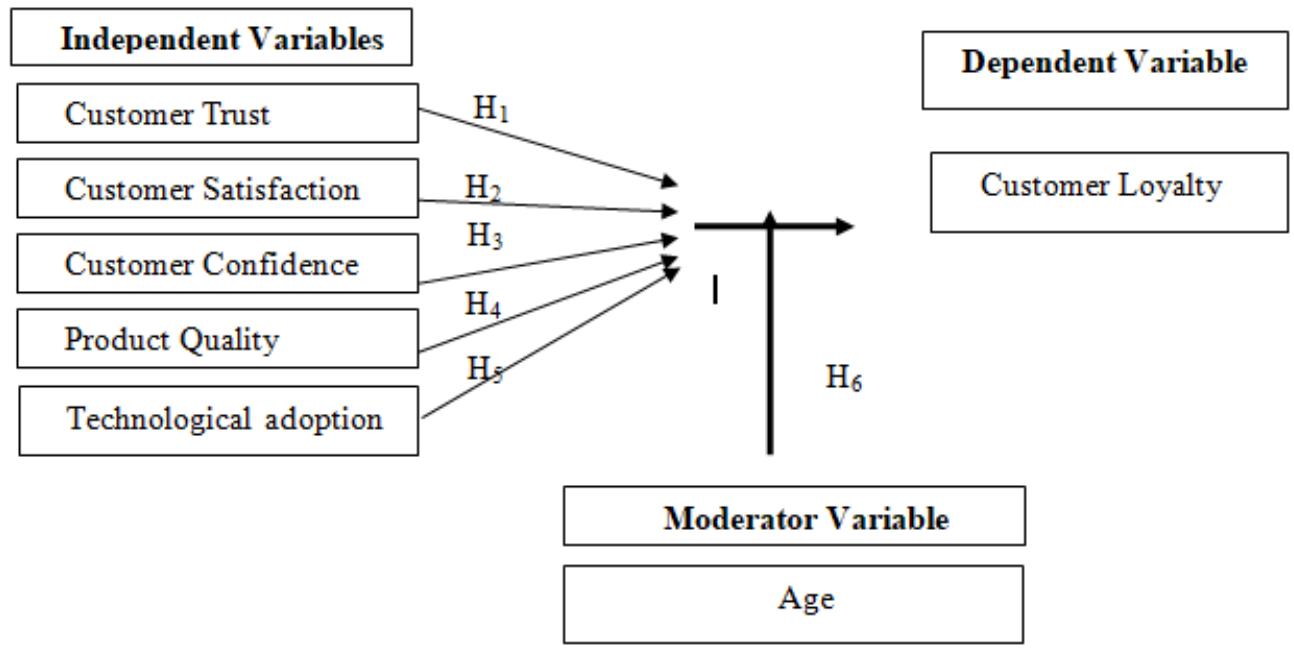 Figure 1: Conceptual Framework
### d) Customer Loyalty
Customer satisfaction and other variables that will eventually essentially enhance consumers' loyalty intents mostly are essential to the success of online purchasing in a subtle way. Understanding; customer loyalty is essential for a business, definitely contrary to popular belief (Abu-Alhajla et al., 2018). In addition positive relationships that consumers have towards the companies they visit. It; can also apply to clients who come back regularly. Customer; happiness is directly influenced by the perceived quality, and customer complaint levels and loyalty are affected indirectly by perceived quality.
The term loyalty can specifically be defined as something that consumers express to a particular brand, product, service, or activity, or so they mainly thought. (Balabanis, Reynolds and Simintiras, 2006). Acquisition of new customers might support in the short run business, and this can only be sustained for the long term when the acquired customers are appropriately maintained and generated repetitively (Gomez, Arranz, and Cillan, 2006). Therefore; many companies have made great efforts to improve customer loyalty as one of the major concerns in their objective setting and designing the core strategies of their marketing plan.
Customer loyalty is the dependent variable of this study, and it plays a crucial role in any organization, growing to sustain in the long run. As; a percentage, increasing client retention at 5 percent can result in a 25-95 percent boost in earnings (Gallo, 2014). Customer; loyalty is critical for any business, regardless of its size. Because; they are unfamiliar with the operations or items a company supplies, first-time clients are more challenging to persuade.
An evaluation between the expectations of the customers and post-sales opinions is used to determine customer satisfaction (Kotler & Keller, 2012). The; other factor that will affect customer loyalty is trust. Positive; perspectives and consumer loyalty result from establishing trust (Moreira & Silva, 2015). The; client will be more involved in creating value and joint business as a result of the trust between the firm and the buyer, which leads to a long-term connection (Lepojevic, Dordjevic and, Dukic, 2018).
In addition, Product and service quality plays a huge part in loyalty. Because; service quality and customer satisfaction are linked and typically traceable, this effect can be achieved through the degree of satisfaction. Also; there is a belief that service quality is not the main factor of customer happiness, despite the fact that it is frequently critical (Moreira and silva 2015).
As we mentioned above, there are some factors that affect customer loyalty, and they are customer satisfaction, customer confidence, customer trust, product quality. In; addition, since we are mainly talking about online groceries, there is another factor, which is technology adoption.
### e) Customer Trust
Customer trust is another independent variable in this discussion. It is receptive conduct to what they get. Trust is a critical factor to measure success because consumers should trust the company before trusting the brand or product. A study in Turkey reveals a lack of trust in online consumers, and safety is the main barrier to not doing online shopping (Lightner et al., 2010). To show trust as an influential factor in repurchasing intention, Thorsten, in the study of understanding the relationship outcome using customer loyalty and word of mouth communication, suggested in the findings that customer trust, customer satisfaction, and commitment influence customer loyalty directly (Thorsten et al., 2002). Gaining customer trust is necessary to an organization, not only to create a loyal customer base but also to ensure they repurchase frequently, and insist their fellow customers engage more with the online grocery. A study on consumer trust argues that trust is a critical factor in deciding the relationship between buyers and sellers (Sirdeshmukh, Singh, and Sabol, 2002). In the context of online shopping, trust plays a vital role in deciding future transaction and making online payments as customer poses e-risk in making online payment to their transactions and disclosing information. In contrast to traditional retailing, customer expects online purchase so as to replace their physical experience. E-trust is the number of confidence consumers perceive in online transactions and online channels (Giao, Vuong, and Quan, 2020). The study to examine the influence of website the quality in building E-trust shows the quality of the website influence customer in their satisfaction and impact electronic word of mouth communication to recommend to other buyers. Similarly, customer trust in the B2C framework in China also revealed that customer trust induces the repurchase intention of the buyer (Yongzhi and Lu 2010). Customer trust influence customer in their repurchase intention. Customer; trust in the online shopping environment is a very significant topic to influence customer loyalty.
### f) Customer Satisfaction
Customer satisfaction defined in Kotler and Keller's book described that, "Satisfaction is a person's feelings of pleasure or disappointment that result from comparing a product's perceived performance (or outcome) to expectations" (Kotler and Keller 2006, p.128). Customer satisfaction is another independent variable in this study. Customer satisfaction is a crucial fact that decides the future of the business and therefore, many organizations take a great deal in creating customer satisfaction during the shopping experience. A study conducted in China to examine the satisfaction through product quality in delivery service revealed that product variety, product quality, product availability, package safety and, reliable and timely delivery create customer satisfaction (Ziaullah, Feng and, Akhter 2014). Customer satisfaction increases repurchase intention and influences customers to give a positive vibe to other unsatisfied customers.
In contrast to Kotler and Keller (2006), another study revealed that satisfaction is not only the concept of just assessing the expectation but also customer influenced by factors such as service quality, product quality and, price moderating situational and personal factors (Genoveva, 2015). Customer satisfaction and loyalty to perceived service quality and brand image increase customer satisfaction (Zeithaml and Bitner, 2012). Happy customers become loyal and tend to give recommendations to others about the service quality who are potential customers. Satisfied customers are more likely to have high usage and more likely to repurchase. According to research in E-commerce, greater customer satisfaction increases the rate of repurchasing from the same provider (Rust and Zahorik, 1993). A high level of customer satisfaction leads to less likelihood of switching online service providers which increases customer repurchase and increases customer retention. Customer satisfaction positively influences repurchasing and customer retention to increase customer loyalty toward online shopping. Customer satisfaction raises customer retention, which increases the market share of the business. It is critical to consistently delight customers by providing high-quality services and products at a low price, enhancing the company's income.
### g) Customer Confidence
How can we build customer confidence in the product, so they buy it before trying it? becomes the most significant question. Customer confidence convinces the customers to engage more with the online grocery where they have an unmatched shopping experience. Customer confidence is boosted when the brand develops trust among the audience. Customers expect reliable, safe, and quick delivery of products to their homes through online shopping. Time and reliability play a vital role in enhancing customer convenience to achieve customer satisfaction as the study stated that timely delivery, reliability, safety, and efficiency are fundamental objectives of online buyers. Customers are willing to pay more to get the fast delivery of the products. Customers expect reliable, safe, and quick delivery of products to their homes through online shopping. Customers have more freedom to switch to another website or other online platform due to unsafe and undesirable product delivery. A study found that $67\%$ of online consumers refer return policy page. A simple return policy and money-back guarantee increase customer confidence. Quality website, security on customer payments, relevant products, modern products, safe and quick delivery increases customer confidence in online shopping platform. At the same time, a brand in the heart of customer boosts their confidence of the customer in online shopping. A customer expects specific value through purchasing branded products. Customer purchases of branded items that exceeds the intrinsic value of the product, increasing confidence that the brand gives weight to the product. Exceeding customer expectation over the brand increase customer confidence; hence customer confidence as an influential factor to increase customer loyalty.
### h) Product Quality
The majority of the customers possess the required knowledge on which online shop has the best variation of the best quality products. The quality of the product is viewed from the customer's perspective. Product quality is another essential factor in this discussion. It has an immense effect on customer loyalty. Many scholars have found a positive connection between customer loyalty and product quality. Assessing the product quality reveals that expected quality is compared against the perceived quality of the product. If expected quality exceeds perceived quality, customers feel satisfied with the product. A study conducted in Taiwan examining perceived quality and trust stated that quality is defined by the degree to which perceived quality meets objective quality (Chen, Lin and, Weng 2015). The results show that product quality is a significant factor in increasing customer satisfaction. A study conducted in Indonesia stated consumers regard online shops as useful if product quality meets the expectation at the same time, product quality contributes to satisfy customer needs. The study pointed out that customer repurchase is highly dependent on maintaining product quality sustainably. Assurance of product quality and product availability increases customer satisfaction, thus increasing customer purchasing intention. It is concluded that product quality is an essential factor in retaining customers in the e-commerce business. Additionally, another study also supports the fact that product quality and service quality drives customer loyalty and retention (Kayode, Muyideen and Al-Furqa 2016). Product quality is considered an unavoidable factor to influence customer satisfaction. Firms strive to employ quality managers to improve the quality of the products. In fact, the price can decide the customer to purchase a product; nevertheless the product is of high quality. A study to test the product quality and price towards customer satisfaction in Indonesia found that product quality with affordable price will increase customer satisfaction (Razak, Nirwanto and, Triatmanto 2016). Another study conducted in Romania found that $80\%$ of Romanian add products to carts considering the price (Mihaela 2018). Due to many cultural differences, product quality and price is very essential topic of interest for many scholars, and hence product quality is another dependent variable in this research.
### i) Technology Adoption
The acceptance, integration, and usage of new technology in society are referred as technology adoption. Technology adoptions increase business productivity, improve the return on investment, and enhances the entire customer experience by making use of online platform easier. Age, gender, computer abilities, technological preparedness, and social impact are all elements that influence the adoption of technology. With the advent of internet banking, there has been a greater focus on consumer's perspective on technology adoption. A study stated that online shopping is not only buying products or services online but also includes searching for information online, communicating with retailers and other consumers that direct consumer goals toward shopping (Lee and Cude, 2021). Many other studies also support the statement that customer technology adoption enhances customers to 24/7 shopping, comparing price, checking for offers, make payments online, and much more. Consumers are pushed towards online shopping due to consumer's perception, product and consumer characteristics, and e-tailer attributes (Lee and Cude, 2021). Technology evolved immensely to convey customer's ease of use of buying products. Compared to traditional shopping, technological advancement and benefits set customer's minds that purchasing online is the best solution. Internet penetration in the business world has many benefits, such as availability of products, many payment methods, safety and privacy, price comparison. Many people are rushing toward online shopping due to Internet penetration in to the business (Patahk and Kaur, 2014).
Technology acceptance of consumer is characterized by four categories, namely cultural, social, psychological, and personal factors. Many scholars argue that cultural and behavioral pattern has influences in the virtual market (Constantinides et al., 2008; AlQudah and Ahmad, 2014). A study of the effect of social connectedness and attitudes toward technology adoption shows that social connectedness and attitudes strongly influence customer intention of the social factors for technology adoption (Cho and Son, 2019). Psychological factors on technology adoption influence the behavior of other people by recognizing, sharing common feelings and devotions. Motivation, perception, learning, belief, and attitudes influence one's perception to motivate others to adopt technology when one user benefits. Many studies define personal factors by age and life circle stage, occupation, economic situation, lifestyle, personality, and self-concept (Keisidou, Sarigiannidis and, Maditinos, 2011; Kotler and Armstrong, 2003). Consumers' buying behavior changes due to family, occupation, age, characteristics and interests of person, habitual activities, and the economic situation of the person. Even though the personal factor is not predictive and constant, it is very significant factor for technology adoption. The study adopted the TAM model by Davis in 1989 used to analyze user technology acceptance behavior in various types of information systems. As per TAM, an individual's intention to use a system is determined by perceived usefulness and ease of use.
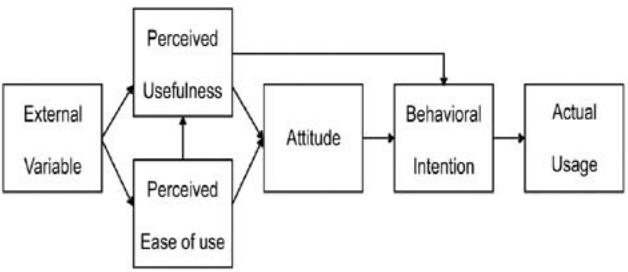
Source: Samaradiwakara and Gunawardena 2014
TAM model has been successfully adopted to explain the online purchasing and acceptance of e-commerce. The model explains Perceived usefulness (PU) and Perceived ease of use (PEOU) can predict the attitude, behavior, and intention of the user (Dakduk et al., 2017). The TAM model has become a significant model to include external factors in assessing user acceptance and buying behavior of the user hence we use technology adoption as an influencing aspect to decide customer loyalty to online shopping. Litterateur on the study reveals that technology adoption has a significant impact on customer loyalty as people use e-commerce platforms to buy products due to many reasons such as price, ease of use, payment option, geographical location, culture, income, and internet usage. Consumers who have positive intentions about the above-mentioned factors will engage more in internet shopping. The positive sense will change the attitude of the user to use the technology. We used the TAM model to understand the perceived usefulness of technology for online shopping as user intention to use technology for e-commerce is very important to the success of technology adoption in e-commerce.
## III. CHAPTER THREE
This chapter demonstrates and provides a thorough explanation of the variables employed in the study. This; study, developed following the quantitative method, examines which factors have a more significant impact on consumer loyalty of people who turn to buy groceries online as a result of the country being lockdown with a COVID 19 epidemic. Data; was collected based on the primary data and surveys, and questionnaires were used to collect data for this research. The; questionnaires consist of thirty-seven questions along with a five-point Likert scale covering all the variables of the study. Out; of the total population of 21.9 million in Sri Lanka (World Bank, 2021), 47 percent purchased groceries online during the COVID 19 pandemic (DAILY NEWS, 2020). Therefore; during the pandemics in 2020, 10.3 million people bought groceries using the internet; To determine the ideal sample size, the total population of the Colombo District will be 2,455,000 in 2020 (Department of Census and Statistics, 2021). In; proportion to, Krejcie and Morgan (1970), the sample size is 384 in this study. Purposive; sampling or judgment sampling is applied as a sampling technique.
The primary goal of the pilot survey was to determine the validity and reliability of the disseminated questionnaires. A; pilot survey was done containing 100 samples before the entire data collection was completed, and it was evaluated by applying IBM SPSS version 26.0. The; variable is acceptable only if more significant than 0.7, as specified in Cronbach's; alpha (Siswaningsih et al., 2017). The; Cronbach's; alpha of all the variables is 0.984, while the dependent variable, Customer Loyalty, has a Cronbach's; alpha of 0.946. The; independent variables, CL, CT, CS, CC, TA, and PQ, have Cronbach's; alpha values of 0.927, 0.924, 0.911, 0.865, and 0.939, respectively. The; Kaiser-Meyer-Olkin Measure of Sampling Adequacy and Bartlett's; test of sphericity was employed to evaluate the validity. Variable is acceptable only if variable is more significant than 0.5(IBM, 2014). In; this study, the KMO value of all the variables is more significant than 0.5. If; an indicator's; significance level is less than 0.05, Bartlett's; test of sphericity will be beneficial, according to IBM (2014), and all the variables are less than 0.05.
The distribution of the population of about 384 customers who participated in the questionnaire is shown in Table 1. Female; participants are the ones that buy most of the groceries online, representing 62.0 percent. The; majority belonged to the age group of 26-35 years was represented by 40.4 percent of the 384 individuals in the sample. The; plurality of respondents were private-sector employees, representing 32.81 percent of the total.
Table 1: Demographic Information of Participant
<table><tr><td>Variables</td><td>Items</td><td>Frequency</td><td>Percentage (%)</td></tr><tr><td rowspan="2">Gender</td><td>Female</td><td>238</td><td>62.0</td></tr><tr><td>Male</td><td>146</td><td>38.0</td></tr><tr><td rowspan="5">Age</td><td>18-25 Years</td><td>80</td><td>20.8</td></tr><tr><td>26-35 Years</td><td>155</td><td>40.4</td></tr><tr><td>36-45 Years</td><td>86</td><td>22.4</td></tr><tr><td>46-55 Years</td><td>41</td><td>10.7</td></tr><tr><td>Above 56</td><td>22</td><td>5.7</td></tr><tr><td rowspan="4">Profession</td><td>Private Sector</td><td>126</td><td>32.8</td></tr><tr><td>Public Sector</td><td>108</td><td>28.1</td></tr><tr><td>Entrepreneur</td><td>86</td><td>22.4</td></tr><tr><td>Unemployed</td><td>64</td><td>16.7</td></tr></table>
### a) Person Correlation Coefficient
To determine the connection between two quantitative variables, the person correlation coefficient is employed.
## IV. ANALYSIS AND DISCUSSION
### a) Demographic Information
Table 2: Pearson correlation coefficient
<table><tr><td>Independent Variable</td><td></td><td>Dependent Variable</td><td>R-Value</td><td>P-Value</td><td>N</td></tr><tr><td>CT</td><td>←→</td><td>CL</td><td>0.822</td><td>0.000</td><td>384</td></tr><tr><td>CS</td><td>←→</td><td>CL</td><td>0.836</td><td>0.000</td><td>384</td></tr><tr><td>CC</td><td>←→</td><td>CL</td><td>0.881</td><td>0.000</td><td>384</td></tr><tr><td>PQ</td><td>←→</td><td>CL</td><td>0.939</td><td>0.000</td><td>384</td></tr><tr><td>TA</td><td>←→</td><td>CL</td><td>0.941</td><td>0.000</td><td>384</td></tr><tr><td>Age</td><td>←→</td><td>CL</td><td>0.969</td><td>0.000</td><td>384</td></tr></table>
According to Table 2, the Pearson correlation coefficient between Customer Trust and Customer Loyalty is 0.822, which has a strong positive relationship. Customer; Loyalty and Customer Trust's significance value are 0.000, demonstrating that Customer Loyalty and Customer Trust have a statistically significant correlation. The; Pearson correlation coefficient between Customer Satisfaction and Customer Loyalty is 0.836, which has a strong positive relationship at the significance value of 0.000. When; considering Customer Confidence, there a strong positive correlation of 0.881 with Customer Loyalty at the significance value of 0.000. The; Product Quality and
Customer Loyalty Pearson correlation coefficient is 0.939, which has a perfect positive relationship at the significance value of 0.000. The; Pearson correlation coefficient between Technology Adoption and Customer Loyalty is 0.941, which has a perfect positive relationship at the significance value of 0.000. Age; and Customer Loyalty Pearson correlation coefficient is 0.969, which has a perfect positive relationship at the significance value of 0.000.
### b) Regression Analysis
Regression analysis is performed on whether a change in one variable predicts a difference in another.
Table 3: Model Summary and ANOVA of Customer Trust on Customer Loyalty
<table><tr><td colspan="2">Model Summary</td><td>ANOVA</td></tr><tr><td>R-Value</td><td>R Square</td><td>P-Value</td></tr><tr><td>0.822a</td><td>0.676</td><td>0.000b</td></tr><tr><td colspan="3">a. Dependent Variable: Customer Loyalty</td></tr><tr><td colspan="3">b. Predictors: (Constant), Customer Trust</td></tr></table>
Following Table 3, the R2 value is 0.676, which determines that the independent variable, customer trust, can examine 67.6 percent of the total variant in customer loyalty. The; significance value between Customer Loyalty and Customer Trust is 0.000, and as a result, the null hypothesis can be rejected, and an alternative hypothesis can be accepted.
H1: Customer trust has a positive impact on customer loyalty.
Table 4: Coefficients of Customer Trust on Customer Loyalty
<table><tr><td></td><td>Unstandardized Coefficients</td><td>P-Value</td></tr><tr><td></td><td>B Value</td><td></td></tr><tr><td>(Constant)</td><td>0.988</td><td>0.000</td></tr><tr><td>Customer Trust</td><td>0.754</td><td>0.000</td></tr><tr><td colspan="3">a. Dependent Variable: Customer Loyalty</td></tr></table>
The above Table 4 demonstrates Customer Trust has a significant value of 0.000. As; a result, implementing H1 reveals that Customer Trust impacted Customer Loyalty. The; B1 value is 0.754, indicating that for every unit increase in Customer Trust, a 0.754-unit gain in Customer Loyalty can be expected, presuming all other variables remain constant.
Table 5: Model Summary and ANOVA of Customer Satisfaction on Customer Loyalty
<table><tr><td colspan="2">Model Summary</td><td>ANOVA</td></tr><tr><td>R-Value</td><td>R Square</td><td>P-Value</td></tr><tr><td>0.836a</td><td>0.699</td><td>0.000b</td></tr><tr><td colspan="3">a. Dependent Variable: Customer Loyalty</td></tr><tr><td colspan="3">b. Predictors: (Constant), Customer Satisfaction</td></tr></table>
According to Table 5, the R2 value is 0.699, and it determines that 69.9 percent of the total variation in Customer Loyalty can be examined by the independent variable, which is Customer Satisfaction. The significance value between Customer Loyalty, and
Customer Satisfaction is 0.000, and as a result, the null hypothesis can be rejected, and an alternative hypothesis can be accepted.
H2: Customer Satisfaction has a positive impact on customer loyalty.
Table 6: Coefficients of Customer Satisfaction on Customer Loyalty
<table><tr><td></td><td>Unstandardized Coefficients</td><td rowspan="2">P-Value</td></tr><tr><td></td><td>B Value</td></tr><tr><td>(Constant)</td><td>0.963</td><td>0.000</td></tr><tr><td>Customer Satisfaction</td><td>0.783</td><td>0.000</td></tr><tr><td colspan="3">a. Dependent Variable: Customer Loyalty</td></tr></table>
Given Table 6, Customer Satisfaction has a significant value of 0.000. As; a result, implementing H2 reveals that Customer Satisfaction impacted Customer Loyalty. The; B1 value is 0.783, indicating that for every unit increase in Customer Satisfaction, a 0.783-unit gain in Customer Loyalty can be expected, presuming all other variables remain constant.
Table 7: Model Summary and ANOVA of Customer Confidence on Customer Loyalty
<table><tr><td colspan="2">Model Summary</td><td>ANOVA</td></tr><tr><td>R- Value</td><td>R Square</td><td>P- Value</td></tr><tr><td>0.881a</td><td>0.776</td><td>0.000b</td></tr><tr><td colspan="3">a. Dependent Variable: Customer Loyalty</td></tr><tr><td colspan="3">b. Predictors: (Constant), Customer Confidence</td></tr></table>
The above Table 7 reveals the R2 value is 0.776, and it determines that 77.6 percent of the total variation in Customer Loyalty can be examined by the independent variable, Customer Confidence. The; significance value between Customer Loyalty, and
Customer Confidence is 0.000, and as a result, the null hypothesis can be rejected, and an alternative hypothesis can be accepted.
H3: Customer Confidence has a positive impact on customer loyalty.
Table 8: Coefficients of Customer Confidence on Customer Loyalty
<table><tr><td></td><td>Unstandardized Coefficients</td><td rowspan="2">P-Value</td></tr><tr><td></td><td>B Value</td></tr><tr><td>(Constant)</td><td>0.432</td><td>0.000</td></tr><tr><td>Customer Confidence</td><td>0.884</td><td>0.000</td></tr><tr><td colspan="3">a. Dependent Variable: Customer Loyalty</td></tr></table>
According to Table 8, Customer Confidence has a significant value of 0.000. As; a result, implementing H3 reveals that Customer Confidence impacted Customer Loyalty. The B1 value is 0.884, indicating that for every unit increase in Customer Confidence, a 0.884-unit gain in Customer Loyalty can be expected, presuming all other variables remain constant.
Table 9: Model Summary and ANOVA of Product Quality on Customer Loyalty
<table><tr><td colspan="2">Model Summary</td><td>ANOVA</td></tr><tr><td>R- Value</td><td>R Square</td><td>P- Value</td></tr><tr><td>0.939a</td><td>0.883</td><td>0.000b</td></tr><tr><td colspan="3">a. Dependent Variable: Customer Loyalty</td></tr><tr><td colspan="3">b. Predictors: (Constant), Product Quality</td></tr></table>
In the view of Table 9, the R2 value is 0.883, and it determines that 88.3 percent of the total variation in Customer Loyalty can be examined by the independent variable, which is Product Quality. The; significance value between Customer Loyalty and Product Quality is
0.000, and as a result, the null hypothesis can be rejected, and an alternative hypothesis can be accepted.
H4: Product Quality has a positive impact on customer loyalty.
Table 10: Coefficients of Product Quality on Customer Loyalty
<table><tr><td></td><td>Unstandardized Coefficients</td><td rowspan="2">P-Value</td></tr><tr><td></td><td>B Value</td></tr><tr><td>(Constant)</td><td>0.819</td><td>0.000</td></tr><tr><td>Product Quality</td><td>0.804</td><td>0.000</td></tr><tr><td colspan="3">a. Dependent Variable: Customer Loyalty</td></tr></table>
Following Table 10, Product Quality has a significant value of 0.000. As; a result, implementing H4 reveals that Product Quality impacted Customer Loyalty. The; B1 value is 0.804, indicating that for every unit increase in Product Quality, a 0.804-unit gain in Customer Loyalty can be expected, presuming all other variables remain constant.
Table 11: Model Summary and ANOVA of Technology Adoption on Customer Loyalty
<table><tr><td colspan="2">Model Summary</td><td>ANOVA</td></tr><tr><td>R-Value</td><td>R Square</td><td>P-Value</td></tr><tr><td>0.941a</td><td>0.885</td><td>0.000b</td></tr><tr><td colspan="3">a. Dependent Variable: Customer Loyalty</td></tr><tr><td colspan="3">b. Predictors: (Constant), Technology Adoption</td></tr></table>
According to Table 11, the R2 value is 0.885, and it determines that 88.5 percent of the total variation in Customer Loyalty can be examined by the independent variable, which is Technology Adoption. The; significance value between Customer Loyalty and
Technology Adoption, is 0.000, and as a result, the null hypothesis can be rejected, and an alternative hypothesis can be accepted.
H5: Technology Adoption has a positive impact on customer loyalty.
Table 12: Coefficients of Technology Adoption on Customer Loyalty
<table><tr><td></td><td>Unstandardized Coefficients</td><td rowspan="2">P-Value</td></tr><tr><td></td><td>B Value</td></tr><tr><td>(Constant)</td><td>0.286</td><td>0.000</td></tr><tr><td>Technology Adoption</td><td>0.929</td><td>0.000</td></tr><tr><td colspan="3">a. Dependent Variable: Customer Loyalty</td></tr></table>
In Table 12, Technology Adoption has a significant value of 0.000. As; a result, implementing H5 reveals that Technology Adoption impacted Customer Loyalty. The; B1 value is 0.929, indicating that for every unit increase in Technology Adoption, a 0.929-unit gain in Customer Loyalty can be expected, presuming all other variables remain constant.
Table 13: Model Summary and ANOVA of Age on Customer Loyalty
<table><tr><td colspan="2">Model Summary</td><td>ANOVA</td></tr><tr><td>R-Value</td><td>R Square</td><td>P-Value</td></tr><tr><td>0.969a</td><td>0.939</td><td>0.000b</td></tr><tr><td colspan="3">a. Dependent Variable: Customer Loyalty</td></tr><tr><td colspan="3">b. Predictors: (Constant), Age* Customer Loyalty, Mean All (Customer Satisfaction, Customer Trust, Customer Confidence, Technology Adoption, And Product Quality), Age</td></tr></table>
Following Table 13, the R2 value is 0.939, and it determines that 93.9 percent of the total variation in Customer Loyalty can be examined by the moderator variable, which is Age. The; significance value between
Customer Loyalty and Age, is 0.000, and as a result, the null hypothesis can be rejected, and an alternative hypothesis can be accepted.
H6: Age has a positive impact on customer loyalty.
Table 14: Coefficients of Age on Customer Loyalty
<table><tr><td></td><td>Unstandardized Coefficients</td><td rowspan="2">P-Value</td></tr><tr><td></td><td>B Value</td></tr><tr><td>(Constant)</td><td>1.551</td><td>0.000</td></tr><tr><td>Mean All</td><td>0.626</td><td>0.000</td></tr><tr><td>Age</td><td>-0.514</td><td>0.000</td></tr><tr><td>Age* Customer Loyalty</td><td>0.125</td><td>0.000</td></tr><tr><td colspan="3">a. Dependent Variable: Customer Loyalty</td></tr></table>
In the view of Table 14, Age; has a significant value of 0.000. As; a result, implementing H6 reveals that Age; impacted Customer Loyalty. The; B1 value is - 0.514; indicating that for every unit increase in Age; a 0.514-unit decrease in Customer Loyalty can be expected, presuming all other variables remain constant.
## V. CONCLUSION
"Factors Influencing Customer Loyalty in Online Groceries After COVID - 19 In Sri Lanka"; With; the emergence of the Covid-19 situation, there were various influences on the day-to-day behavior of individuals. As; the condition spread rapidly around the world; it had a direct impact on people's; behavior. Since; this is not a situation that has been faced before, it took some time for humans to adapt to the social, economic, and environmental changes that came with it. This; situation has severely affected businesses, especially with travel restrictions and isolation.
Study continues to measure variations of customer loyalty with customer trust, customer satisfaction, customer confidence, product quality, technology adaptation, and age; as a moderator.
The limitations of this study are that this study considers online groceries. This; opens up possible research space to future researchers, as this will try to touch upon the online grocery field, which many people have not considered yet. On; the other hand, unlike the general customer base, this research specifically focuses on the young generation who engage for shopping in online groceries for household requirements. That; will be another limitation of the study.
Generating HTML Viewer...
References
56 Cites in Article
Abdullah Al-Qudah,O Ahmad,K (2014). The roles of culture in online shopping to enhance ecommerce in Jordan.
A Abu-Alhaija,R Nerina,H Hashim,N Jaharuddin (2018). Determinants of Customer Loyalty: A Review and Future Directions.
Wajeeha Aslam,Annas Hussain,Kashif Farhat,Imtiaz Arif (2019). Underlying Factors Influencing Consumers’ Trust and Loyalty in E-commerce.
George Balabanis,Nina Reynolds,Antonis Simintiras (2006). Bases of e-store loyalty: Perceived switching barriers and satisfaction.
N Bryant (2020). Gowing, Nicholas Keith, (Nik), (born 13 Jan. 1951), Main Presenter, BBC World News, BBC News, 2000–14 (Presenter, 1996–2000); Visiting Professor, King’s College London, since 2014.
S Cambon (2021). Ukraine’s economy has yet to show signs of recovery.
Y.-S Chen,C.-Y Lin,C.-S Weng (2015). The Influence of Environmental Friendliness on Green Trust: the Mediation Effects of Green Satisfaction and Green Perceived Quality.
Eunjoo Cho,Jihyeong Son (2019). The effect of social connectedness on consumer adoption of social commerce in apparel shopping.
Eunjoo Cho,Jihyeong Son (2019). The effect of social connectedness on consumer adoption of social commerce in apparel shopping.
Efthymios Constantinides,Stefan Fountain (2008). Web 2.0: Conceptual foundations and marketing issues.
Silvana Dakduk,Enrique Ter Horst,Zuleyma Santalla,German Molina,José Malavé (2017). Customer Behavior in Electronic Commerce: A Bayesian Approach.
P De Silva,K Perera,R Rajapaksha,A Idroos,H Herath,U Udawaththa,R Ratanayake (2020). http://ljournal.ru/wp-content/uploads/2017/03/a-2017-023.pdf.
A Gallo (2015). Appendix D: Mathematics Refresher.
Blanca García Gómez,Ana Gutiérrez Arranz,Jesús Gutiérrez Cillán (2006). The role of loyalty programs in behavioral and affective loyalty.
Genoveva (2015). Analyzing of Customer Satisfaction and Customer Loyalty Based on Brand Image and Perceived Service Quality.
Ha Giao,Bui Vuong,Tran Quan (2020). The influence of website quality on consumer’s e-loyalty through the mediating role of e-trust and e-satisfaction: An evidence from online shopping in Vietnam.
N Haq (2009). IMPACT OF COVID 19 ON THE GLOBAL ECONOMY.
J Hedin,M Jonsson,J Ljunggren (2006). Delivery Performance: How to Define & Measure Delivery Performance in a Triadic Relationship.
Yedam Ho,Oh Kwon,So Park,Tai Yoon,Young-Eun Kim (2017). Reliability and validity test of the Korean version of Noe's evaluation.
H Ibrahim,S Nor (2020). THE EFFECT OF AGE AND GENDER AS MODERATOR TOWARDS RELATIONSHIP BETWEEN CUSTOMER SATISFACTION AND REVISIT INTENTION: A STUDY ON TEA HOUSE SETTING.
M Jingarwar (2014). Quantitative Assessment of Fluoride Release and Recharge Ability of Different Restorative Materials in Different Media: An in Vitro Study.
O Kayode,A Muyideen,D Al-Furqan (2016). Sustainable Entrepreneurship and Customer Loyalty in the Fast Food Industry in Nigeria.
E Keisidou,L Sarigiannidis,D Maditinos (2011). Consumer characteristics and their effect on accepting online shopping, in the context of different product types.
S Kemp (2021). Digital in Sri Lanka: All the Statistics You Need in 2021. Data Reportal -Global Digital Insights.
Prakashraj Kumavat (2018). A Book Review On Principles Of Marketing Management 14Th Edition By Philip Kotler And Gary Armstrong.
P Kotler,K Keller (2011). Marketing Management.
Prakashraj Kumavat (2012). A Book Review On Principles Of Marketing Management 14Th Edition By Philip Kotler And Gary Armstrong.
Robert Krejcie,Daryle Morgan (1970). Determining Sample Size for Research Activities.
Seul Lee,Brenda Cude (2011). Consumer complaint channel choice in online and offline purchases.
Vinko Lepojevic,Biljana Djordjevic,Maja Ivanovic-Djukic (2018). Mediating Effects of Career Stage on Job-Related Characteristics - Job Satisfaction Relationship.
Seema Mehta,Tanjul Saxena,Neetu Purohit (2020). The New Consumer Behaviour Paradigm amid COVID-19: Permanent or Transient?.
(2012). A5 NORTH AMERICA: MID-YEAR POPULATION ESTIMATES & SOUTH AMERICA: MID-YEAR POPULATION ESTIMATES.
S Mihaela (2018). Product Quality Evaluation in Physical Stores versus Online Stores.
Vikas Mittal,Wagner Kamakura (2001). Satisfaction, Repurchase Intent, and Repurchase Behavior: Investigating the Moderating Effect of Customer Characteristics.
Christine Moorman,Rohit Deshpandé,Gerald Zaltman (1993). Factors Affecting Trust in Market Research Relationships.
Antonio Moreira,Pedro Silva (2015). The trust-commitment challenge in service quality-loyalty relationships.
D News (2020). Manchuria Daily News, Issue dated 1933-06-17.
C Ouellette (2019). Online Shopping Statistics You Need to Know in.
(2021). Supplemental Information 6: WorldBank data set (processed) with MN-C results.
I Razak,N Nirwanto,B Triatmanto (2016). The Impact of Product Quality and Price on Customer Satisfaction with the Mediator of Customer Value.
R Redman (2021). Unknown Title.
Dina Ribbink,Allard Van Riel,Veronica Liljander,Sandra Streukens (2004). Comfort your online customer: quality, trust and loyalty on the internet.
Sharon Rudansky-Kloppers (2014). Investigating Factors Influencing Customer Online Buying Satisfaction In Gauteng, South Africa.
Roland Rust,Anthony Zahorik (1993). Customer satisfaction, customer retention, and market share.
O Sanchez,P Costa,P Goes (2015). Shaping Customer Confidence in Online Purchasing Decision: The Role of DSS Tools Supporting an Information Aggregator.
K Shveda (2020). Unknown Title.
Sandeep Singh,Saurabh Srivastav,Amarish Yadav,Saripella Srikrishna (2017). Knockdown of APPL mimics transgenic Aβ induced neurodegenerative phenotypes in Drosophila.
Deepak Sirdeshmukh,Jagdip Singh,Barry Sabol (2002). Consumer Trust, Value, and Loyalty in Relational Exchanges.
W Siswaningsih,H Firman,Zackiyah,A Khoirunnisa (2017). Development of<i>Two-Tier</i>Diagnostic Test Pictorial-Based for Identifying High School Students Misconceptions on the Mole Concept.
C Staff (2018). How Age and Life Stage Affect Retail Consumer Loyalty. CCG; CCG Retail Marketing Blog.
T,V Sivapalan,A (2016). Integrated Model for Understanding and Enhancing Green Purchase Behavioral Intention: Directions for Future Research.
C Williams (2010). Unknown Title.
V Zeithaml (2000). Service Quality, Profitability, and the Economic Worth of Customers: What We Know and What We Need to Learn.
M Ziaullah,Y Feng,S Akhter (2014). E-Loyalty: the Influence of Product Quality and Delivery Services on e-trust and e-satisfaction in China.
No ethics committee approval was required for this article type.
Data Availability
Not applicable for this article.
How to Cite This Article
Udanee Samarasinghe. 2026. \u201cFactors Influencing Customer Loyalty in Online Groceries after COVID-19 in Sri Lanka\u201d. Global Journal of Management and Business Research - E: Marketing GJMBR-E Volume 22 (GJMBR Volume 22 Issue E2).
Explore published articles in an immersive Augmented Reality environment. Our platform converts research papers into interactive 3D books, allowing readers to view and interact with content using AR and VR compatible devices.
Your published article is automatically converted into a realistic 3D book. Flip through pages and read research papers in a more engaging and interactive format.
Our website is actively being updated, and changes may occur frequently. Please clear your browser cache if needed. For feedback or error reporting, please email [email protected]
Thank you for connecting with us. We will respond to you shortly.