The purpose of this research is to determine whether or not the money that Bangladeshi migrant workers send back to their families has an impact on the overall pace of economic growth in Bangladesh. The multiple regression model is used as an analytical technique in this study to estimate yearly timeseries data and parameters from 1999 to 2021. The study covers the time period from 1999 to 2021. The data from realworld applications provides credence to the theory that there is a significant and beneficial connection between the money that migrant workers send back to their families and the expansion of the economy. Other alterations in rules, such as those concerning gross capital creation and the size of the labor force, are also statistically significant. However, direct foreign investment is not included in these alterations. This article examines some significant research that demonstrates the significance of remittances sent by migrant workers as a means of contributing to the expansion of the economy. In addition, the length of the research, the estimating methodologies that were employed, as well as the variability of the controls, were all different from those that were used in prior studies. In conclusion, the empirical findings that have been developed are quite sound.
## I. INTRODUCTION
Bangladesh is a South Asian country with a low- and middle-income level. There are several problems in the country, including a lack of trust in the government and political instability. There are more people in Bangladesh than there are in any other country in the globe. As long as human resources are utilized, the public will profit. The country's population grew from 125 million in 1999 to 167 million in 2021, while the total number of people employed climbed from 45 million in 1999 to 57 million in 2021. (World Bank, 2021). Most of these workers should be hired so that they may benefit from the economic growth of the country and raise their own living standards. Because of Bangladesh's large and diverse workforce—which includes individuals with a variety of skill levels—the country has enormous potential as a labor market. Remittances to a country rise when a big number of employees leave the country. The inflow of money into Bangladesh is expanding on an annual basis. An essential role is played by Bangladesh in the growth of both immigrant families and the country itself by Bangladesh.
Bangladesh, like many poor nations, relies heavily on remittances for its economic growth. Balance of payments is maintained, foreign currency reserves are increased, and gross domestic product is increased (GDP). It has not only increased in volume, but also in terms of its part of the country's GDP (GDP).
Table 1: Top remittance receiving countries in the world in 2021
<table><tr><td>Country</td><td>Total Remittance Earnings (Billion US$)</td><td>Rank</td></tr><tr><td>India</td><td>83.1</td><td>1</td></tr><tr><td>China</td><td>59.5</td><td>2</td></tr><tr><td>Mexico</td><td>42.9</td><td>3</td></tr><tr><td>Philippines</td><td>34.9</td><td>4</td></tr><tr><td>Egypt</td><td>29.6</td><td>5</td></tr><tr><td>Pakistan</td><td>26.1</td><td>6</td></tr><tr><td>France</td><td>24.5</td><td>7</td></tr><tr><td>Bangladesh</td><td>21.8</td><td>8</td></tr><tr><td>Germany</td><td>17.9</td><td>9</td></tr><tr><td>Nigeria</td><td>17.2</td><td>10</td></tr></table>
Remittance data from the World Bank for the year 2021 is shown in Table 1. India is the world's leading recipient of remittances, receiving (83.1 billion in 2021. Bangladesh is now one of the highest-earning countries in the world and is building up its foreign currency reserves. According to the 2021 World Economic Forum, Bangladesh ranked eighth among the world's top ten most populous countries (World Bank, 2021e). This is Fig. 1. Bangladesh's remittances to other countries (1999-2021).
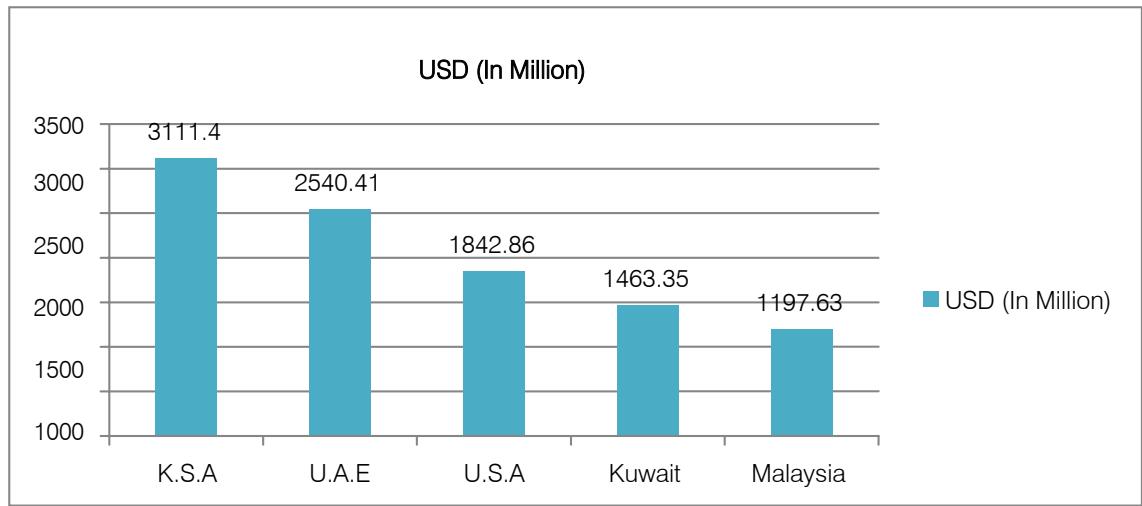 Fig. 1: Remittance inflows of Bangladesh: Top 5 Countries Received Source: Statistics Department, Bangladesh Bank.
Bangladesh earned $ 1.8 billion in 1999, according to Fig. 1. From the $ 21.8 billion in 2021, this is an almost nine-fold rise (World Bank, 2021). Between 1999 and 2021, remittances rose by 12.85%. But it has emerged that Bangladesh's remittances have varied over the past many years. To illustrate this volatility, the amount of remittances received by Bangladesh from its citizens fluctuated from $ 15.3 billion in 2015 to $ 14 billion in 2016. In order to deal with the rising number of shipments from other nations, additional attention must be taken. Bangladesh's remittance inflows from the top five countries are seen in Fig. 2 above. Foreign remittance from the Kingdom of Saudi Arabia (KSA) was $ 3111.4 million for Bangladesh in 2013. US$2540,41, 1842,86, 1463,35, and 1197,63 million in remittances from Kuwait and Malaysia round out the top five countries in terms of total remittances received.
Therefore, it is critical to examine the impact of payments on the household and the economy. As a result, this study aims to examine the link between remittances and the Bangladeshi economy.
### a) Research Objective
The objective of this study is to assess the relationship between remittance and economic development in Bangladesh. There are particular objectives that are also given below;
- To know about the GDP performance influenced by remittance in Bangladesh
- To identify the importance of remittance in Bangladesh
## II. LITERATURE REVIEW
This document analyzes remittances and Bangladesh's economic progress. Remittances have been extensively studied. Since the article is on economic growth, this part will only evaluate relevant papers. Arusha Cooray (2012) discovered that
immigrant wealth boosts economic growth in South Asia. Education and regional income growth show remittances' favorable influence on economic development. In 2010, Bichaka Fayissa and Christian Nsiah looked at how remittances affect economic growth and development in 36 African countries. Sending money can help the economy grow by giving people another way to use their money besides investing and by getting around liquidity problems. Nicholas P. Glytsos (2005) studied remittances' impact on growth. This research indicates national instability and uncertainty, with temporal and interstate changes in amounts. The data shows that changes in international priority and property expenses have an uneven effect. This means that the increased profit is less than the decreased loss. Gabriela Mundaca looked at remittances, the growth of financial markets, and economic growth in Latin America and the Caribbean in 2009. Remittances have been found to boost growth in the long term. Empirical studies show that financial intermediation tends to boost growth's ability to adapt to remittances. Esman Morekwa Nyamongo, Roseline N. Misati, Leonard Kipyegon, and Lydia Ndirangu studied the effects of remittances and financial development on economic growth in 36 African countries from 1980 to 2009. Using the group's econometric methodology, the study's major outcomes are: (1) remittance volatility tends to hurt Africa's future growth. Remittances enhance financial progress. (3) Financial development is less crucial in supporting economic growth in the nations investigated. Miguel D. Ramirez and Hari Sharma (2008) calculated remittances' influence on Latin American and Caribbean economies. Some panel unit root test macro variables The model includes the unit root; however, Pedroni's panel cointegration found a cointegration link between estimation model variables. FMOLS believes remittances boost both countries' economies. Remittances and financial development
factors interact to make remittances' influence stronger. Soma Rani Sutradhar (2020) used balanced panel data to evaluate the influence of workers' remittances on four South Asian rising nations from 1977 to 2016. The model estimates remittance's effect using pooled OLS, fixed effects, random effects, and dummy variables. Remittances hurt Bangladesh, Pakistan, and Sri Lanka's economies, according to empirical regression. Remittances boost India's economy. This study is clear and negative. According to Thomas H.W. Ziesemer (2011), indirect effects are only considered in the interaction term. The simulations with anti-contractual policies "only $50\%$ of remittances" or "no net migration anymore" reveal that remittances boost per capita GDP, investment, literacy, and growth rates. Negative impacts demonstrate that literacy and investment boost growth. Muhammad Azam (2015) looked at migrant workers' remittances and economic growth. This paper shows how migrant worker remittances boost economic growth. The study's control variables, time span, and estimating technique differ from earlier research. The empirical results are solid. Raju Jan Singh (2010) studied sub-Saharan remittances and their macroeconomic role. He collected the most complete set of data currently available on remittances in the region, including data for 36 countries from 1990 to 2008 and new data on the size and location of the diaspora. He found that although the effect of remittances on growth regression is negative, countries with good internal functioning seem to better unlock their potential. Remittances boost growth. The literature
above focuses on remittances of emerging economies. Positive, negative, mixed, and neutral impacts were identified. Most of these papers identified the combined or individual country effects. Both impacts weren't analyzed. Do more research. Payment has two main consequences:
## III. METHODOLOGY
The explanation of the sequence of the approach employed in this research is significant, and we will now examine any objections. The majority of the research employed panel data regression, although emerging or developing nations report on the disruption of remittances in terms of economic growth but not in their own sense. Utilizing time series data, investigate the effects of a particular nation. Using time series data, this study examines the link between remittances and economic development in Bangladesh. The F-test will be used to determine the importance of individual effects in concert.
### a) Data
The dataset created for this document contains five variables collected from the World Bank's World Development Indicators Database for 23 years in Bangladesh from 1999 to 2021. This data uses time series data in this analysis. This study uses four independent variables such as Worker's Remittance, Gross Fixed Capital Formation, Foreign Direct Investment, Labor Force and one dependent variable as Gross Domestic Product.
Table 2: Variable Description and Source Information
<table><tr><td>Variable Abbreviation</td><td>Variable Description and Source</td></tr><tr><td>GDP</td><td>Gross Domestic Product, measured in current US dollars in billions.From the 2021 World Bank Data Set.</td></tr><tr><td>REM</td><td>Worker's Remittance, net inflows measured in current US dollars in billions.From the 2021 World Bank Data Set.</td></tr><tr><td>GFCF</td><td>Gross Fixed Capital Formation, measured in current US dollars in billions.From the 2021 World Bank Data Set.</td></tr><tr><td>FDI</td><td>Foreign Direct Investment, net inflows (BOP current US dollars in billions).From the 2021 World Bank Data Set.</td></tr><tr><td>LF</td><td>Labor Force, total. Measured in billions. From the 2021 World Bank Data Set.</td></tr></table>
### b) Data Analysis Technique
Perform statistical measurements using STATA 14.2, MS Excel, MS Word, 2013 to evaluate the effectiveness and test the research hypotheses. The collected data were processed in a logical way and organized in tables for analysis. The relevant analysis is also presented in the Appendix. The formalized hypothesis was tested using the Student's t test at a significance level of $5\%$.
The study also uses descriptive statistical analysis to determine the relationship between GDP and remittance and uses skewness and kurtosis standards to test the normality of the data. Harris- Tzavalis unit root test and Hadri LM test were also used to determine the stationarity of the variables used.
The study also analyzes the degree of correlation between independent variables and the correlation matrix to estimate the desired result. The variation inflation factor is used to test multicollinearity problems. Breusch-Pagan / Cook-Weisberg test was used to test different variances.
### c) Hypothesis Development
The following research hypothesis has been formulated for testing;
#### Hypothesis
- $\checkmark$ $H_{0}$: There is no significant relationship between economic growth and remittance.
- $\checkmark$ $H_{1}$: There is positive significant relationship between economic growth and remittance.
## IV. EMPIRICAL FINDINGS
### a) Unit Root Test
Time series data are often assumed to be nonstationary, so a preliminary test must be performed to ensure that there is a stationary relationship between the variables to avoid the false regression problem. Stationary test of variables is the important part of the empirical analysis. In this study, unit root methods namely ADF (Augmented Dickey-Fuller) and PP (Phillips-Perron) are used. The ADF test and PP test statistic outcome of the time series data for the period, 1999 - 2021 shows that all-time series data are stationary at first and second difference at $5\%$ level of significance.
Table 3: Unit root test without difference
<table><tr><td>Variables</td><td colspan="4">Linear unit root tests</td></tr><tr><td></td><td>ADF</td><td>p-value</td><td>P-P</td><td>p-value</td></tr><tr><td>GDP</td><td>9.261</td><td>1.000</td><td>9.587</td><td>1.000</td></tr><tr><td>Worker's Remittance</td><td>-0.44</td><td>0.9032</td><td>-0.456</td><td>0.9004</td></tr><tr><td>Gross Fixed Capital Formation</td><td>13.443</td><td>1.000</td><td>17.853</td><td>1.000</td></tr><tr><td>Foreign Direct Investment</td><td>-0.76</td><td>0.8307</td><td>-0.274</td><td>0.9291</td></tr><tr><td>Labor Force</td><td>2.201</td><td>0.9989</td><td>1.678</td><td>0.9981</td></tr></table>
Interpretation
Using $5\%$ significance level, both tests provide that all the variables including dependent such as GDP and independent such as Worker's Remittance, Gross
Fixed Capital Formation, Foreign Direct Investment, and Labor Force are individually statistically insignificant without difference.
Table 4: Unit root test with difference
<table><tr><td>Variables</td><td colspan="4">Linear unit root tests</td></tr><tr><td></td><td>ADF</td><td>p-value</td><td>P-P</td><td>p-value</td></tr><tr><td>GDP</td><td>-4.696</td><td>0.0001**</td><td>-4.960</td><td>0.0000**</td></tr><tr><td>Worker's Remittance</td><td>-3.107</td><td>0.0261*</td><td>-3.009</td><td>0.0341*</td></tr><tr><td>Gross Fixed Capital Formation</td><td>-5.246</td><td>0.0000**</td><td>-5.596</td><td>0.0000**</td></tr><tr><td>Foreign Direct Investment</td><td>-6.865</td><td>0.0000*</td><td>-7.043</td><td>0.0000*</td></tr><tr><td>Labor Force</td><td>-4.539</td><td>0.0002*</td><td>-4.580</td><td>0.0001*</td></tr></table>
From the table, it is seen that the P-value of all the variables are less than.05. In both ADF and P-P test, worker's remittance, foreign direct investment and labor force time series data have become stationary after 1st difference at $5\%$ level of significance. And in both ADF
and P-P test, GDP and gross fixed capital formation time series data have become stationary after 2nd difference at $5\%$ level of significance.
This implies that, all the time series data taken from year 2000-2021 are stationary. This means the data are time dependent and does not contain unit root.
### b) Normality Test
In statistics, normality tests are used to determine if a data set is well-modeled by a normal
distribution and to compute how likely it is for a random variable underlying the data set to be normally distributed.
Table 5: Normality result
<table><tr><td></td><td>GDP</td><td>WorkersRem~e</td><td>GrossFixed~n</td><td>ForeignDir~t</td><td>LaborForce</td></tr><tr><td>Skewness</td><td>0.4654</td><td>0.8644</td><td>0.0370</td><td>0.3078</td><td>0.6356</td></tr><tr><td>Kurtosis</td><td>0.0806</td><td>0.0003</td><td>0.6499</td><td>0.0191</td><td>0.4797</td></tr></table>
## Interpretation
Skewness and kurtosis standards are explored to test data normality. Since some of the variables examined are not normally distributed due to heteroscedasticity. But this study normalized the distribution of data through winsorising (Dhaliwal et al.
### c) Heteroskedasticity Test
2012, p. 732; Artiach et al. 2010, p. 40). With Winsorising, the evaluated data are normally distributed, the skewness scores reach $\pm 1.96$ and the kurtosis coefficient in the range of $\pm 3$ (Haniffa and Hudaib 2006). The results are shown in Table, demonstrating the normal distribution of data.
Table 6: Heteroskedasticity result
<table><tr><td>Breusch-Pagan / Cook-Weisberg test</td><td>Cameron & Trivedi's decomposition of IM-test (White's test)</td></tr><tr><td>Ho: Constant variance
Variables: fitted values of PBT chi2(1) = 10.76
Prob > chi2 = 0.1010</td><td>Ho: homoskedasticity
against Ha: unrestricted heteroskedasticity
chi2(14) = 19.85
Prob > chi2 = 0.1350</td></tr></table>
## Interpretation
To test heteroscedasticity, the Breusch-Pagan / Cook- Weisberg test and the Cameron & Trivedi IM-test were used. The results are given above. Here, both tests
show Prob> chi2 = 0.1010 and Prob> chi2 = 0.1350, which means that Ho's decision is taken. As can be seen, prob> Chi2 is greater than 0.05, allowing the null hypothesis to show no threat of heteroscedasticity.
### d) Autocorrelation Test
Table 7: Autocorrelation result
<table><tr><td>Breusch-Godfrey LM test</td><td>Durbin's alternative test</td></tr><tr><td>H0: no serial correlation chi2 = 0.527
Prob > chi2 = 0.4679</td><td>H0: no serial correlation
chi2= 0.362
Prob > chi2 = 0.5474</td></tr></table>
#### Interpretation:
Both the Breusch-Godfrey LM test and Durbin's alternative test indicate that the absence of first order autocorrelation among the variables used in the model. In both cases the prob are.4679 and.5474 at.05 significance level. So we cannot reject the null hypothesis.
### e) Multicollinearity Test
Based on the normally distributed data, Table 8 examined the existence of multicollinearity between the independent variables.
Table 8: Multicollinearity Result
<table><tr><td>Variable</td><td>VIF</td><td>1/VIF</td></tr><tr><td>D Worker's Remittance</td><td>1.60</td><td>0.623409</td></tr><tr><td>DD Gross Fixed Capital Formation</td><td>1.40</td><td>0.712135</td></tr><tr><td>D Labor Force</td><td>1.15</td><td>0.871440</td></tr><tr><td>D Foreign Direct Investment</td><td>1.12</td><td>0.891867</td></tr><tr><td>Mean VIF</td><td>1.32</td><td></td></tr></table>
## Interpretation
Multicollinearity statistics is the reliable measure for calculating the validity of regression analysis and this is usually done through STATA. Using multicollinearity statistics, Variance Inflation Factor (VIF) and tolerance level were calculated. Results in Tab-V can be evaluated based on specific criteria. For example, Gujarati (2007) suggested that VIF values should be below 5 and 1 / VIF (or multicollinearity) values should be closer to zero. If these conditions are met then regression analysis is
considered valid. As shown in Tab-V that the variable VIF is below 5 and the value $1 / \mathrm{VIF}$ is also closer to zero. This indicates the absence of multicollinearity in regression analysis.
### f) Descriptive statistics
The table below presents the descriptive statistics for the variables in the study based on time series data from the year 1999 to 2021.
Table 9: Descriptive statistics result
<table><tr><td>Variable</td><td>GDP</td><td>WorkersRem~e</td><td>GrossFixed~n</td><td>ForeignDir~t</td><td>LaborForce</td></tr><tr><td>Mean</td><td>1.233444</td><td>0.7239474</td><td>0.4633889</td><td>0.1537895</td><td>.00012</td></tr><tr><td>Min</td><td>-8.641</td><td>-1.722</td><td>-2.602</td><td>-1.238</td><td>0.0001</td></tr><tr><td>Max</td><td>11.916</td><td>2.379</td><td>2.478</td><td>1.263</td><td>0.0003</td></tr><tr><td>Std. Dev.</td><td>4.521438</td><td>0.9592015</td><td>1.323003</td><td>0.6243133</td><td>0.0000562</td></tr><tr><td>Observation</td><td>21</td><td>22</td><td>21</td><td>22</td><td>22</td></tr></table>
## Interpretation
Table presents descriptive statistics of the variables as part of the model examined, including both dependent and independent variables across the 20 observations collected. Results in Table shows that the highest amount was 11.916 billion US$ on GDP, 2.379 billion US$ on Workers Remittance, 2.478 billion US$ on Gross Fixed Capital Formation, 1.263 billion US$ on Foreign Direct Investment and.0003 billion US$ on Labor Force from the year 1999 to 2018
### g) Pearson Correlation matrix
Following table displays the relationship between GDP and other independent variables. Pearson Correlation technique is employed for this mission, and these variables are examined at 5 percent significance level.
Table 10: Pearson correlation result
<table><tr><td></td><td>GDP</td><td>WorkersRem~e</td><td>GrossFixed~n</td><td>ForeignDir~t</td><td>LaborForce</td></tr><tr><td>GDP</td><td>1.0000</td><td></td><td></td><td></td><td></td></tr><tr><td>WorkersRem~e</td><td>-0.4250</td><td>1.0000</td><td></td><td></td><td></td></tr><tr><td>GrossFixed~n</td><td>0.9110</td><td>-0.5191</td><td>1.0000</td><td></td><td></td></tr><tr><td>ForeignDir~t</td><td>0.1395</td><td>0.2789</td><td>-0.0185</td><td>1.0000</td><td></td></tr><tr><td>LaborForce</td><td>0.0592</td><td>0.3187</td><td>0.2034</td><td>-0.1838</td><td>1.0000</td></tr></table>
The above table presents the correlation between GDP and other variables, where there is a negative association GDP and workers remittance. Moreover, there is no high correlation among independent variables. Labor Force have positive correlation with all except FDI. Therefore, it can be concluded that there is no multicollinearity problem in this analysis, which usually requires a correlation between independent variables of the order of 0.80 or higher.
### h) Regression Analysis
To examine the relationship between the economic growth and remittance, multiple regression analysis were analyzed in this analysis. The following table shows the result:
Table 11: Regression analysis result
<table><tr><td colspan="2">Variables</td><td>Coefficient</td><td>Std. Error</td><td>t-Statistic</td><td>Prob.</td></tr><tr><td colspan="2">_cons</td><td>2.890372</td><td>.366453</td><td>7.89</td><td>0.000</td></tr><tr><td colspan="2">WorkersRemittance</td><td>.0391636</td><td>..0082322</td><td>4.76</td><td>0.000</td></tr><tr><td colspan="2">GrossFixedCapitalFormation</td><td>.0105569</td><td>.0019205</td><td>5.50</td><td>0.000</td></tr><tr><td colspan="2">ForeignDirectInvestment</td><td>.0025482</td><td>.0263539</td><td>0.10</td><td>0.924</td></tr><tr><td colspan="2">LaborForce</td><td>187.6249</td><td>83.98918</td><td>2.23</td><td>0.041</td></tr><tr><td colspan="2">R-squared</td><td colspan="4">0.8647</td></tr><tr><td colspan="2">Adj R-squared</td><td colspan="4">0.8231</td></tr><tr><td>F(4, 13)</td><td colspan="2">20.78</td><td>Prob > F</td><td colspan="2">0.0001</td></tr></table>
### Interpretation
Table shows that if Workers Remittance is increased one unit, economic growth (GDP) is increased by.0391636. Again if Gross Fixed Capital Formation is increased one unit, economic growth (GDP) is increased by.0105569. Again if Foreign Direct Investment is increased one unit, economic growth (GDP) is increased.0025482 and if Labor Force is increased one unit, economic growth (GDP) is increased 187.6249. This implies that all independent variables have increased this in turn will have a significant impact on economic growth (GDP). However, the result shows that Workers Remittance, Gross Fixed Capita Formation and Labor Force are statistically significant to Bangladeshi gross domestic product at $5\%$ level of significance. That means that our null hypothesis is rejected, that implies those variables have significant impact on economic growth. On the other hand Foreign Direct Investment statistically insignificant to gross domestic product at $5\%$ level of significance. That means that we cannot reject the null hypothesis. But the model is overall significant with F-test. From the regression result the coefficient of determination, R2 (86%) shows the goodness of fit of the result and also indicates that eighty six percent of the variance in response variable can be explained by the explanatory variable. The remaining percent can be attributed to unknown.
### i) Johansen tests for co-integration
The equilibrium relationship between a set of variables means that their probabilistic trends must be related. We are trying to determine if there is a long-term equilibrium between the study variables. At that time, the Johansen co-integration test was used. This test identifies the number of long-term relationships that exist between a set of integrated variables. Trace statistics test the null hypothesis that there are up to $r$ co-integrated equations. Therefore, the rejection of the null hypothesis means that there is a co-integrating ratio greater than or equal to $r$.
Table 12: Co-integration result
<table><tr><td>Maximum rank</td><td>Trace statistic</td><td>5% critical value</td><td>Max statistic</td><td>5% critical value</td></tr><tr><td>None</td><td>141.2088*</td><td>68.52</td><td>70.8988*</td><td>33.46</td></tr><tr><td>At most 1</td><td>70.3100*</td><td>47.21</td><td>36.3513*</td><td>27.07</td></tr><tr><td>At most 2</td><td>33.9587*</td><td>29.68</td><td>25.6591*</td><td>20.97</td></tr><tr><td>At most 3</td><td>8.2996</td><td>15.41</td><td>5.7819</td><td>14.07</td></tr><tr><td>At most 4</td><td>2.5178</td><td>3.76</td><td>2.5178</td><td>3.76</td></tr></table>
From the table, trace statistics 141.2088 \*, 70.3100 * and 33.9587 * clearly exceed the critical values 68.52, 47.21 and 29.68, respectively, in the 95% confidence interval, so they do not accept the null hypothesis... Most of the two co-integrating relationships, and therefore long-term equilibrium relationships, exist between variables. The maximum statistics of eigenvalues 70.8988 \*, 36.3513 * and 25.6591 * also exceed the critical values 33.46, 27.07 and 20.97 with a confidence level of 95%, thus not accepting the null hypothesis of two relationships of agreement between the variables.
## V. CONCLUSION
In this research, Bangladesh's economic growth and development will be compared to those of other external sources of FDI, gross fixed capital creation, and labor power. The findings suggest that remittances have a favorable impact on economic growth. Based on yearly time-series data from 1999 to 2018, the conclusions are empirical. GDP per capita income rises by 3.9 percent for every additional worker. The results of the regression show that the money sent home by migrant workers has a big and positive effect on economic growth. There is a positive and considerable influence on economic growth from other control variables, such as GDPF and the labor force, excluding FDI. As a result, these findings back up the researchers' predictions. The consequences on domestic labor markets of mass migration to specialized sectors such as higher education, government services, research and technology, and construction and services may also be negative. It is mainly skilled employees that are difficult and costly to replace. Providing food, health care, and education for the children of migrants can help alleviate short-term fiscal constraints for families. Migrant workers' remittances have clearly helped developing countries. At the same time, it's being examined to see if it aids in the economic transformation and growth of the countries of origin of recent immigrants.
Generating HTML Viewer...
References
15 Cites in Article
Bichaka Fayissa,Christian Nsiah (2010). The Impact of Remittances on Economic Growth and Development in Africa.
R Looney (1990). Macroeconomic Impacts of Worker Remittances on Arab World Labor Exporting Countries.
Arusha Cooray (2012). The Impact of Migrant Remittances on Economic Growth: Evidence from South Asia.
Henrik Hansen,John Rand (2006). On the Causal Links Between FDI and Growth in Developing Countries.
R Singh,M Haacker,K-W Lee,M Le Goff (2010). Determinants and Macroeconomic Impact of Remittances in Sub-Saharan Africa.
Esman Nyamongo,Roseline Misati,Leonard Kipyegon,Lydia Ndirangu (2012). Remittances, financial development and economic growth in Africa.
Thomas Ziesemer (2012). Worker remittances, migration, accumulation and growth in poor developing countries: Survey and analysis of direct and indirect effects.
Catalina Amuedo-Dorantes,Susan Pozo (2004). Workers' Remittances and the Real Exchange Rate: A Paradox of Gifts.
Nicholas Glytsos (2005). The contribution of remittances to growth.
Paola Giuliano,Marta Ruiz-Arranz (2009). Remittances, financial development, and growth.
B Mundaca (2009). Remittances, Financial Market Development, and Economic Growth: The Case of Latin America and the Caribbean.
M Ramirez,H Sharma (2008). Remittances and growth in Latin America: a panel unit root and panel cointegration analysis.
Andrew Ojede,Eddery Lam,Nicholas Okot (2019). Identifying macro-determinants of remittance flows to a developing country: The case of Uganda.
Prasiddha Shakya,George Gonpu (2021). Impact of Remittances on Economic Growth in Nepal.
Jean Rasamoelison,Susan Averett,David Stifel (2021). International student-migrant flows and growth in low- and middle-income countries: brain gain or brain drain?.
No ethics committee approval was required for this article type.
Data Availability
Not applicable for this article.
How to Cite This Article
Mahadi Hasan,. 2026. \u201cThe Impact of Remittances from Overseas Workers on Economic Expansion at Home: Evidence from Bangladesh\u201d. Global Journal of Management and Business Research - B: Economic & Commerce GJMBR-B Volume 22 (GJMBR Volume 22 Issue B3).
Explore published articles in an immersive Augmented Reality environment. Our platform converts research papers into interactive 3D books, allowing readers to view and interact with content using AR and VR compatible devices.
Your published article is automatically converted into a realistic 3D book. Flip through pages and read research papers in a more engaging and interactive format.
Our website is actively being updated, and changes may occur frequently. Please clear your browser cache if needed. For feedback or error reporting, please email [email protected]
Thank you for connecting with us. We will respond to you shortly.