Recent platform frauds in the U.S. and other parts of the world raise skepticism about the viability of online marketplace lending (OML), a fast-growing new industry. In China, over onethird of peer-to-peer lending platforms have failed, many involve outright fraud. We find in the U.S., OML platforms profit from loan origination but do not bear borrower credit risk, giving rise to the incentive to overstate borrowers’ quality. In China, most OML platforms are “balance sheet lenders” but not subject to the banking regulations. Failure to control borrower credit risk and moral hazard lead to Ponzi Scheme-type platform-runs. Our comparative case study on Lending Club (NYSE: LC) versus Yirendai (NYSE: YRD), and empirical analysis of 735 OML plat-forms in China confirm these observations. We discuss regulatory responses and market-based solutions including leveraging users’ social networks in lending.
## I. INTRODUCTION
Access to credit plays a fundamental role to economic development. Online marketplace lending (OML) applies data and technology to allow multiple lenders to collectively fund a loan. In this process, the platform company acts as a marketplace, an identification agency, and a match-maker. OML initially emerged as "peer-to-peer" (P2P) marketplace, with platform companies enabling individual investors to provide financing to individual borrowers. As products and business models have evolved, the investor base has expanded to institutional investors and the borrower base has also expanded to small businesses (DOT (US Department of the Treasury) 2005).
However, increasing The essential selling point advanced by OML is the notion that by eliminating the "middle man" — the often-cumbersome commercial bank—investors can earn higher returns and borrowers can obtain financing at lower costs. However, increasing platform frauds have drawn skepticism in this new business model. In 2014, the NASDAQ listed, Sweden-based P2P company Trust buddy went bankrupt for misusing lenders' capital to finance bad debts. In May 2016, the Lending Club, an OML leader in the US, was found to have altered loan application information so as to sell loans upstream to Wall Street firms. The news caused Lending Cub's stock price to drop more than one-third in one day, and its CEO to step down (Corkery 2016). In the world's largest OML market—China, $^{i}$ 1,523 out of the 3,984 platforms (or $38.2\%$ ) established since 2010 have failed (Figure 1), with "fraud" cited as the top-ranked reason for platform failure. $^{ii}$
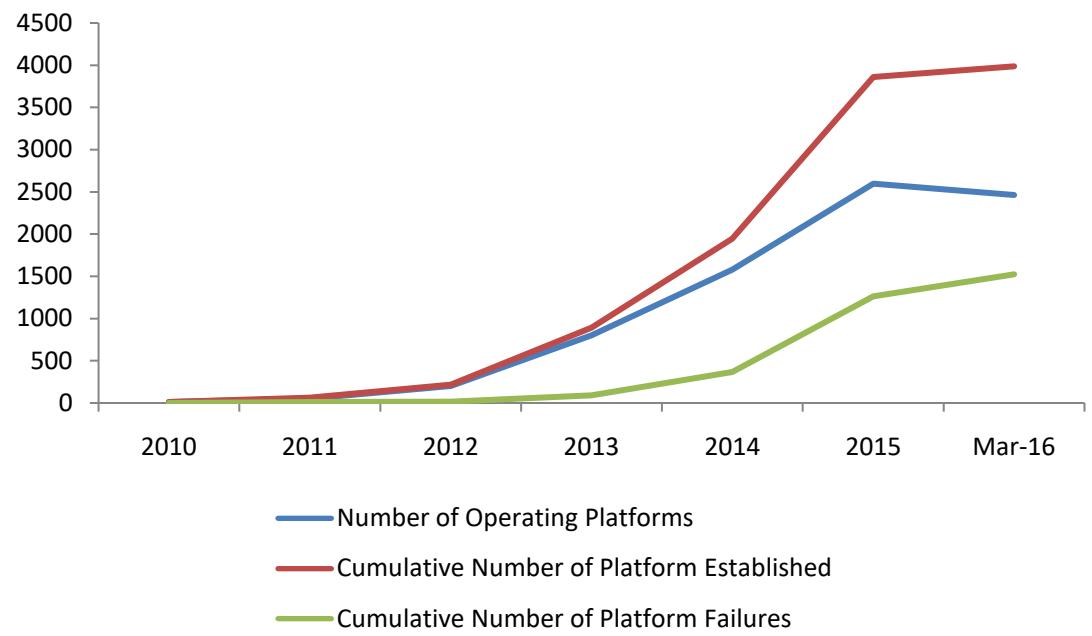 Figure 1: Online Marketplace Lending Platforms in China (2010-March 2016). Note: Data comes from Wangdaizhijia (wdzj.com)
This article asks two questions: (1) what leads to OML platform fraud in the US and China respectively? (2) how regulations and positive innovations should evolve to support the safe growth of OML? Our investigation reveals stark difference in the way OML is practiced in the US and China: Whilst most US platforms are "marketplace lenders" that do not bear borrower credit risk, most Chinese platforms are "balance sheet lenders" (shadow banks) that guarantee loan investors' returns. For marketplace lenders, fraud arises from their loan origination incentives that motivate misstatement in borrowers' quality in order to sell loans to individual and institutional investors. For balance sheet lenders, fraud arises from the misuse of loan investors' capital that mimics "Ponzi Schemes", leading to platform failure. Our empirical evidence of 735 (failed and normal operating) platforms in China confirms this proposition.
We see the need for enhanced transparency as essential to the safe growth of OML industry. Both borrowers and investors rely on platforms to mitigate information asymmetry, while platforms have incentives to exploit their information advantage. Hence, regulations that require greater transparency on all market participants and processes are vital for fraud detection. Though OML platforms increasingly rely on proprietary credit scoring models that use new data sources and complex algorithms, we highlight the need to monitor their transparency. Finally, we evaluate a positive innovation that leverages users' social capital and networks for loan origination and credit risk control in OML.
The rest of this paper proceeds as follows: Section 2 illustrates the origins of frauds in OML and how they lead to platform failure. Section 3 is a comparative case study of Lending Club versus Yirendai, both of which are NYSE-listed and OML market leaders in the US and China respectively. Section 4 presents an empirical analysis of 735 (failed and normal operating) OML platforms in China to shed light on causes of platform failure. Section 5 analyzes the OML regulatory framework in the US and China, and discusses a positive innovation that leverages users' social networks in OML. Section 6 concludes with managerial implications.
## II. ADVERSE SELECTION IN ONLINE MARKETPLACE LENDING
Akerlof (1970) shows how adverse selection between sellers and buyers in the used car market leads to market failure. In the credit market, borrowers know more about their capability and willingness to repay loans than lenders. The information asymmetry is magnified in an online environment, where no face-to-face interaction between lenders and borrowers is required. If lenders are unable to distinguish high quality from low quality borrowers, they are only willing to bid at "average" interest rates. This benefits only low quality borrowers, causing high quality borrowers to withdraw. Knowing only low quality borrowers are in the market, risk-averse lenders also withdraw, leading to market failure. This proposition echoes a common perception that OML has become one of the "fringe" credit options for higher-risk borrowers who are increasingly turned away by risk-adverse traditional lending institutions (Chaffee and Rapp 2012).
But OML needs not to be a "lemon's market". The opportunity for OML lies in its potential to extend access to credit to historically underserved market segments, as long as there are credible signals on borrowers' quality. In the US, where the consumer credit system is more developed, OML platforms determine credit risk primarily based on borrowers' FICO score,[iii] supplemented by other sources of "hard" information.[iv]
OML platforms, as core information intermediaries, are responsible for information processing (identification, verification, screening and monitoring) on borrowers' credit risk. In practice, investors in OML cannot see borrowers' FICO scores directly. Instead, they make investment decisions based on the "loan grade" that platforms assign to each borrower. Higher loan grade borrowers attract more biddings and their loans have higher chance of being funded. Loans comprise prime borrowers are also easier to be securitized and sold to institutional investors.
The bulk of business revenue of OML platforms comes from volume-based "transaction fee" for each successful loan origination. Unlike banks, "marketplace lender" platforms do not assume borrower credit risk but can take the upside of more loans facilitated. This creates incentives to overstate borrowers' quality for loan origination. This is a fraud on investors, for loans that do not meet investors' criteria are "packaged" and sold to loan investors. The Lending Club scandal confirms this practice: to sell a $22 million sub-prime loan to a Wall Street investment bank, the Lending Club knowingly altered borrowers' information to make them conform to investor's explicit instructions (Dayen 2016).
The common defense of OML platforms is that they rely on quantitatively complex credit scoring models (CSM) for credit rationing. These models allegedly assign borrower's loan grade based on objective "hard" information such as FICO score. However, a recent report by the US Department of the Treasury on OML expresses skepticism. In its words, "the use of new variables and more complex algorithms in CSM has the potential to create both new opportunities and new risks. The extent to which the benefits will materialize remains uncertain given that limited public research exists on these topics. This is partly because CSM are proprietary and data sources are expensive to construct or not available to outside researchers." (DOT 2016)
Indeed, recent evidences show that bank incentives induced by loan origination can alter the link between FICO score and default rates (Rajan, Seru and Vig 2015). Using a unique dataset from a major European bank, Berg, Puri and Rocholl (2016) show loan officer incentives significantly skew ratings even if the quantitative model is correct and there is no subjectivity in the system. In other words, economic incentives can override complicated quantitative models. This problem is particularly pronounced in countries where reliable hard information on borrower's
quality is unavailable and substantial discretion is exercised by "line officers" whose performance is linked to the volume of loans originated.
Other anecdotal evidence reveals that OML platforms do not verify information submitted by borrowers a large portion of time and when they do verify, the information is often inaccurate (Lieber 2011). The direct consequence is borrower delinquency. In case of default, lenders have no direct recourse with the borrower, $^{v}$ and have to rely completely on the effort of the platform or their designees for collection, which platforms are notoriously bad at doing. $^{vi}$
## III. HOW OML PLATFORMS BECOME "PONZI SCHEMES"?
Borrower delinquency should have little impact on platform failure as long as the platform is only a "marketplace" that does not assume credit risk, as the case of most US OML platforms. However, in China where the consumer credit system is rudimentary and legal protection for investors is weak, most OML platforms guarantee investors' returns and promise investors' right of withdrawal. These platforms operate like "shadow banks" and holding loans on its balance sheet, but they do not have licenses for lending, nor are they subject to current regulation and supervision that applies to financial institutions.
A typical platform failure starts with borrowers' delinquencies causing losses to investors. Having promised investors certain returns, the platform has to use its own capital to compensate investors. When more delinquencies drain the platform's capital, in order to sustain operation, the platform has to use new investors' funds to pay back existing ones, leading to Ponzi Scheme-like fraud. Even worse, when new investors' funds are insufficient to repay existing ones, any default on existing investors creates panic among others, causing other investors to withdraw their funds. This creates a situation similar to a bank run, causing the platform to fail. For example, the collapse of Beijing-based P2P platform EZubo in 2015 was described by the Wall Street Journal as a “$7.6 billion Ponzi Scheme" that defrauded over 900,000 loan investors.[VII] In 2016, Shanghai-based P2P platform Zhongjin closed down with missing funds of $ 4.6 billion, affecting over 130,000 investors (Ren 2016). Since December 2015, regulatory authorities in Beijing, Shanghai and Guangzhou have suspended registration of any new OML firms and started cracking down fraudulent operators.
It was not uncommon to see that some Chinese OML platforms were created as a sham to defraud loan investors. Fake projects and fake borrowers' information are listed on the platform to attract investors. Loan investors thought their funds are lent to a particular project but in fact they are transferred to accounts of the operator or his affiliated firms, commonly referred to as
"self-financing" in OML. In the well-known "Deng Liang and Oriental Ventures" case of 2014, Deng set up a Shenzhen-based OML platform ("Oriental Ventures"). The platform promised an annual return of 36-45% and attracted over ¥126 million ($ 19.4 million) in funding from investors. Instead of being passed to actual borrowers, the funds were deposited into Deng's personal accounts and used to purchase real estate. Eventually Deng was convicted for violating Article 176 of the Criminal Law of China on "illegal public fund raising" by the Shenzhen-Luohu District Court. This case is known as the first criminal sanction on Chinese OML platforms.
## IV. LENDING CLUB VS. YIRENDAI: A COMPARATIVE CASE STUDY
This section compares two NYSE-listed OML companies to substantiate our arguments: Lending Club (www.lendingclub.com) is the largest OML platform in the US. Yirendai (www.yirendai.com) is one of China's OML market leaders and the first to go public in the US in December 2015. Unless otherwise specified, information on the Lending Club (hereafter "LC") is extracted from its 10-K filing and information on Yirendai (hereafter "YRD") is extracted from its F-1 filing and F-20 filing.
YRD and LC have similar mission statement, that is to "make credit more affordable and investing more rewarding". Both companies focus on their domestic market. Each unit of loan investment on YRD is ¥ 100 ($16.1) and $25 on LC. Both companies' revenue comes from "transaction fees" charged to borrowers and "service fees" charged to loan investors. The transaction fee LC charges its borrowers is equal to 1-6% of loan amount (varies on borrowers' loan grade), and the service fee to lenders is 0.7-1.5% of actual investment return. In comparison, YRD charges much higher fees: 5.6-28.2% for borrowers and 0.2-5.9% for lenders. This fee structure translates into a total cost of borrowing on YRD 16.9-39.5% per annum, much higher than the 14-20% on LC. Loan investors' historical return on YRD averages 6.6-11.25% per annum, lower than the average 11% for LC.
How do the two platforms address the adverse selection problems? LC reported to have the following measures in place: First, its Standard Loan Program (3- or 5-year term loans) are offered only to borrowers with a FICO score of 660 or above. xili LC uses its own proprietary credit scoring model, which as signs loan grade to borrowers based on their FICO score and other consumer information. In its 2014 report, LC reported that it spent $34.7 million in engineering and product development expense to improve the accuracy of its credit scoring and fraud detection system, a $150%$ increase from 2013. Albeit undeveloped, loan investors can sell their notes issued by LC before maturity through
a secondary market operated by an unaffiliated registered broker-dealer.
In comparison, YRD's strategy is to target "prime borrowers, comprising credit card holders with salary income". Information that borrowers need to submit to YRD include copy of PRC identity card, personal and employer contact details, bank account information, credit card number and consent for YRD to request a credit report of the borrower from the People's Bank of China (PBOC).<sup>x</sup> The challenge is that there is lack of an integrated individual credit score similar to FICO in China. The PBOC's personal credit system is in its infancy and it is doubtful whether the platform checks individuals' credit reports at all.<sup>x</sup> Though YRD claims its proprietary credit scoring system also assesses each borrower based on his or her past records on YRD, plus other evidence from public security bureau, courts, and the borrower's E-commerce track records, these are largely ineffective. The reason is that there is no personal bankruptcy law in China, public bodies and private E-Commerce sites maintain their own record system and there is little sharing of data. It is costly, if not impossible, to get an effective picture on a borrower's credit history. Other risk control employed by YRD includes a rule that the same borrower cannot have multiple concurrent loans originated on its platform. This can be ineffective because the same borrower might have outstanding loans on another lending platform, which YRD has no information on. Finally, YRD maintains a secondary market of loans originated on its platform.
One way to test the "fairness" of the loan grade assigned by each platform is to examine the ex post net charge-off rate, calculated as the total charge-off amount divided by the total amount of corresponding loans, for each borrower loan grade. Intuitively, if the credit rationing of the platform is accurate, then the ex post net charge-off rate should increase monotonically from the highest grade to the lowest grade borrowers. Deviations from this pattern would suggest irregularities in credit rationing.
Figure 2 plots the net charge-off rate for loans of different borrower grade on YRD and LC from 2013 to 2015. We see stark differences: while on LC the net charge-off rate increase monotonically from $0.98\%$ for A-grade-borrowers to $14.11\%$ for FG grade-borrowers, the pattern is opposite for YRD. On YRD, A-grade-borrowers have net charge-off rate of $4.35\%$, significantly higher than all other grade borrowers. This irregularity can be a result of deficiencies in YRD's credit scoring model given the shortage of reliable hard information. But it certainly means many low-quality borrowers that do not deserve A-grade are given A-grade and sold to loan investors.
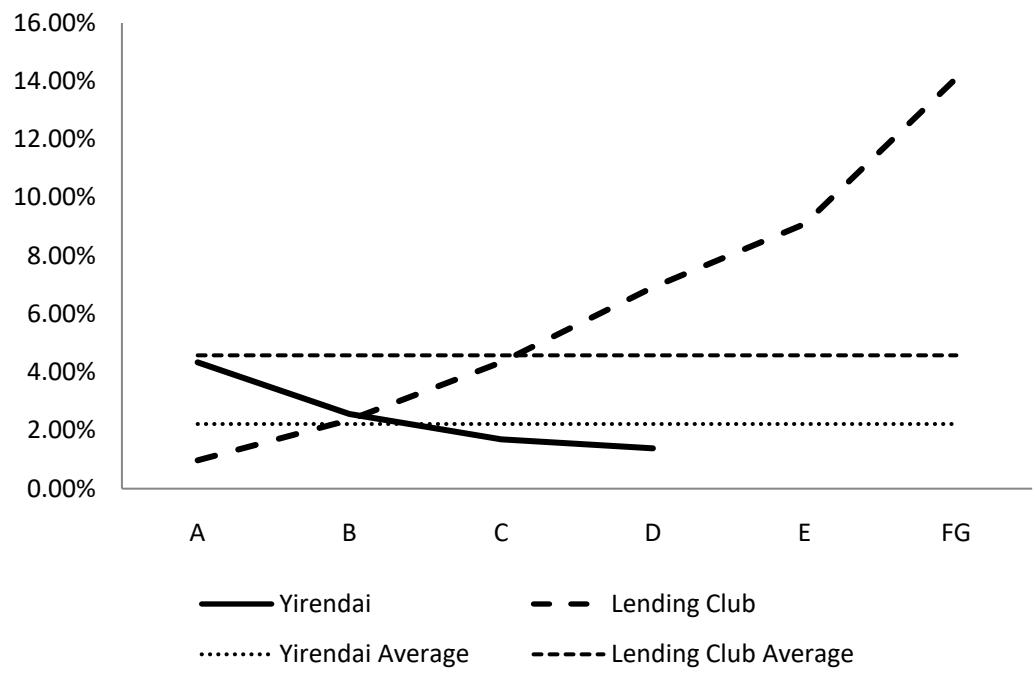 Figure 2: Total Net Charge-off Rate of Loans Initiated in 2013 to 2015. Note: Data come from Yirendai's F-20 filling for FY2015 on EDGAR and Lending Club's website (https://www.lendingclub.com/info/demand-and-credit-profile.action). The total net charge-off rate of each investment grade is calculated as the total net charge-off amount of that grade's loans initiated in 2013 to 2015 divided by the total amount of corresponding loans. Yirendai has four investment grades (A, B, C, D) with Grade A representing the lowest default risk and Grade D representing the highest default risk. Lending Club has seven grades with Grade A representing the lowest default risk and Grade G representing the highest default risk.
Finally, we investigate the credit risk assumption in the US and Chinese OML platforms. In the US, LC issues notes as a means to allow lenders to invest in the loans,[xvij] however it makes clear that the platform "does not assume any credit risk and the lenders can only receive the actual amount received by the Lending Club from the borrower, subtracting the service fees". In cases of default, LC can pursue collection efforts on lenders' behalf, subject to additional service charge.
YRD, on the other hand, adopts a "risk reserve fund" to provide guarantee on both principals and returns of investors. It discloses that the company has set up a provisional fund with a custodian bank. For each loan successfully originated on its platform, the company adds to the provisional fund an amount equal to a pre-determined percentage of the loan amount. This guarantee is not free: YRD charges each loan investor $10\%$ of their monthly interest return for this compulsory service.
## V. SOURCES OF CHINESE OML PLATFORM FAILURE: EMPIRICAL ANALYSIS
This section employs a unique proprietary dataset to study the Chinese OML industry. Our objective is to systematically compare characteristics of "failed" and "normal operating" platforms, and draw inferences about factors that can predict platform failure. This
exercise is useful for managers and regulators to identify fraud risk and monitor platforms on a timely basis. Data are obtained from Wangdaizhijia (http://www.wdzj.com), China's leading OML monitoring and research institute.
A few other empirical studies use transactional data from one platform (e.g. Prosper, LC, or PPDai) to study the P2P lending market, and their key variables of interest are loan accessibility, pricing terms, and borrower default rate.<sup>xvii</sup> Our study differs from theirs in that we study platform failure risk, and our data contain platform-level characteristics at monthly frequency. We use monthly data because OML in China has only a recent origin since 2010, and most OML platforms were set up after 2013. Moreover, a non-trivial number of platforms failed within one year, thus using platform-month as unit of observation allows us to capture the true picture of Chinese OML industry.
Our sample comprises 735 unique platforms and 9,556 platform-month observations with complete variables data from 2011 to 2015. Of the 735 platforms, 476 failed at different stages during the sample period. Although our sample does not cover all the platforms, it is by far the most comprehensive and complete record of platform level data on China's OML market.
Table 1 presents the distribution of our sample. Panel A presents the provincial distribution, and Panel B presents the yearly distribution. Over a quarter of our
observations come from Guangdong province. In terms of absolute number of failures, Shandong, Guangdong and Zhejiang ranked top three. In terms of failure rate, Hainan, Shandong and Jilin are the three highest provinces.
Most of observations are in 2014 and 2015. The number of observations increases monotonically with
time before 2014, and decreases slightly due to massive platform failures in 2015. The failed platform-months account for $4.98\%$ of the sample. Over a half of the failures occurred in 2015.
Table 1: Sample Distribution
<table><tr><td colspan="5">Panel A Provincial Distribution</td></tr><tr><td>Province</td><td>Obs.</td><td>% of Total Obs.</td><td>No. of Failures</td><td>Failure Rate</td></tr><tr><td>Anhui</td><td>278</td><td>2.91%</td><td>22</td><td>7.91%</td></tr><tr><td>Beijing</td><td>1264</td><td>13.23%</td><td>21</td><td>1.66%</td></tr><tr><td>Chongqing</td><td>167</td><td>1.75%</td><td>9</td><td>5.39%</td></tr><tr><td>Fujian</td><td>252</td><td>2.64%</td><td>15</td><td>5.95%</td></tr><tr><td>Guangdong</td><td>2439</td><td>25.52%</td><td>73</td><td>2.99%</td></tr><tr><td>Guangxi</td><td>89</td><td>0.93%</td><td>7</td><td>7.87%</td></tr><tr><td>Guizhou</td><td>133</td><td>1.39%</td><td>5</td><td>3.76%</td></tr><tr><td>Hainan</td><td>20</td><td>0.21%</td><td>3</td><td>15.00%</td></tr><tr><td>Hebei</td><td>73</td><td>0.76%</td><td>5</td><td>6.85%</td></tr><tr><td>Heilongjiang</td><td>25</td><td>0.26%</td><td>1</td><td>4.00%</td></tr><tr><td>Henan</td><td>145</td><td>1.52%</td><td>10</td><td>6.90%</td></tr><tr><td>Hubei</td><td>346</td><td>3.62%</td><td>10</td><td>2.89%</td></tr><tr><td>Hunan</td><td>208</td><td>2.18%</td><td>20</td><td>9.62%</td></tr><tr><td>Inner Meng.</td><td>31</td><td>0.32%</td><td>2</td><td>6.45%</td></tr><tr><td>Jiangsu</td><td>467</td><td>4.89%</td><td>28</td><td>6.00%</td></tr><tr><td>Jiangxi</td><td>229</td><td>2.40%</td><td>7</td><td>3.06%</td></tr><tr><td>Jilin</td><td>14</td><td>0.15%</td><td>2</td><td>14.29%</td></tr><tr><td>Liaoning</td><td>44</td><td>0.46%</td><td>2</td><td>4.55%</td></tr><tr><td>Ningxia</td><td>20</td><td>0.21%</td><td>0</td><td>0.00%</td></tr><tr><td>Shandong</td><td>857</td><td>8.97%</td><td>124</td><td>14.47%</td></tr><tr><td>Shanghai</td><td>802</td><td>8.39%</td><td>22</td><td>2.74%</td></tr><tr><td>Shanx</td><td>52</td><td>0.54%</td><td>1</td><td>1.92%</td></tr><tr><td>Shanxi</td><td>40</td><td>0.42%</td><td>1</td><td>2.50%</td></tr><tr><td>Sichuan</td><td>457</td><td>4.78%</td><td>21</td><td>4.60%</td></tr><tr><td>Tianjin</td><td>37</td><td>0.39%</td><td>4</td><td>10.81%</td></tr><tr><td>Yunnan</td><td>46</td><td>0.48%</td><td>0</td><td>0.00%</td></tr><tr><td>Zhejiang</td><td>1021</td><td>10.68%</td><td>61</td><td>5.97%</td></tr><tr><td>Total</td><td>9556</td><td>100.00%</td><td>476</td><td>4.98%</td></tr></table>
Panel B Yearly Distribution
<table><tr><td>Year</td><td>Obs.</td><td>% of Total Obs.</td><td>No. of Failures</td><td>Failure Rate</td></tr><tr><td>2011</td><td>29</td><td>0.30%</td><td>7</td><td>24.14%</td></tr><tr><td>2012</td><td>136</td><td>1.42%</td><td>12</td><td>8.82%</td></tr><tr><td>2013</td><td>465</td><td>4.87%</td><td>12</td><td>2.58%</td></tr><tr><td>2014</td><td>4560</td><td>47.72%</td><td>181</td><td>3.97%</td></tr><tr><td>2015</td><td>4366</td><td>45.69%</td><td>264</td><td>6.05%</td></tr><tr><td>Total</td><td>9556</td><td>100.00%</td><td>476</td><td>4.98%</td></tr></table>
Table 2 displays the summary statistics of our sample. The mean of average interest rate for a platform-month is 20.92% with the upper quartile of average interest rate 24.84%. The mean of average loan maturity is 3.57 months, and three fourths of the platform-months have average maturity less than 5 months. This maturity is substantially shorter than the 3-5 years term loans offered in major US OML platforms such as Lending Club and Prosper. Each month, average number of loans initiated is 1,592 and the number of loans outstanding is 1,089. The mean of monthly volume is over ¥81 million ($ 12.46 million), with an average net inflow of ¥19 million ($ 2.92 million). The median amount of loan outstanding is ¥224 million ($ 34.46 million). In terms of bidders and borrowers, the average number of bidders (2,283) for each platform/month is 5.32 times that of the borrowers (429). Also, on the borrower side, the top ten borrowers dominate over half of the loans outstanding, revealing significant risk of under-diversification; on the bidder side, the top ten bidders account for one third of the investment.
Table 2: Summary Statistics
<table><tr><td>Variable</td><td>Mean</td><td>STD</td><td>Max</td><td>P75</td><td>Median</td><td>P25</td><td>Min</td></tr><tr><td>M. Volume (in mm)</td><td>81.08</td><td>432.85</td><td>16,232.00</td><td>42.51</td><td>14.01</td><td>4.55</td><td>0.00</td></tr><tr><td>M. Net Inflow (in mm)</td><td>19.49</td><td>108.68</td><td>3,846.24</td><td>6.59</td><td>0.53</td><td>0.00</td><td>-648.19</td></tr><tr><td>Loan Outst.Amt. (in mm)</td><td>224.73</td><td>1,280.85</td><td>68,834.03</td><td>104.58</td><td>27.62</td><td>7.97</td><td>0.00</td></tr><tr><td>Avg. Bidding Size (in mm)</td><td>1.46</td><td>66.44</td><td>6,530.75</td><td>0.08</td><td>0.04</td><td>0.02</td><td>0.00</td></tr><tr><td>Top 10 Investor Prop.</td><td>0.35</td><td>0.26</td><td>1.00</td><td>0.51</td><td>0.30</td><td>0.15</td><td>0.00</td></tr><tr><td>Loan Outst. Number</td><td>1,089</td><td>13,324</td><td>709,484</td><td>97</td><td>29</td><td>7</td><td>0</td></tr><tr><td>Top 10 Borrower Prop.</td><td>0.58</td><td>0.35</td><td>1.00</td><td>0.97</td><td>0.61</td><td>0.29</td><td>0.00</td></tr><tr><td>M. Loan Number</td><td>1,592</td><td>20,687</td><td>1,428,697</td><td>176</td><td>67</td><td>26</td><td>1</td></tr><tr><td>M. Avg. Loan maturity</td><td>3.57</td><td>4.07</td><td>61.02</td><td>4.10</td><td>2.37</td><td>1.40</td><td>0.00</td></tr><tr><td>M. Avg. Interest Rate (%)</td><td>20.92</td><td>19.34</td><td>1599.07</td><td>24.84</td><td>18.00</td><td>13.68</td><td>0.00</td></tr><tr><td>M. Bidder Number</td><td>2283</td><td>10225</td><td>369343</td><td>1010</td><td>283</td><td>92</td><td>0</td></tr><tr><td>M. Borrower Number</td><td>429</td><td>3534</td><td>112726</td><td>53</td><td>17</td><td>5</td><td>1</td></tr></table>
To compare characteristics of failed and normal platforms, we conduct three groups of T-tests, which are summarized in Table 3. Panel A of Table 3 reports the comparison between the observations that are one-month before platform failure and the rest observations. The one-month pre-failure observations had lower monthly net inflow (t=-10.57), loan outstanding number (t=-7.69), monthly loan number (t=-7.05), and monthly borrower number (t=-11.25), and higher top investor proportions (t=5.96). Panel B reports the comparison between the observations that are within 6 months before platform failure and the rest observations. On top of Panel A, the semi-year pre-failure observations display even more concentrated operating figures, and monthly volume $(t = -3.10)$, loan maturity $(t = -17.89)$, interest rate $(t = 10.08)$ and monthly bidder number $(t = -6.32)$ become significant differences between failed and normal platforms. Panel C reports the comparison between the observations of failure platforms and the rest of observations, and display more significant differences on the basis of Panel B. In sum, from Panel A to Panel C, we conclude that failed platforms are more inactive (in terms of borrower, bidder and loan number), have higher under-diversification risk (in terms of the% of top 10 borrowers and investors), lower loan maturity and higher interest rate than normal platforms.
Table 3: Characteristics of Failure Firms and Non-Failure Platforms
<table><tr><td></td><td colspan="3">Panel A
1-Month Pre-Failure Obs. vs. Other Obs.</td><td colspan="3">Panel B
6 Months' Pre-Failure Obs. vs. Other Obs.</td><td colspan="3">Panel C
Failed-Platform Obs. vs. Normal Platform Obs.</td></tr><tr><td></td><td>(1)</td><td>(2)</td><td>(1)-(2)</td><td>(3)</td><td>(4)</td><td>(3)-(4)</td><td>(5)</td><td>(6)</td><td>(5)-(6)</td></tr><tr><td>M. Volume (in mm)</td><td>47.14</td><td>82.83</td><td>-35.69</td><td>48.05</td><td>90.89</td><td>-42.84***</td><td>48.05</td><td>113.53</td><td>-65.48***</td></tr><tr><td>M. Net Inflow (in mm)</td><td>1.46</td><td>19.89</td><td>-18.43***</td><td>2.96</td><td>24.40</td><td>-21.44***</td><td>3.36</td><td>30.82</td><td>-27.46***</td></tr><tr><td>Loan Outst.Amt. (in mm)</td><td>195.70</td><td>226.85</td><td>-31.15</td><td>163.06</td><td>243.03</td><td>-79.97*</td><td>114.45</td><td>309.38</td><td>-194.93***</td></tr><tr><td>Avg. Bidding Size (in mm)</td><td>1.21</td><td>1.50</td><td>-0.29</td><td>4.47</td><td>0.56</td><td>3.91</td><td>3.33</td><td>0.08</td><td>3.24**</td></tr><tr><td>Top 10 Investor Prop. (%)</td><td>42.73</td><td>34.70</td><td>8.03***</td><td>40.37</td><td>33.46</td><td>6.91***</td><td>38.95</td><td>32.17</td><td>6.78***</td></tr><tr><td>Loan Outst. Number</td><td>46</td><td>1161</td><td>-1114***</td><td>43</td><td>1400</td><td>-1357***</td><td>46</td><td>1909</td><td>-1863***</td></tr><tr><td>Top 10 Borrower Prop. (%)</td><td>63.50</td><td>58.28</td><td>5.22***</td><td>61.02</td><td>57.72</td><td>3.30***</td><td>60.04</td><td>57.40</td><td>2.64***</td></tr><tr><td>M. Loan Number</td><td>75</td><td>1652</td><td>-1577***</td><td>101</td><td>2034</td><td>-1933***</td><td>122</td><td>2675</td><td>-2553***</td></tr><tr><td>M. Avg. Loan maturity</td><td>3.09</td><td>3.55</td><td>-0.46**</td><td>2.54</td><td>3.87</td><td>-1.33***</td><td>2.55</td><td>4.27</td><td>-1.72***</td></tr><tr><td>M. Avg. Interest Rate (%)</td><td>23.76</td><td>20.87</td><td>2.89***</td><td>26.84</td><td>19.16</td><td>7.68***</td><td>27.56</td><td>16.04</td><td>11.52***</td></tr><tr><td>M. Bidder Number</td><td>1059</td><td>2348</td><td>-1289</td><td>890</td><td>2696</td><td>-1807***</td><td>677</td><td>3503</td><td>-2826***</td></tr><tr><td>M. Borrower Number</td><td>18</td><td>449</td><td>-432***</td><td>21</td><td>551</td><td>-529***</td><td>25</td><td>733</td><td>-708***</td></tr><tr><td>No. of Obs.</td><td>476</td><td>9080</td><td></td><td>2232</td><td>7324</td><td></td><td>4122</td><td>5434</td><td></td></tr></table>
These results echo many anecdotal evidence on the Chinese OML platform fraud that includes "self-finance" and misuse of investors' funds. We show failed platforms are on average smaller, less active, and tend to offer shorter-maturity loans but higher interest rates to attract investors. On the other hand, these platforms have highly concentrated investor base and large borrowers, exhibiting high under-diversification risk. Most platform failures occurred in 2015 following the Chinese stock market crash and economic downturn, consistent with the interpretation that Chinese OML platforms are "shadow banks" that are very much vulnerable to negative economic shocks.
## VI. REGULATORY FRAMEWORK
In the US, OML involves multiple oversight agencies. Borrowers on the platforms are protected by the usury law and extensive banking regulations.[xviii] Loan investors on the platforms are protected by federal security regulations.[xx] At state level, OML is also actively regulated. Some states prohibit platforms from soliciting investors in their states.[xx] Some states have no restriction, and others allow solicitation but only to "accredited" investors. Moreover, Section 989F of the Dodd-Frank Act mandates that the Comptroller General and the US Government Accountability Office (GAO) conduct a study to "determine the optimal Federal regulatory structure" for OML (GAO 2011).
In China, before 2015 there is no special regulation for OML: peer-to-peer lending related disputes fall under the usury law.[xxi] Which are treated as civil contracts between lenders and borrowers,[xxii] with the platform often jointly liable as a guarantor.[xxiii] Platforms that were set up as a sham to solicit funds from loan investors is a criminal offence under the Article 176 of the Criminal Law.[xxiv]
The years 2014 and 2015 witnessed a massive scale of platform failures in China, including several headline scandals. Each failed platform affected large numbers of loan investors, which became sources of social instability. This propelled several important measures directly regulating the OML sector. The first was "Guiding Opinions on Fintech" issued jointly by ten Chinese ministries in July 2015. This policy set guidelines for the safe development of China's Fintech industry. It covers not only OML, but also equity crowd funding, internet payment, the online sale of investment funds, insurance, and other financial products. Specifically, it requires OML platforms to "clarify their role as information intermediaries", "not engage in illegal fund raising", and for the first time designate the Central Bank Regulatory Commission of China (CBRC) to be the principal regulator of OML.
In December 2015, the CBRC publicized "Drafted Rules on the Regulation of Online Marketplace Lending Operators" ("Drafted Rules") for public consultation.[xxvi] This 47-article Drafted Rules is seen as setting the regulatory framework of China's OML industry (WSJ 2015). It has two primary objectives: (1) To require all OML companies to redefine their role as "information intermediary" as opposed to "financial intermediary". Platforms are prohibited from receiving deposits, pooling capital, and offering guarantee on investor return; (2) To improve transparency by requiring the minimum disclosures on borrowers, platforms, and loan level information.
Specifically, the Drafted Rules requires each platform to register with the local financial authority and publicize its operational statistics on the site. It also sets the minimum disclosure requirements regarding borrower information that must be made available to lenders.[xxvii] It defines "qualified investors" and stipulates both borrowers' and loan investors' undertakings.[xxviii] Each platform is mandated to screen and verify borrower's information,[xxix] and to provide sufficient risk warning on its site and contracts, which must be "accepted" by the investors.[xxx]
The Drafted Rules also adopted a "negative list" approach by explicitly prohibiting eleven forms of activities on the OML platforms. These activities include: (1) using a platform to raise funds for the founder or its affiliated entities; (2) mixing investors' funds with that of the platform; (3) promising or providing any guarantee on investor return; (4) promoting specific projects to unregistered investors; (5) lending out to borrowers in the name of the platform; (6) splitting the loan maturity; (7) selling funds or other wealth management products on OML platforms; (8) bundling OML with licensing, brokerage, and promotion for any institutional investor; (9) making false statements or material omissions on loan products; (10) facilitating loans whose stated purpose is for stock market investment; and (11) having OML business and equity crowd-funding business on the same platform.
The Drafted Rules provided an 18-month transitional period for the market to be cleaned up and operators to adapt to the new regulations. It is expected that the new rule will level the playing field for Chinese OML platforms, and drive them towards the US model. Provided there is credible enforcement, Ponzi Scheme-like platforms are likely to be cracked down, and small OML platforms that are unable to afford compliance cost are likely to withdraw from the market. Those left in the market would be ones with competitive advantages in acquiring high-quality borrowers, and in addressing information asymmetry between lenders and borrowers. Enhanced transparency in China's OML market is also likely to attract more institutional investors.
## VII. POSITIVE INNOVATION: LEVERAGING USERS' SOCIAL NETWORK IN OML
We have argued that the key to the success of an OML platform is to reduce information asymmetry between lenders and borrowers. In the absence of reliable creditworthiness signals, some OML platforms initiated pilot programs to exploit users' social network to address information asymmetry problems. Microfinance theories argue that social networks can reduce information asymmetry, either because friends have private information on borrower sex ante or because the monitoring within social networks provides a stronger incentive to pay off loans ex post.
In recent years, social networking sites such as Facebook, LinkedIn, and WeChat (the "Facebook of China") have greatly facilitated the creation and maintenance of many social relations and made them highly visible. The ability to leverage social networks is a key advantage of OML over traditional lenders such as banks. Some platforms, such as Prosper, Lending Club, Zopa, Funding Circle and PPDai, increasingly resort to social networks as loan origination and risk management mechanisms. These platforms provide online social networking functions that allow lenders and borrowers to declare friendships with one another, and form groups to foster their own "community", together with benefits such as the ability to broadcast loan requests to friends, and to receive notifications of friends' borrowing and lending activities.
Even better, empirical evidences show that social networks have the potential to facilitate more loans. Using Prosper data, Freedman and Jin (2008) find borrowers' friendship networks were significant predictors of lending outcomes.[xxii] Lin et al. (2013) find the number of visible friends that a borrower has and the number of friends that actually bid on a loan increase the probability of successful funding of a loan, and reduce both interest rates and default rates. Using data from PPDai, the largest OML platform in China and a pioneer of utilizing social capital to reduce credit risk, Liu et al. (2015) classify a lender's friends on P2P platforms into "pipes" (i.e., lenders are more likely to lend to friends whom they trust), "prisms" (i.e., potential lenders may interpret bids by a borrower's friend as an endorsement, thus more likely to invest), and "relational herding" (i.e., potential lenders are more likely to follow bids from their friends than bids from strangers). Interestingly, the authors find support for both pipe and relational herding hypotheses, but the opposite of the prism effect (that is, friends' endorsements via bidding on a loan negatively affects subsequent bids by third parties). They interpret this finding as a borrower's friend's bid is perceived by potential lenders more as a social obligation toward the borrower, than an endorsement from their information advantage.
A new business model, commonly referred to as "friend lending", was introduced in China in 2015. Unlike other OML platforms, it capitalizes on users' social capital and network for loan origination. We use the following simple example to illustrate how this model works: assume A wants to borrow and can afford a $15\%$ interest rate. B is a friend of A. Instead of lending to A, B can "forward" A's loan request in its own name but with a lower interest rate, say $10\%$. C is a friend of B. If C lends to B (at $10\%$ interest rate), B is then able to lend to A (at $15\%$ interest rate). Note in this process, B is a de jure lender to A and borrower to C, but a de facto loan facilitator between A and C. By leveraging his social capital, B is able to earn an arbitrage profit of $5\%$. This model, if successful, can solve two operational challenges in OML: (1) For loan origination, the "friend lending" model relies on users' social network to facilitate loans, mitigating the fraud risk of the platform to misstate borrowers' quality. (2) For credit rationing, the "friend lending" model relies on users' social capital as collateral, potentially a very powerful source of information on borrower credit risk.
Despite its obvious benefits, experiments to integrate users' social network in OML should be designed with care: First, the degree to which social network can reduce information asymmetry crucially depends on the quality and integrity of such social network. Loosely connected social groups appear to have little endorsement or monitoring effect on borrowers. For example, Prosper Marketplace once initiated a program that provided "group leaders" monetary incentives for loans facilitated by their group members. The intention was to leverage the "friends effect" within groups to facilitate more loans and control credit risk. However, it turned out that group leaders responded to the monetary incentives by expanding the size of their groups. When groups became very large (some over 10,000 members), the reputation and monitoring effects disappeared. The reward program later proved to be a failure and was discontinued by Prosper.[xxxiv]
Second, social networks could reduce or increase information asymmetry between borrowers and potential lenders. Liu et al. (2015) show that potential lenders can interpret the bidding behavior of a borrower's friend as a signal of social obligation, affective bias, or even collusion, rather than an endorsement of borrower's quality. On the other hand, it is an empirical question whether loans between friends are more or less likely to be repaid on time compared with loans between strangers. In sum, we stress that integrating users' social network is a positive innovation that attempts to utilize new sources of data and technology to address the key challenges in OML. However, more work is needed to uncover under which condition is social network most useful in peer-to-peer lending.
## VIII. IMPLICATIONS FOR MANAGERS
Our study on the fraud risk in OML generates two implications for managers: First, in the lending businesses there is increasing reliance on complex quantitative models for credit rationing. However, implementation of these models needs monitoring. When platforms face pressure on loan origination but do not bear the credit risk, moral hazard may override complex models and internal risk control systems. This moral hazard is particularly severe in countries like China, where reliable signals on borrowers' credit is unavailable and lenders rely almost exclusively on the credit rationing by platform loan officers. The regulatory response is to require heightened transparency on all market participants (borrowers, investors, platform operational statistics) and processes (credit decisions, pricing terms, APRs) in clear, simple, and consistent terms. On the other hand, to induce platforms (and their line officers) to exercise diligence in screening and monitoring, we suggest to add the ex post charge-off rate of the corresponding loans to internal performance evaluation of approving loan officers.
The second implication for managers is on the utilization of users' social network in OML. The "friends effect" has the potential to facilitate more loans, and reduce information asymmetry between lenders and borrowers. We foresee the key to its success lies in the platform's ability to foster a close-knit community where friend endorsement and peer pressures are in place. It is anticipated that new business models in this area will constantly evolve, yet monetary incentives shall be handled with care. In other words, social network can be a complement but not substitute for a platform's diligence to screen borrowers.
### SUPPLEMENTARY MATERIALS
Author Contributions: Conceptualization, Zhen Lei and Jing Tao Andy Lin; methodology, Zhen Lei; software, Zhen Lei and Ho Kai Chan; validation, Jing Tao Andy Lin, Ho Kai Chan and Ting Rose Dan; formal analysis, Jing Tao Andy Lin, Ho Kai Chan and Ting Rose Dan; investigation, Ting Rose Dan; resources, Zhen Lei; data curation, Zhen Lei; writing—original draft preparation, Jing Tao Andy Lin and Ho Kai Chan; writing—review and editing, Zhen Lei and Ting Rose Dan. All authors have read and agreed to the published version of the manuscript.
Funding: This research received no external funding.
Data Availability Statement: 3rd Party Data. Restrictions apply to the availability of these data. Data was obtained from Wangdaizhijia (wdzj.com) and are available from Zhen Lei with the permission of Wangdaizhijia.
Acknowledgments: We would like to thank Professor Haitian Lu for the valuable comments on the paper.
Conflicts of Interest: The authors declare no conflict of interest.
Generating HTML Viewer...
References
18 Cites in Article
George Akerlof (1970). The Market for "Lemons": Quality Uncertainty and the Market Mechanism.
Daniel Brass (2015). Friendships in Online Peer-to-Peer Lending: Pipes, Prisms, and Relational Herding.
(2015). Drafted Rules on the Regulation of Online Marketplace Lending Operators.
Eric Chaffee,Geoffrey Rapp (2012). Regulating Online Peer-to-Peer Lending in the Aftermath of Dodd-Frank: In Search of an Evolving Regulatory Regime for an Evolving Industry.
(2015). The Guiding Opinions for Promoting the Healthy Development of Fintech.
Michael Corkery (2016). As Lending Club Stumbles, Its Entire Industry Faces Skepticism.
(2016). How Does Online Lending Work? An Overview with a Focus on Marketplace Lending.
Jefferson Duarte,Stephan Siegel,Lance Young (2012). Trust and Credit: The Role of Appearance in Peer-to-peer Lending.
Seth Freedman,Ginger Jin (2008). Do Social Networks Solve Information Problems for Peer-to-Peer Lending? Evidence from Prosper.com.
Ron Lieber (2011). Money market executive’s perception towards peer-to-peer (p2p) lending.
Mingfeng Lin,Nagpurnanand Prabhala,Siva Viswanathan (2013). Judging Borrowers by the Company They Keep: Friendship Networks and Information Asymmetry in Online Peer-to-Peer Lending.
Uday Rajan,Amit Seru,Vikrant Vig (2015). The failure of models that predict failure: Distance, incentives, and defaults.
Daniel Ren (2016). Shanghai Gas Company supplement, 1934-05-17.
Wsj (2015). China Lays Out Rules for Peer-to-Peer Lending Platforms.
No ethics committee approval was required for this article type.
Data Availability
Not applicable for this article.
How to Cite This Article
Zhen Lei. 2026. \u201cRegulating Frauds in Online Marketplace Lending: A Comparative Study on China and U.S.\u201d. Global Journal of Management and Business Research - C: Finance GJMBR-C Volume 22 (GJMBR Volume 22 Issue C3).
Explore published articles in an immersive Augmented Reality environment. Our platform converts research papers into interactive 3D books, allowing readers to view and interact with content using AR and VR compatible devices.
Your published article is automatically converted into a realistic 3D book. Flip through pages and read research papers in a more engaging and interactive format.
Our website is actively being updated, and changes may occur frequently. Please clear your browser cache if needed. For feedback or error reporting, please email [email protected]
Thank you for connecting with us. We will respond to you shortly.