The main objective of this research is to investigate the consumer satisfaction in the context of booming fast-food industry of Cameroon. More precisely, we break the satisfaction concept into different constructs, atmosphere satisfaction, menu satisfaction and global satisfaction, based on the different drivers of satisfactions; we then evaluate the influence of atmosphere satisfaction and menu satisfaction on global satisfaction as well as the impact of the three dimensions of satisfaction on consumers loyalty. The researcher also evaluated the moderator role of global satisfaction on the relationship linking atmosphere and menu satisfaction to loyalty. The study results indicated that fast-food menu and the atmosphere satisfaction have a positive effect on global satisfaction. As well, out of the three dimensions of satisfaction, global and menu satisfaction proved to have a positive impact on consumer loyalty, but effect of the atmosphere satisfaction proves to be not determinant. In addition, the mediator role of global satisfaction proved to be relevant.
## I. INTRODUCTION
There have been abundant researches investigating consumer satisfaction in services industry. For over forty years, an increasing interest aroused on consumers satisfaction with regard to services. Many authors have contributed to the advancement of the research; namely Howard and Sheth (1969), Ltifi, M. and Ghardi, J.E. (2012). Ekinci, and Sirakaya, (2004), Cadotte and Turgeon (1988) or more recently the work of Bartikowski, and Llosa, (2004) highlighted the different interactions affecting the degree of customer satisfaction, (Camelis, et al, 2017).
The attention directed to service industry such as fast-food is due to the improvement in the level of consumer satisfaction, driven by the increasing importance of that sector. It is worth mentioning that, in that industry, differentiation is required in order to gain market shares, as the industry products are highly homogeneous and the firms can only compete through service quality maximization.
many studies have directed their attention on the importance of service quality on consumers satisfaction and loyalty. However, most of these studies were based on developed and emerging countries, but not on sub-Saharan African countries; furthermore, these works did not consider the different components of satisfaction. (Soriano 2012; Ladharai et al, 2017; Ajina et al, 2015).
Hence, this research investigates the consumer satisfaction in the context of booming fast-food industry of Cameroon.
More precisely, we break the satisfaction concept into different constructs, atmosphere satisfaction, menu satisfaction and global satisfaction, based on the different drivers of satisfaction; we then evaluate the influence of atmosphere satisfaction and menu satisfaction on global satisfaction as well as the impact of the three dimensions of satisfaction on consumers loyalty. The researcher also evaluated the moderator role of global satisfaction on the relationship linking atmosphere and menu satisfaction to loyalty.
The study result indicated that fast-food menu and the atmosphere satisfaction have a positive effect on global satisfaction. As well, out of the three dimensions of satisfaction, global and menu satisfaction proved to have a positive impact on consumer loyalty, but effect of the atmosphere satisfaction proves to be not determinant. In addition, the mediator role of global satisfaction proved to be relevant.
The remaining of this document is as follow. After presenting a brief literature review on the satisfaction construct, we developed the hypothesis and the conceptual model. The methodology is then presented, before moving to the results presentation. Finlay, a conclusion and recommendations are proposed.
## II. LITERATURE REVIEW
Research on consumers satisfaction has made significant progress in recent years in terms of insightful results produced. The subject is even considered as been the cornerstone of marketing (Peterson and Wilson 1992, cited in Bourgeon-Renault, Cova and Petr, 2006). If originally, the construct of satisfaction emanated from the labor field and was defined as "a way of rewarding an individual for a job" (Homans 1961), it is above all the work of Howard and Sheth (1969) or even Oliver (1980) who introduced this construct to the marketing field. From now on, satisfaction can be glimpsed from different points of view.
Hence, some researches have defined satisfaction as a result of a consumption experience (Cardozo 1965; Oliver, 2014; Evrard, 22016). Other studies have related the concept of satisfaction more closely with consumer behavior (Mihaela, O.O.E., 2015). Finally, Oliver (2010), meanwhile, suggests a four-step process leading to satisfaction. According to that author, satisfaction is related to three constructs: performance, expectations and disconfirmation. This last contribution gives the construct of satisfaction an emotional dimension and makes its theoretical contribution one of the first explanatory models of this dimension in marketing.
# a) The Transactional Approach of Satisfaction
Many studies have defined satisfaction from the transactional perspective. In that approach, satisfaction is considered as "a subsequent state inherent to a specific transaction, limited in time" (Audrain-Pontevia 2016). A similar definition was already proposed by, Lee and Kim (2017) by including perception and stating that "customer satisfaction measures the perception of what he actually enjoys from goods or service consumption, in comparison with his expected satisfaction when consuming a similar goods or service. In other words, the proponents of this approach suggest that the consumer assesses goods or services from the experience gained from their consumption; the latter measuring satisfaction by the difference between the experience and its initial expectations Javed. and Cheema, (2017).
Faced with this static approach, which only considers the consumer experience toward the product or service provider; another perspective is based on the relational approach. According Ngobo (2017), the measurement of satisfaction in a relational perspective is defined as been a "continuous global evaluation of the ability of the company or the brand to provide the benefits sought by the customer". Hence many viewpoints need to be accounted when defining satisfaction. This is what Garbarino and Johnson (2008) highlighted when defining satisfaction as "a cumulative construct, summing up satisfaction gained from specific products or services of the company". This is a more recent approach to measure the consumer satisfaction construct.
### b) Satisfaction in the Restaurant Industry
There have been abundant research investigating consumer satisfaction in the restaurant industry. Among them, the study by Soriano (2019) based on a sample 3,872 consumers, concluded that the most important determinants of the consumer choice of a restaurant were the food quality, namely freshness of the product, shape, variety of menus and quantity of food served; as well as the service quality, price and the atmosphere of the restaurant. These dimensions provide insight on the most relevant factors of consumer loyalty in relation to their degree of satisfaction.
Suhartanto et al, 2019. also revealed the relationship between the traditional constructs on which satisfaction is defined, namely; food quality, atmosphere, quality of facilities and the likelihood of visiting the restaurant by consumers. The food quality was found to significantly influence the respondent behavior toward returning to the restaurant in the same study.
In a cross-cultural analysis applied on a sample of 5136 consumers from 4 different countries (Scotland, Jamaica, United States and Wales), Omar et al (2016) evaluated the satisfaction of fast- food restaurant chains (McDonald's, Burger King, KFC, etc.). Their study finding revealed that, the consumer satisfaction was mainly driven by the relationship with the restaurant staff as well as the quality of the facilities. Menvielle (2006), meanwhile, evaluated the different variables of satisfaction and the consumer loyalty, using a sample of 262 consumers in the Quebec region, the study finding revealed that, food quality explains the consumer's likelihood of returning to the restaurant. The results are in line with the finding by Tripathi, G., (2017) that the food quality is an important determinant explaining consumer satisfaction in restaurant.
Jalil et al, (2016) made a ranking of the key factors influencing the consumer satisfaction of in the hospitality industry. Their study results indicate that the critical factors determining the consumer satisfaction was found to be the courtesy of staff, the price and the food quality, however, their study did not provide evidence of impact of the environmental factors.
From the above development, we can conclude that the consumer satisfactions are apprehended by many variables that we will be including in our conceptual framework.
## III. HYPOTHESIS AND CONCEPTUAL MODEL
Our conceptual model is based on the relational approach, which aim is to understand which dimensions of satisfaction matters the most to consumers and motivate them to eat in a fast food. To this end, we have divided the relationship between a consumer and the service provider into three stages:
- A pre-transactional stage based on consumer choice and decision-making criteria,
- A transactional stage during which there is an exchange between the two parties and an assessment of tangible aspects by the consumer,
- A post-transaction step, allowing the consumer to make an assessment of their experience and to estimate the degree of frequentation of the restaurant in the future.
The pre-transaction stage refers to the initial approach that a consumer follows in the purchasing relationship with a company. Before any relationship, the consumer assesses the value he can benefit from the relationship that links him with the service provider. Thus, the consumer identifies some key elements that will allow him to assess the quality of the product that will be offered to him later in the relationship. This is how the sound environment or the decoration come into play at this level. According to some authors, they even constitute a fairly significant element of differentiation from the competition (Belman 2004; Pratminingsih, et al 2018). Finally, the waiting time before being able to sit down to eat, is as well, according to Soriano (2002), a critical factor for choosing a restaurant or not.
Regarding the transactional stage, the consumer must make choices of the menus while considering the best quality/price ratio in order to properly evaluate the service provided by the fast-food. The food quality and the freshness are crucial elements determining the consumers return to the restaurant (Nadzirah, S, et al 2013). Although many of the studies conducted in the hospitality industry have been emphasizing indoor restaurant service quality, it is also worth mentioning that the delivery service quality is also a major factor determining the consumer satisfaction in the fast-food restaurant. Hence, similar to Soriano (2002) we also consider that dimension in this stage. Finally, the other aspects that we can consider in this transactional stage concern the price-quality ratio of the menu. Offering a quality menu is not enough to achieve the consumer satisfaction, this needs to be in line with the price, the restaurant atmosphere or the cleanliness (Soriano 2002). Consumers are looking for value and constantly desire higher value for their desired menu (Klara 2012).
We thus formulate the hypothesis that:
H 1: consumer satisfaction toward the fast-food menu positively influences the global satisfaction As already said, the consumer assesses the value of the benefit he will enjoy from eating in the fast-food restaurant. This allows him to make an idea of the quality of the product that will be offered to him. This is how the restaurant atmosphere; decoration plays a key role at this level. According to Liljander and Strandvik (2020) the emotional variables associated to the restaurant atmosphere creates an emotion on the consumer that will affect its satisfaction level. Some researches claim that, they even constitute a fairly significant element of differentiation from the competition (Belman, 1996; Chen, Y., 2014). Hence, we posit that.
H 2: Satisfaction toward the restaurant atmosphere positively affect the global satisfaction
Similar to the relational approach to satisfaction, we measured the effects of satisfaction on loyalty. More precisely, we refer to the work of Soriano (2002), Sulek and Hensley (2004), Gilbert et al. (2004), Menvielle (2006) and Andaleed and Conway (206). These works provide evidence supporting that, the more consumers are satisfied with the service provider, the more likely they will come back to him. This long-term relationship has been also proven in the marketing empirical literature (Anderson and Sullivan, 1993; Tanveer, Zoyia, and Rab
Nawaz Lodhi (2016); Yi, 1997). We also consider these elements in the post-transaction stage and two dimensions were thus proposed, namely the probability of returning to the restaurant and the probability of recommending the restaurant. These considerations allowed us to formulate the following set of hypotheses:
- H 3: Satisfaction toward the menu positively influence loyalty
- H 4: Satisfaction toward the restaurant atmosphere has a positive influence on loyalty
- H 5: Global satisfaction has a positive influence on loyalty
Finally, we also consider the possible moderating role plays by the overall satisfaction on the relationship between consumer satisfaction, and loyalty, Namely, we posit that:
- H 6.a: Global satisfaction is a mediator in the relationship between satisfaction toward the menu and royalty
- H 6.b: Global satisfaction is a mediator in the relationship between satisfaction regarding the company atmosphere and loyalty
From the above development, we provide the representation of both the transactional approach representation as well as the conceptual model.
### Pre-transactional
#### Transactional
- Waiting time
- Cleanliness
- Decoration
- Background music
- Attendance
- Atmosphere
-Helpfulness
- Variety of menus
- Health aspects
- Product presentation
- Product freshness
- Food quality
- Food quantity
- Value for money
- Offers
Post transactional
Probability to return to restaurant
Likelihood to recommend restaurant
Figure 1: The Transactional Approach Representation
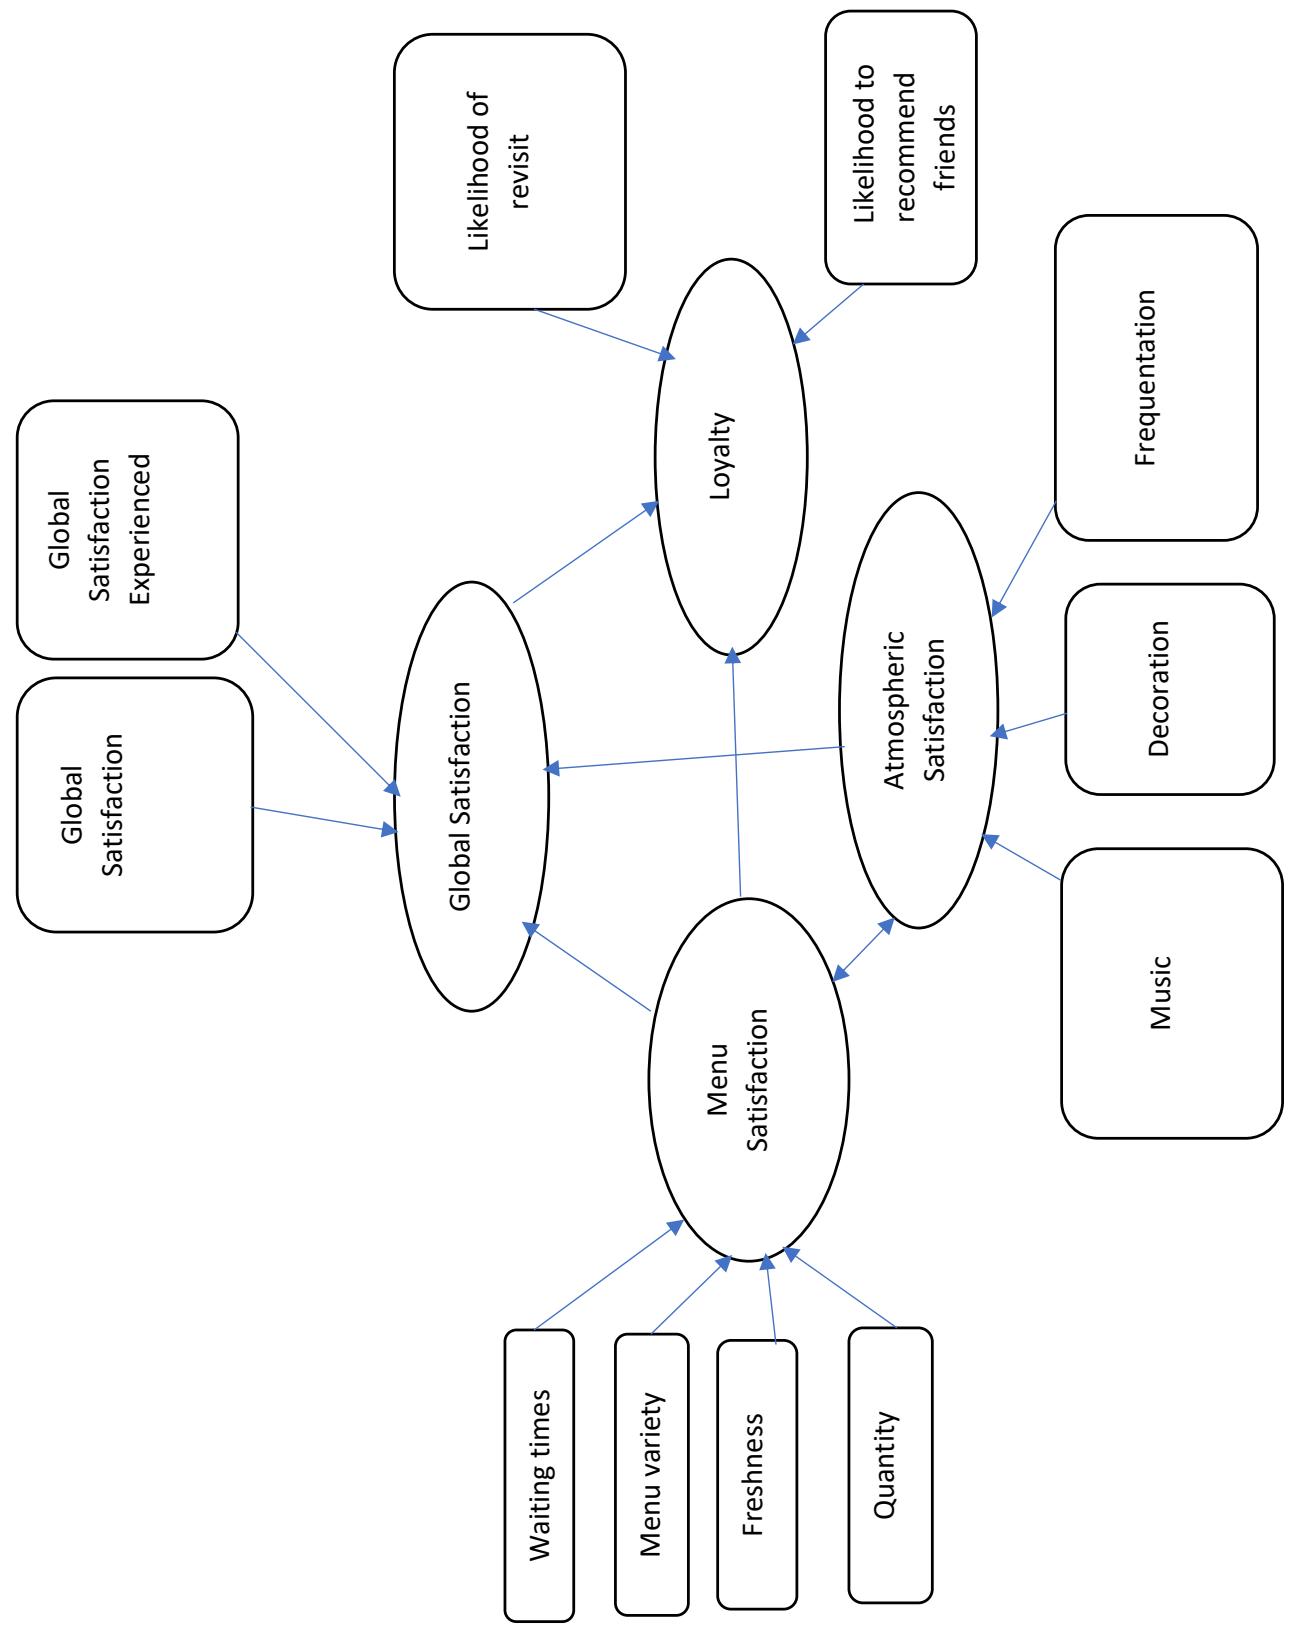
Our research model therefore considers all these dimensions from a relational approach and is presented as follow:
 Figure 2: Conceptual Model
## IV. EMPIRICAL ANALYSIS
Our study objective was achieved using data collected from a survey. Precisely, we used a self-administrated questionnaire online and offline to collect data from some college students in Cameroon. The selection of students as target population was driven by the fact that, they constitute one of the major segments in the fast-food in Cameroon. From this data collection process, the researcher was able to test the conceptual model using a sample or 621 students.
The measuring scales were designed following the procedure of Churchill (1979). For our exploratory phase, we generated a set of items by referring to the existing literature, namely pre- existing scales taken from the literature on consumer satisfaction and loyalty in the fast-food industry. The measurement scales used in this research are similar to those adopted by Gilbert et al. (2004) who investigated the consumer satisfaction in the fast-food industry.
Prior to testing the hypothesis, we first performed the internal consistency analysis using the Cronbach test, we also applied the exploratory factor analysis. The objective of this analysis was to investigate how closely related are the set of items found in each construct, and to reduce the data into a smaller set of summary variables, prior to making the regression analysis. The Varimax rotation based on the maximization of the correlation coefficients of the most correlated variables was suitable in our case since the regression assumes the independence of the explanatory variables (Hair et al., 1998). We refer to the Kaiser's rule
(1958) to determine the number of factors to extract. Hence, only the factors whose eigenvalue was greater than 1 were retained. The percentage of explained variance ensures that the factors explain a minimum of variance. In social sciences, the minimum percentage variance should be $60\%$ (Hair et al., 1998). As for the explanatory factor analysis, the minimum variance threshold for interpreting the factors is 0.3. (Gorsuch 1974; Leary 1995).
In the tables presenting the loadings of the items on each factor, we only presented the loadings greater than 0.30 for the sake of reliability. We retained the items strongly correlated with a single factor and whose factorial weight was greater or equal to 0.5. Items with commonality less than 0.5 were eliminated by successive iterations.
Regarding the different dimensions of satisfaction and overall satisfaction, the respondents were asked to give the opinion on their satisfaction regarding the fast-food. based in the Likert scale of 1 to 5 (1-not satisfied at all, 5-very satisfied). As well, concerning the behavioral intentions, the respondents were asked to give their opinion on the likelihood of returning in the fast-food or recommending the fast food to someone in the near future, we also used the Likert scale of 1 to 5 (1-not at all likely, 5-very likely).
The internal consistency analysis of the model was validated by the Cronbach's alpha test. The results of this internal consistency (ACP, Cronbach test and Varimax) are shown in the below (table 1)
Table1: Internal Consistency Analysis Results
<table><tr><td>Items</td><td>F1</td><td>F2</td></tr><tr><td>- Waiting Time</td><td>,693</td><td></td></tr><tr><td>- Helpfulness</td><td>,610</td><td></td></tr><tr><td>-Variety Of Menus</td><td>,539</td><td></td></tr><tr><td>- Food Quality</td><td>,541</td><td>,479</td></tr><tr><td>- Health Aspects</td><td></td><td></td></tr><tr><td>-Product Freshness</td><td>,372</td><td>,566</td></tr><tr><td>Menu Presentation</td><td>,683</td><td></td></tr><tr><td>Food Quantity</td><td>,617</td><td>,387</td></tr><tr><td>- Menu Price Ratio</td><td>,676</td><td></td></tr><tr><td></td><td>,514</td><td></td></tr><tr><td>-Promotions</td><td></td><td></td></tr><tr><td>-Music</td><td></td><td>,715</td></tr><tr><td>- Cleanliness</td><td>,505</td><td>,413</td></tr><tr><td>- Cleanliness</td><td></td><td></td></tr><tr><td>- Decoration</td><td></td><td>,773</td></tr><tr><td>Frequentation</td><td></td><td>,751</td></tr><tr><td>Global Atmosphere</td><td></td><td>,675</td></tr><tr><td>Eigen Value</td><td>5,148</td><td>1,611</td></tr><tr><td>Variance</td><td>34,918</td><td>10,681</td></tr><tr><td>Alpha De Cronbach</td><td>0,692</td><td>0,693</td></tr></table>
The alpha value must be at least 0.7 for confirmatory factor analysis (Hair et al., 1998). In the case of exploratory factor analysis, it is considered acceptable if it is between 0.5 and 0.7 (Nunnally 1978). We have therefore adopted a minimum threshold of 0.5.
The principal component analysis of the different dimension of satisfaction, performed using SPSS 13.0, revealed a two-dimensional structure, accounting for more than $45\%$ of the total variance at the global level. Precisely, the analysis suggests that, the satisfaction coming from the restaurant menu account for (34.988% of total explained variance), while the satisfaction due the restaurant atmosphere represents (10.671% of total explained variance).
Similarly, the internal consistency of the constructs related to global satisfaction and reliability (loyalty) was also performed through successive iterations scales. From this process, we retain one-dimensional structure of each of the scales considered. However, this approach has led to the removal of many items with poor loadings. the constructs related to the overall satisfaction and loyalty have also been represented by two items.
We also examined the possible relationship between the different dimensions of satisfaction, global satisfaction as well as loyalty, in this case, the internal consistency was evaluated through the computation of rho proposed by Jöreskog (1971). As well the exploratory factor analysis also supports the reliability of our constructs with indices $\rho j$ greater than 0.65 (Table 2).
Table 2: Reliability of the Constructs
<table><tr><td></td><td>Alpha de Cronbach (nb d'items)</td><td>Rhô de Joreskog</td></tr><tr><td>Menu. Sat</td><td>0,662 (4 items)</td><td>0,673</td></tr><tr><td>Atmosphere. Sat</td><td>0,691 (3 items)</td><td>0,664</td></tr><tr><td>Global Sat</td><td>0,752 (2 items°</td><td>0,754</td></tr><tr><td>Loyalty</td><td>0,809 (2 items)</td><td>0,727</td></tr></table>
### a) Hypothesis Testing
From our conceptual model we were supposed to investigate two issues: the influences of the different dimensions of satisfaction on the overall satisfaction and loyalty, as well as the possible moderating role of overall satisfaction on the relationships between the dimensions of post-transaction satisfaction and loyalty. The results of the regressions analysis indicate that, there is a positive and significant impact of the two dimensions of pre-transactional satisfaction (satisfaction coming from the menu offered and the restaurant atmosphere) on overall satisfaction. This is in line with the assumptions made that, overall satisfaction is mainly explained by pre-transaction satisfaction with attributes related to the menu proposed and the fast-food atmosphere. Hypotheses H1 and H2 are therefore validated.
The analysis results also show a significant positive influence of overall satisfaction on loyalty, which supports the results of the existent literature. Finally, the research outcome revealed some influence of the components of pre-transaction satisfaction on loyalty. Precisely, the results indicate that, the satisfaction resulting from the restaurant atmosphere has no significant influence on loyalty.
- while the satisfaction resulting from the menu offered positively and significantly affects loyalty.
Table 3: Results of Hypothesis Test
<table><tr><td>Independent Variables</td><td>Influence de</td><td>Coeff.</td><td>T</td><td>Sig.</td><td>Concl.</td></tr><tr><td>Global Satisfaction</td><td>Sat menu</td><td>0,386</td><td>6,909</td><td>0,019</td><td>S</td></tr><tr><td>Global Satisfaction</td><td>Sat Atmosphere</td><td>0,193</td><td>3,867</td><td>0,021</td><td>S</td></tr><tr><td>Loyalty</td><td>Global Satisfaction</td><td>0,717</td><td>14,418</td><td>0,022</td><td>S</td></tr><tr><td>Loyalty</td><td>Sat Atmosphere</td><td>-0,045</td><td>-1,0664</td><td>0,246</td><td>NS</td></tr><tr><td>Loyalty</td><td>Sat Menu</td><td>0,244</td><td>4,806</td><td>0,013</td><td>S</td></tr></table>
In order to expand our analysis, we sought to understand the possible moderating nature of overall satisfaction on the relationships between the dimensions of satisfaction and loyalty.
The literature indicated that satisfaction has proven to be considered a good predictor of loyalty (Mencarelli et al 2010). (Orji, O., 2013) Howard and (Huang, Q., 2010) Newman and Werbel (1973), Engel, Blackwell and Kollat (1978), Walters, Achour, suggest a theoretical positive relationship between satisfaction and loyalty. Achour (2006) also provides evidence supporting that there is a link between satisfaction and loyalty. Regarding the hospitality industry, Dimitriades (2006) and Gilbert et al. (2004) demonstrates the existence of the relationship between satisfaction and loyalty.
Therefore, the mediating role of global satisfaction was tested using the three-step procedure of Baron and Kenny (1986), which uses three independent regression analyses. This approach proves the existence of mediation by demonstrating that:
- The independent variables affect the mediator,
- The independent variables have significant effect on the dependent variables,
- The mediator influences the dependent variable.
In other words, the path between the independent and dependent variables should be less significant than the path between the mediator and the independent variables. Mediation is considered total when the influence of the independent variable on the dependent variable disappears completely in the presence of the mediating variable and that between the mediator and the dependent variables remains highly significant.
When the influence of the mediator on the independent variable is simply insignificant, we are then in the case of partial mediation. In cases of partial mediation, only part of the effect of the independent variable on the dependent variable is exerted through the mediating variable and the other part is exerted directly on the independent variable, or possibly, through another variable not taken into account in the model.
From the previous analysis, we established that the two dimensions of satisfaction significantly and positively influence overall satisfaction, our mediating variable. The latter has a positive and significant influence on loyalty, that stands for the dependent variable.
Concerning the direct influences of the dimensions of satisfaction on the dependent variable, we previously observed differentiated effects according to the explanatory variable considered; namely,
- The satisfaction deriving from the restaurant atmosphere have not significant influence on loyalty, hence we can conclude that, there is a total mediating role of global satisfaction on the relationship linking satisfaction towards the atmosphere and loyalty:
- Satisfaction coming from the menu have a significant and positive influence on loyalty, we therefore proceeded to test a possible partial mediation, via overall satisfaction. The results of the test revealed that overall satisfaction is therefore a partial mediator in the atmosphere satisfaction-loyalty relationship.
According to Fornell, Lorange and Roos (1990), the total effect of one variable on another is the sum of the direct effect and the indirect effect. The analysis of the total effects revealed that overall satisfaction is the variable that exerts strongest influence on loyalty. It is also worth mentioning that satisfaction coming from the menu has a strong positive influence, both directly and indirectly, via overall satisfaction, on loyalty.
Table 4: Direct, Indirect and Total Effect
<table><tr><td>Impact on loyalty</td><td>Direct Effect</td><td>Indirect Effect</td><td>Total Effect</td></tr><tr><td></td><td></td><td></td><td></td></tr><tr><td>Sat Menu</td><td>0,243</td><td>0,277</td><td>0,520</td></tr><tr><td></td><td></td><td></td><td></td></tr><tr><td>Sat Atmosphere</td><td>-0,044</td><td>0,13725</td><td>0,093</td></tr><tr><td></td><td></td><td></td><td></td></tr><tr><td>Global Satisfaction</td><td>0,716</td><td></td><td>0,716</td></tr><tr><td></td><td></td><td></td><td></td></tr></table>
### b) Goodness of the Fit
The size of our overall sample (621 individuals) allows us to use the structural equation method to test our hypotheses of direct links between variables. With this in mind, we used the Amos 4.0 software, with estimation by the maximum likelihood method and bootstrap procedure on 200 replications, to ensure the robustness of the results obtained.
Confirmatory factor analysis leads to confronting empirical data with hypotheses on the relationships between observed variables and latent variables (Evrard, Pras and Roux 2009). With this in mind, we selected certain indices that reflect the extent of the adjustment (adjustment indices) or the lack of adjustment (residuals) of the model (N'Goala 2003).
Given the size of our sample $(n = 621)$, and based on the recommendations of the literature, we used the following indices to perform the goodness of fit analysis.
- NFI, NNFI, ILI, CFI and TLI. It is generally desirable that they be greater than 0.9 when the sample size exceeds 250 (Bollen and Long, 1993; Hu and Bentler, 1995).
We also rely on Gamma 1, Gamma 2, RMR and RMSEA and Chi-square/ degree freedom indices to check the adjustment of the models tested. We decided not to retain neither the Chi-square, which is too sensitive to the size of the sample, nor the GFI and AGFI indices, considered less reliable than the Gamma1 and Gamma2 indices, because they are too sensitive to the number of parameters to be estimated (Roussel and 2002).
The Chi2 value adjusted according to the number of degrees of freedom (Chi2/d of) must generally be less than 5. It is advisable to carefully observe the residuals and especially the RMSEA in order to have a more precise indication of the degree of freedom. adjustment between the theoretical model and the data (Browne and Cudeck 1993, Hu and Bentler 1995). The RMSEA is considered suitable when it is close to 0.05, acceptable below 0.08 and unacceptable above 0.1 (Browne and Cudeck 1993). These elements are presented in Table 6 below.
Table On the sight if these thresholds, the fitness the model is satisfactory. Indeed, the adjustment indicators (NFI=0.988, NNFI=0.979, CFI = 0.966; IFI = 0.976; TLI = 0.948) all exceed the threshold of 0.9 and the RMSEA value is also very suitable (0.043) as indicate the below table 5.
Table 5: Post Estimation Analysis
<table><tr><td></td><td>Chi-Square</td><td></td><td>Gamma 2</td><td>RM R</td><td>RMSE A</td><td>NFI</td><td>NNF1</td><td>Chi2/dd I</td><td>IFI</td><td>TLI</td><td>CFI</td></tr><tr><td>Threshold d</td><td></td><td>>0,9</td><td>>0,9</td><td>< 0,1</td><td><0,08</td><td>>0,9</td><td>>0,9</td><td>< 5</td><td>>0,9</td><td>>0,9</td><td>>0,9</td></tr><tr><td>Results</td><td>124,78</td><td>0,988</td><td>0,979</td><td>0,049</td><td>0,043</td><td>0,948</td><td>0,949</td><td>3,299</td><td>0,976</td><td>0,948</td><td>0,966</td></tr></table>
## V. CONCLUSION
Through this research, we wanted to study the consumer satisfaction with regard to the fast-food industry in Cameroon and precisely, the dimensions that can explain consumer satisfaction when visiting a fast-food type restaurant. The study result indicated that fast-food menu and the atmosphere satisfaction have a positive effect on global satisfaction. As well, out of the three dimensions of satisfaction, global and menu satisfaction proved to have a positive impact on consumer loyalty, but effect of the atmosphere satisfaction appeared to be not determinant. In addition, the mediator role of global satisfaction proved to be relevant. As for the factors affecting satisfaction in general, food appeared to be the most crucial dimensions when consumers evaluate the satisfaction attached to the meal, over the others factors. Our contribution is innovative insofar as it extrapolates the studies on consumer satisfaction that we mentioned in our literature review. We brought to light new dimensions, in particular the importance of the atmosphere of the fast- food, and validated almost all of the hypotheses evoked. Therefore, we can affirm that our contribution should be useful for other studies which will, at least, corroborate our assertions. These results deepen the conclusions of some previous studies (in restaurants with service), by insisting more on the concepts attached to food (quality, quantity of food).
Finally, regarding loyalty, we confirmed that it was strongly linked to overall satisfaction. Moreover, loyalty is explained more by attitudinal loyalty (recommendation of the restaurant) than by behavioral loyalty (return to the restaurant).
Be that as it may, in light of these results, consumers seem to have become aware of an important and rapidly expanding phenomenon in Africa, the search for quality food is now becoming a major dimension. Therefore, fast-food companies in Cameroon need to sharpen their services quality in order to improve the consumers satisfaction in all aspects and guarantee by the way their royalty.
Generating HTML Viewer...
References
52 Cites in Article
T Abbott,F Abdalla,J Aleksić,S Allam,A Amara,D Bacon,E Balbinot,M Banerji,K Bechtol,A Benoit-Lévy,G Bernstein (2016). The Dark Energy Survey: more than dark energy – an overview.
L Achour (2006). La relation entre la satisfaction et la fidélité à la marque.
A Ajina,D Sougne,F Lakhal (2015). Corporate disclosures, information asymmetry and stock-market liquidity in France.
E Anderson (1994). Cross-category variation in customer satisfaction and retention.
Anne-Françoise Audrain-Pontevia,Marc Vanhuele (2016). Where do customer loyalties really lie, and why? Gender differences in store loyalty.
Reuben Baron,David Kenny (1986). The moderator-mediator variable distinction in social psychological research: Conceptual, strategic, and statistical considerations..
B Bartikowski,S Llosa (2004). Customer satisfaction measurement: comparing four methods of attribute categorisations.
C Clogg (1993). Testing Structural Equation Models. Edited by Kenneth A. Bollen and J. Scott Long. Sage Publications, 1993. 320 pp. Cloth, $46.00; paper, $23.95.
D Bourgeon-Renault,B Cova,C Petr (2006). Dynamique du processus de satisfaction du consommateur en situations extrêmes: quand le lien remplace le bien.
E Cadotte,N Turgeon (1988). Key factors in guest satisfaction.
C Camelis,F Dano,V Hamon,S Llosa (2017). How Other Customers Influence Customer Satisfaction During the Service Delivery.
R Cardozo (1965). An experimental study of customer effort, expectation, and satisfaction.
Richard Oliver (2014). Satisfaction: A Behavioral Perspective on the Consumer.
Yong Chen (2014). Recreating the Chinese American Home through Cookbook Writing.
Eduard Cristobal-Fransi,Francisco Hernández-Soriano,Berta Ferrer-Rosell,Natalia Daries (2019). Exploring Service Quality among Online Sharing Economy Platforms from an Online Media Perspective.
Zoe Dimitriades (2006). Customer satisfaction, loyalty and commitment in service organizations.
Y Ekinci,E Sirakaya (2004). An examination of the antecedents and consequences of customer satisfaction.
B Engel,R Blackwell (1978). Kollat. Consumer Behavior.
C Fornell,P Lorange,J Roos (1990). The cooperative venture formation process: A latent variable structural modeling approach.
George Homans (1958). Social Behavior as Exchange.
J Howard,J Sheth (1969). J.A. Howard and J.N. Sheth The Theory of Buyer Behavior. The Wiley Marketing Series. New York, London, John Wiley & Sons, Inc., 1969 XV p. 458 p., £ 4.40..
L Hu,P Bentler (1995). Evaluating model fit.
Q Huang (2010). The relationship between service quality and student satisfaction in higher education sector.
Nur Jalil,Amily Fikry,Anizah Zainuddin (2016). The Impact of Store Atmospherics, Perceived Value, and Customer Satisfaction on Behavioural Intention.
Nur Jalil,Amily Fikry,Anizah Zainuddin (2016). The Impact of Store Atmospherics, Perceived Value, and Customer Satisfaction on Behavioural Intention.
F Javed,S Cheema (2017). Customer satisfaction and customer perceived value and its impact on customer loyalty: the mediational role of customer relationship management.
M Johnson,E Sivadas,E Garbarino (2008). Customer satisfaction, perceived risk and affective commitment: an investigation of directions of influence.
K Jöreskog (1971). Simultaneous Factor Analysis in Several Populations.
Allison Kempe,Brenda Beaty,Lori Crane,Jennifer Barrow,Johan Stokstad,Shira Belman,John Steiner (2004). Disenrollment From a State Child Health Insurance Plan: Are Families Jumping S(c)HIP?.
R Klara (2012). AdWeek.
Seoyoung Lee,Eun-Kyung Kim (2017). The Effects of Korean Medical Service Quality and Satisfaction on Revisit Intention of the United Arab Emirates Government Sponsored Patients.
Veronica Liljander,Jan Mattsson (2002). Impact of customer preconsumption mood on the evaluation of employee behavior in service encounters.
R Liu,H Watkins,Y Yi (1997). Taxonomy of consumer complaint behavior: Replication and extension.
M Ltifi,J Ghardi (2012). Satisfaction and loyalty with the Tunisian postal services.
R Mencarelli,S Marteaux,Notebaert,Jf,M Pulh,D Bourgeon-Renault,L Graillot (2010). The evaluation of the consumption experience: investigation around two alternative models. Application in the cultural field.
W Menvielle (2006). Satisfaction des consommateurs auprès des restau rants de type fastfood: Vive la qualité de la nourriture!.
Oancea Mihaela (2015). The Influence of the Integrated Marketing Communication on the Consumer Buying Behaviour.
M Morales,Shm Lakhal,Service Quality,Emotion And Satisfaction In Unknown Title.
S Nadzirah,S Ab Karim,H Ghazali,M Othman (2013). University foodservice: An overview of factors influencing the customers' dining choice.
J Newman,R Werbel (1973). Multivariate analysis of brand loyalty for major household appliances.
Paul Ngobo (2017). The trajectory of customer loyalty: an empirical test of Dick and Basu’s loyalty framework.
Richard Oliver (2010). Customer Satisfaction.
Muhamad Omar,Hashim Saufiyudin,Rozila Fadzil Ariffin,Ahmad (2016). Service quality, customers' satisfaction and the moderating effects of gender: A study of Arabic restaurants.
O Orji (2013). ‘Buying’ or ‘consumer’ behaviour decision models.
B Pras,Y Evrard,E Roux (2009). Market: fondements et méthodes des recherches en marketing.
S Pratminingsih,E Astuty,K Widyatami (2018). Increasing customer loyalty of ethnic restaurant through experiential marketing and service quality.
Prabha Ramseook-Munhurrun,Perunjodi Naidoo (2012). Customers' Perspectives of Service Quality in Internet Banking.
Dwi Suhartanto,Mohd Helmi Ali,Kim Tan,Fauziyah Sjahroeddin,Lusianus Kusdibyo (2019). Loyalty toward online food delivery service: the role of e-service quality and food quality.
Elise Kolaas (2016). From Customer-Based Brand Equity to Student-Based Brand Equity: How should universities brand themselves to international students?.
G Tripathi (2017). Customer satisfaction and word of mouth intentions: testing the mediating effect of customer loyalty.
No ethics committee approval was required for this article type.
Data Availability
Not applicable for this article.
How to Cite This Article
Bomi Juliet Sama. 2026. \u201cStudy of Consumers Satisfaction Regarding Fast-Food Restaurants in Cameroon\u201d. Global Journal of Management and Business Research - E: Marketing GJMBR-E Volume 22 (GJMBR Volume 22 Issue E3).
Explore published articles in an immersive Augmented Reality environment. Our platform converts research papers into interactive 3D books, allowing readers to view and interact with content using AR and VR compatible devices.
Your published article is automatically converted into a realistic 3D book. Flip through pages and read research papers in a more engaging and interactive format.
Our website is actively being updated, and changes may occur frequently. Please clear your browser cache if needed. For feedback or error reporting, please email [email protected]
Thank you for connecting with us. We will respond to you shortly.