
I. INTRODUCTION
For several decades, several researchers have been interested in studying the integration of stock markets. Indeed, the stock market, like the financial markets according to Levine, (1997) fulfills a primary function, i.e. to facilitate the allocation of resources, through space and time in an uncertain environment. The development of the stock market aims at facilitating trade, diversifying risks, providing liquidity, and reducing information asymmetry, which will attract foreign investors and thus positively affect the level of international financial integration. In the literature, there are several studies on the integration of Asian and African emerging markets.
De santis and Imrohoroglu (1997), using a GARCH model, showed that neither country-specific risk nor global market risk is assessed and therefore no conclusions can be drawn about the impact of market liberalization. Menon et al (2009) studied the linkages between the stock markets of India, Hong Kong, and America, using the Engle-Granger cointegration test. The results reveal that there is no interconnection between the stock markets of India and America or India and Hong Kong. Going in the same direction, Saha and Bhunia (2012) conducted their investigations on the Indian and South Asian markets through stock index data from August 2002 to August 2011. As a result, they argue that these markets are interconnected in the short run as well as in the long run.
Jacob and Littleflower (2022) through a cointegration regression studied the interdependence between six Asian and African stock markets including India, China, Singapore, Japan, Indonesia, and South Africa. The results reveal that all markets have substantial correlations with the Indian stock market, with the exception of the Chinese stock market. However, the stock markets of India and Shanghai show some correlation, and when the stock markets of India and Singapore are interconnected, the correlation between the stock markets of India and America is low. The stock markets of India and Singapore are significantly correlated. Tai (2007), finds that market liberalization has reduced the cost of capital and price volatility for most countries.
Some studies have focused on the integration between Latin American stock markets, such as the study by Pegan and Soydemir (2000), which focused specifically on the US, Argentine, Brazilian, Chilean, and Mexican stock markets. The results show that the US stock markets strongly influence the Latin American markets, but the responses are not homogeneous. Furthermore, the effects of US innovations are increasingly felt in the stock markets of Mexico, Chile, and Brazil than in the other markets. Finally, Argentina and Chile seem to be more sensitive to a shock in the Brazilian market than to a shock in the Mexican stock market. Chen, Lobo, and Wong (2006) analyzed the link between the Indian and US stock markets using a fractionally integrated VECM and a multivariate GARCH model. The results support the presence of cointegration between the markets.
The Ivory Coast, like the WAEMU countries, Nigeria and Ghana, has made enormous progress in the African economy in recent decades. This progress is due to multiple economic and political reforms, notably, the strengthening of competition, the deepening of finance through innovative instruments, the easing of restrictions on foreign capital flows and the reduction of transaction costs, and the improvement of liquidity.
The objective of this research is to study the relationship of the WAEMU stock market with the stock markets of Ghana and Nigeria. To do so, this research is organized as follows: the second part presents the estimation technique to be adopted; the third part is devoted to the presentation and analysis of the results obtained, and finally, the fourth and last part will be devoted to the conclusion and discussions.
II. METHODOLOGY
This study is based on a cointegration regression in the West African zone during the period 1993 to 2020. The data to be analyzed are taken from the World Bank database (WDI).
Three cointegration estimators will be used to test the causal links between economic growth, demography, and human capital. These will be the Fully Modified Ordinary Least Squares (FMOLS) estimator (Phillips and Hansen, 1990), Canonical Cointegration Regression (CCR) (Park, 1992), and Dynamic Ordinary Least Squares (DOLS) (Stock and Watson, 1993). These estimation methods overcome some of the limitations of the ordinary least squares (OLS) method. Indeed, these techniques deal with the problems of serial correlation and endogeneity that could arise in the presence of cointegration.
a) Model Specification
This study aims to analyze the integration of West African stock markets. Thus, unlike the economic literature, which uses stock market indices, we will use the market capitalization of domestic listed firms (% of
GDP) as a proxy for the size of the financial market. Following Jacob and Littleflower (2022), we will use a linear regression model that will be specified as follows:
With:
, is the endogenous variable of the stochastic model. It represents the market capitalization of domestic companies listed on the WAEMU stock exchange; means the market capitalization of domestic companies listed on the Ghana Stock Exchange; means the market capitalization of domestic companies listed on the Nigerian Stock Exchange; is the stochastic disturbance.
III. RESULTS
a) Preliminary Test Results
Before conducting any statistical test, the quality of the quantitative data must be checked. In the context of this study, two tests are essential: the test for measuring multicollinearity and the descriptive statistics of the variables.
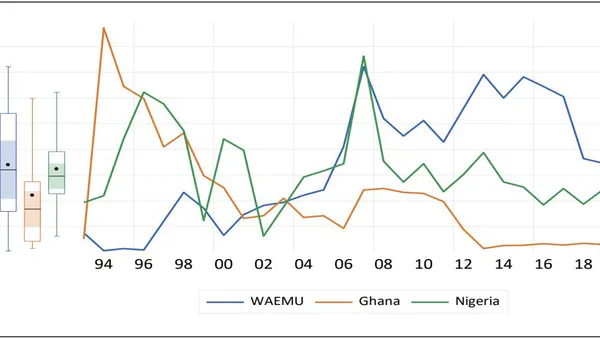
![Figure 1: Evolution of the Capitalization of Wes-19.00]t African Stock Markets](https://doc.globaljournals.org/gzyq21_56611/ocr/images/derivatives/0f/0f5ab1258aa728f0fe6e29bb23cea51fa0d9af1b6f0f44964bcdb8eed0c56fa2.webp)
Source: Prepared by the Authors based on the Results of the Eviews Software
| WAEMU | GHA | NGA | |
| Mean | 13.594 | 8.858 | 12.936 |
| Median | 12.893 | 6.777 | 11.900 |
| Maximum | 28.877 | 34.886 | 30.508 |
| Minimum | 0.234 | 0.582 | 2.497 |
| Std. Dev. | 9.180 | 8.482 | 6.127 |
| Skewness | 0.145 | 1.441 | 0.999 |
| Kurtosis | 1.730 | 4.710 | 4.062 |
| Jarque-Bera | 1.977 | 13.115 | 5.981 |
| Probability | 0.371 | 0.001 | 0.050 |
| Sum | 380.650 | 248.047 | 362.235 |
| Sum Sq. Dev. | 2275.752 | 1942.551 | 1013.676 |
| Observations | 28 | 28 | 28 |
| WAEMU | 1.000 | ||
| GHA | -0.614 | 1.000 | |
| NGA | -0.006 | 0.355 | 1.000 |
Table 1 above shows that over the 28 years of observation, the time series behave well overall. Indeed, the data do not suffer from any "outlier" problems insofar as the mean of each series and its median are roughly equal. A remarkable observation from the descriptive statistics is that the time series follows a normal distribution, with the exception of the Ghana stock market. Indeed, the P-value of the Jarque-Bera statistic is below the threshold. With regard to the correlation matrix between the series, the results provide insight into the negative long-run linkages between the UEMOA stock market and the other key markets, notably Ghana and Nigeria.
b) Results of the Stationarity and Cointegration Tests
The study of stationarity is essential for the validity of a time series regression. Indeed, this analysis is a priori necessary to avoid spurious regressions. In the context of our analysis, we will use formal tests, in particular the Augmented Dickey-Fuller (ADF) test of Dickey and Fuller (1981), and the Phillips-Perron (PP) test of Phillips and Perron (1988).
| Variable | ADF-I (0) | ADF-I (1) | PP-I (0) | PP-I (1) | ||||
| t-Statistic | Prob. | t-Statistic | Prob. | t-Statistic | Prob. | t-Statistic | Prob. | |
| WAEMU | -1.557 | 0.489 | -4.905 | 0.000 | -1.540 | 0.4984 | -4.908 | 0.000 |
| Ghana | -2.541 | 0.117 | -11.372 | 0.000 | -1.373 | 0.153 | -10.282 | 0.000 |
| Nigeria | -0.782 | 0.367 | -5.598 | 0.000 | -0.883 | 0.324 | -10.438 | 0.000 |
As the time series are stationary in the first difference, we will attempt in the following to confirm the presence of one or more cointegration relationships between the series. In the context of this study, we have used the Johansen (1988) cointegration test.
Indeed, this test makes it possible to estimate the following stochastic model:
Where is a matrix written as follows:
To perform this test, the Johansen statistic is calculated by the following expression:
Where is the number of observations; denotes the order of the matrix ; is the number of variables; denotes the values of the matrix .
The choice of the Johansen test is justified by the fact that this test is an improved version of the Engle-Granger test. It avoids the problem of choosing a dependent variable and the problems created when errors are carried over from one step to the next. As such, the test can detect multiple cointegration vectors. In practice, it is necessary to determine the
optimal number of lags according to the Akaike and Schwarz information criteria before applying the Johansen test.
| Lag | LogL | LR | FPE | AIC | SC | HQ |
| 0 | -249.981 | NA | 56760.97 | 19.460 | 19.605 | 19.501 |
| 1 | -213.598 | 61.570* | 6957.108* | 17.353* | 17.934* | 17.520* |
| 2 | -207.205 | 9.344 | 8790.433 | 17.554 | 18.570 | 17.846 |
| Lag | LogL | LR | FPE | AIC | SC | HQ |
| 0 | -249.981 | NA | 56760.97 | 19.460 | 19.605 | 19.501 |
| 1 | -213.598 | 61.570* | 6957.108* | 17.353* | 17.934* | 17.520* |
| 2 | -207.205 | 9.344 | 8790.433 | 17.554 | 18.570 | 17.846 |
The results show that in addition to the Akaike information criterion (AIC) and the Schawrz information criterion (SC), all other criteria such as the Hannan-Quinn information criterion (HQ), the Final Prediction error (FPE) and the sequential modified LR test statistic (LR), indicate an ideal delay length of 1.
| Hypothesized | Trace | 0.05 | ||
| No. of CE(s) | Eigenvalue | Statistic | Critical Value | Prob.** |
| None * | 0.561213 | 38.92391 | 29.79707 | 0.0034 |
| At most 1 | 0.397163 | 15.03541 | 15.49471 | 0.0585 |
| At most 2 | 0.012279 | 0.358284 | 3.841465 | 0.5495 |
Table 3 above, reveals the existence of a cointegration vector between the WAEMU, Ghana, and Nigeria stock markets. Indeed, the Trace statistic is sufficient to reject the null hypothesis at the significance level. Specifically, there is a long-run equilibrium relationship between the variables in the study. This justifies the choice of our estimation methods namely: FMOLS, DOLS CCR and ECM.
c) Results of the Long-Term Estimates: FMOLS, DOLS, and CCR For the rest of our analysis, we use these three estimators because of their advantage over traditional Ordinary Least Squares estimates. Indeed, these methods present more robust and reliable results, especially in small sample sizes.
| Dependent variable | WEAMU stock market | |||||
| FMOLS | DOLS | CCR | ||||
| Coeff | Prob. | Coeff | Prob. | Coeff. | Prob. | |
| Ghana | -0.982* | 0.0000 | -1.801* | 0.000 | -1.016* | 0.000 |
| Nigeria | 0.498 | 0.131 | 1.712* | 0.008 | 0.584 | 0.141 |
| Constante | 16.282* | 0.001 | 6.9321 | 0.249 | 15.381* | 0.004 |
| R2 adjusted | 0.417 | 0.678 | 0.396 | |||
| Note: *, **, *** denote the rejection of the null hypothesis at the 1%, 5%, and 10% significance levels respectively | ||||||
The results of this table reveal that, in all three estimation methods, the development of Ghana's stock market is statically significant and negative at the significance levels. This means that the development of the Ghanaian stock market induces a decrease in the attraction of the BRVM stock market. There is therefore a substitution effect between these two markets.
In addition, the results of the FMOLS and CCR estimations show the existence of positive but nonsignificant effects of the development of the Nigerian stock market on the development of the BRVM stock market. However, the DOLS estimation proves the existence of a significant and positive effect. There is therefore a complementarity effect between the BRVM market and the Nigerian market.
In general, the operations of the stock market are dependent on the operations of other stock markets in the world. Historical events such as the Russian-
Ukrainian invasion are no exception. Econometrically, the DOLS estimate performs better with a predictive power of 0.678 or .
This research will be very useful to understand on the one hand that the DOLS estimator performs better in the presence of a cointegrating relationship between the variables studied. On the other hand, the study allows us to understand how the policies adopted by other nations affect the BRVM stock market.
d) Estimation of the Error Correction Model (ECM)
According to d'Engle and Granger (1987), the natural extension of cointegration is to estimate the short-term dynamics. Thus, having confirmed the presence of a cointegrating relationship, the results of the short-term estimates of the error correction model (ECM) are presented in Table 5 below.
| Dependent variable | WEAMU stock market | |
| Short-term estimate | ||
| Variable | Coefficient | Prob. |
| D (Ghana) | -0.193** | 0.089 |
| D (Nigeria) | 0.267** | 0.018 |
| RESID (-1) | -0.274** | 0.029 |
| Constante | 0.341 | 0.656 |
| R2 ajusté | 0.273 | |
| Long-term estimate | ||
| Variable | Coefficient | Prob. |
| Ghana | -0.759* | 0.0000 |
| Nigeria | 0.364* | 0.0000 |
| Constante | 15.603* | 0.0002 |
| R2 ajusté | 0.38 | |
If we consider Certirus paribus, Table 5 above shows us that in both the short and long run, Ghana's stock market has a negative and significant effect on BRVM while Nigeria's has positive and significant effects on it. However, in the long run, all coefficients become increasingly significant, i.e. they are all significant at the significance level.
The speed of adjustment towards the equilibrium fulfilled the condition of the validation of the error correction model (RESID (-1)), i.e. it is negative and significant at the threshold. It means that following a shock, the response variable of the BRVM stock market regains its equilibrium according to the frequency of . In other words, following a shock, the structural variables explain the BRVM's market capitalisation by in the long term, and that the shock is completely resolved after 4 years .
IV. CONCLUSION
The objective of this paper is to analyze the dynamics of stock market integration in the ECOWAS region. This relationship has been widely studied in the economic literature. In fact, it is clear that the stock markets in the ECOWAS region are fully integrated and show potential for portfolio diversification and anomaly. To analyze this relationship, we tested three cointegration estimators [FMOLS], [DOLS], and [CCR], and the error correction model (ECM) over the period 1993-2020. The results of the study show that Ghana and Nigeria, two capital markets, are linked to the WAEMU stock market. This means that foreign investors are less likely to diversify their portfolios and make money in the long run by investing in these economies. Specifically, it suggests that over time, and due to the proximity of the stock markets, the evolution of the Ghanaian stock market will confuse investors who will have choices between investing in Ghana or in the WAEMU zone. It is therefore appropriate for economic policymakers to take into account the proximity between stock exchanges in order to reduce the adverse effects of one on the other. As a policy implication, this study underlines that it would be wise for investors to take this interdependence into account before taking any action in the WAEMU market in order to make their assets profitable.