Data-driven Knowledge agriculture using mechanized intelligent computer-based monitoring and control systems and complex Software for machine learning and visualization for predicting a variety of parameters such as future food requirements, resource planning for higher yield, and supply chain is the future of farming. This needs to be urgently adopted by the world farming community to provide food to the growing world population, remove hunger, and at the same time sustain planet resources by judicious uses of input such as water, fertilizer, pesticide etc., as envisioned by Sustainable Development Goals 2030. This paper discusses data-driven technology for identifying trends and other insights for making informed decisions for enhanced productivity and profitability, through market research and evaluating customer needs and sentiments.
## I. INTRODUCTION
Knowledge AgricultureTM is a new way of farming that uses technology and tools such as IOT (Internet of Things), Robotics, AI (Artificial Intelligence), UAV (Unmanned Aerial Vehicles), Cloud, Greenhouse, BA (Business Analytics)and specialized software for weather modeling, smart zone seeding, fertilizer modeling, (Srivastava, 2018; Definitions,2022), to address issues relating to food requirements of current 8.0 billion world population, estimated to grow to 9.8 billion in 2050 (PRB, 2016). The current practice of farming in most of the countries is based on traditional methods of sowing, harvesting, storage and marketing which results in poor productivity and profit. We define agricultural productivity as the ratio of outputs to inputs, expressed either in volumes or in physical quantities (kg, tons, etc.) (FAO, 2018). TFP (Total Factor Productivity) is a measure of the efficiency of the contribution of all the significant inputs into production. TFP provides a complete picture of productivity and is more closely connected to unit production costs and market prices than partial productivity indicators (Fuglie, 2015). There is a close relationship between agricultural productivity and farm incomes. Considering this, increasing farm income is at the center of measures related to food security, rural livelihoods, ending hunger in Africa and other parts of the Globe by 2030 and fulfilling SDG2030 targets on food and nutrition security. Despite the importance of agricultural productivity, data on various parameters required to analyze and deduce the current productivity and forecast the model for improved productivity is scarce and of poor quality. There is a need for new and enhanced data collection frameworks to better measure agricultural production and the amounts of inputs used in the production processes.
Data is becoming an ever-important factor in the world, and businesses are developing the skill to use data analysis as a tool for enhanced profit. Agriculture is not immune to this, and data-driven decisions are essential for improved agricultural productivity. Data analysis focuses on cleaning, modeling and visualizing data to provide descriptive, diagnostic, predictive, prescriptive and cognitive analytics. Descriptive analytics based on historical data may be used to generate reports to give a view of a farmer's production, sales and financial data. Diagnostic analytics helps in answering questions about why certain events happened for example anomalies that might be due to unexpected changes in a metric or a particular market. Predictive analytics techniques use historical data to identify trends, for instance changes in demand or consumption and determine if they're likely to recur. Prescriptive analytics is an application of(ML) (Machine Learning)that prescribes optimal actions to achieve a goal or target, for example use of lesser pesticides due to consumer's behavior of changing to organic food. It may also help farmers provide historical crop yield record with a forecast reducing risk management. Machine learning uses statistical algorithms that involve statistical and functional analysis of existing data to learn, a process called training. Patterns and relationships in the data identified during training are used to build a model. The model makes intelligent decisions about data it hasn't encountered before. A process called inference is used to make decisions about new data. Training ML models with larger volumes, more relevant, and accurate data increases the forecasting accuracy. Cognitive analytics helps analyse the various changes in a parameter, its effect, and its solution (Asakiewicz, 2016). Extensive studies on the predictive ability of ML techniques, such as multiple linear regression, regression trees, artificial neural networks, support vector regression, and k-nearest neighbor for crop yield production, have been undertaken (Gonzalez-Sanchez, 2014). ML and advanced sensing techniques have been used to analyze online multi-layer soil data, and satellite imagery of crop growth characteristics to predict wheat yield (Pantazi et al., 2016). 'Crop Advisor' is a software tool for predicting the influence of climatic parameters on crop yields (Veenadhari et al., 2014; Majumdar et al., 2017) SMAG, a French company has developed software using 30 years of weather data history, satellite and drone images, and soil types to enable users to track the progress during the life cycle of a plant and predict yields. $80\%$ of French agricultural land under wheat cultivation is managed through this algorithm. InVivo, France's leading agricultural cooperative group with 220 members using the technology, earns €6.4 billion in sales (Talend, n.d.).
## II. KNOWLEDGE AGRICULTURETM
Knowledge Agriculture aims to achieve the objectives enshrined in SDG2030 to increase the agriculture yield without harming the environment, sustaining planet resources, and simultaneously countering challenges such as depletion of water resources and increased erosion and loss of productivity due to the occurrence of extreme weather events. The recent global environmental changes are apparent caution to mankind to immediately change the way it produces food and makes it available to the present and future generations. This can be achieved by optimal use of input resources such as seed, water, fertilizer and chemicals by preventing loss in storage, transportation and supply. In knowledge agriculture, data is captured from several sources. Sensors and IOT (Internet of Things) are used to collect farm data such as soil moisture, humidity, temperature, heat, light, etc. A second database stores the survey report that includes, productivity of soils, suitability of soils for raising specific crops, etc. Another database contains details of time for planting, produce to be planted, row spacing, desired yield, waste recycling, water supply, etc. There are several other databases which store historical rates, market details, supply chains, etc. These structured, semi-structured, or unstructured data are ingested into local or cloud-based storage, computing, analyzing, and creating models for ML-based predictions and taking corrective actions. The data allows the farmers to use a DSS (Decision Support System), to make optimized decisions such as tending each plant with water and fertilizers, spraying pesticides, and eliminating the weeds by selective burning or tilling as per its need during the life cycle without damaging the desired plant. Further, supply chain network design, product design and development, demand planning, procurement management, customized production, inventory management, logistics, and agile supply chain are essential components in farm management. A sustainable global supply chain is becoming an ever-increasingly complex system, especially with the need to deal with international partners(McCue, 2020).Modern technologies, such as CEP(Complex Event Processing), RFID, block chain, IoT, and WSN(Wireless Sensor Networks), boost supply chain performance. Supply chain analytics allows quick adjustments and more effective tactical decisions.
## III. STORYTELLING FROM FARM DATA
### a) System Architecture for the use of machine learning models for Knowledge Agriculture
A system architecture for predictive analysis of historical and live data and taking corrective actions is shown in Figure 1.
 System Architecture for use of machine learning for Knowledge Agriculture Figure 1: System architecture for predictive analysis of historical and live data and taking corrective actions From the Figure, it will be seen that Knowledge Agriculture involves the use of IOT (Internet of Things) tools such as infra-red cameras, sensors (barometers, hygrometers, light meters, and ambient thermometers), electrodes, GPS (Global Positioning System) guided farm machines (tractor, drones) to detect physical parameters namely moisture, heat, light, pressure, nutrients and pests, etc. These data are streamed directly to the cloud, the technology that relieves the users from maintaining an elaborate computer system with expert staff including programmers and system administrators, for processing, monitoring, and analysis. The historical database is also held on Geo location of the farm, type of the crop (rice, wheat cotton, groundnut, millet), seasons when they are sowed/harvested, area (in hectares), production (in tonnes), average temperature $(^{\circ}\mathrm{C})$, average rainfall (mm), soil, pH (Hydrogen potentials) value, soil type, major fertilizers, nitrogen (kg/Ha), phosphorus (Kg/Ha), Potassium (Kg/Ha), minimum rainfall required, the minimum temperature required, etc. for optimum yield. Data on logistics, marketing chain, price (historical and current), consumers and input suppliers are also maintained on the cloud. Meteorological data is used for analyzing the weather variation. Bringing all the data to the cloud is part of data ingestion.
The data coming from different agencies may be in structured, unstructured, or in semi-structured formats. These need to be cleaned, normalized, categorized, and cataloged. Since the data is enormous and petabytes of big data need to be analyzed, it needs to be put in a way that analysis becomes possible, a few in real time for taking immediate corrective action in the farm such as tending each plant with water, fertilizers as per its need during the life cycle; eliminating the weeds by the spraying of pesticides, tilling or selective burning without damaging the desired plant. It may need certain data available in CSV (Comma-Separated Values) or JSON (JavaScript Object Notation) formats to be converted in a columnar form known as ORC or Parquet form. These activities come under processing.
The final analysis is done by building visualization for real-time monitoring of the crop for dry fields or identifying plants needing attention for the use of fertilizer, pesticide or heating, etc., and thus allocating resources dynamically and efficiently. Careful and precise application of all inputs for agricultural produce can maximize crop yields and thereby reducing cost, and at the same time minimize waste of pesticide and water usage. Dynamic evaluation of moisture content can stop the excessive use of water for irrigation. This is especially of great value for 18 countries, with almost four billion people who are using their water reserves to the point of exhaustion to produce grains(Earth Policy Institute, 2013). The consolidation of historical weather data with meteorological prediction can be used to build complex models to predict the time of sowing/harvesting the crop. Another real-time model for supply chain can track the movement of food to identify bottlenecks and optimize the movement of product by improving logistics. To summarize, the analysis provides the potential to foresee demand, assess user sentiment, promote coordination and collaboration throughout the supply chain through fleet management tracking solutions, and use GPS-oriented analytics to optimize routing, cut transportation costs and provide an advanced mapping of vehicle locations.
Big data analytics is a complex process of examining the massive amount of data to uncover information such as hidden patterns, correlations, and other insights like market trends and customer sentiments that enables organizations to make informed business decisions. We divide the entire analysis in
three steps, namely Data management, Analytics & visualization. This is shown in Figure 2. A few tools used in different stages are mentioned in the Figure.
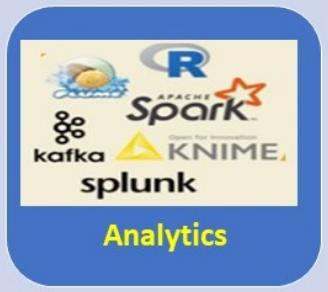
 Figure 2: Stages of Data analytics and visualization
Hadoop (Apache Hadoop Documentation, 2014) is an open-source framework written in Java that provides many analytical tools to store and process large datasets ranging in size from gigabytes to petabytes to generate new insight, which includes Machine Learning and data mining. The Apache Hadoop kernel has a storage part, known as Hadoop Distributed File System (HDFS), and a processing part known as the Map Reduce algorithm for parallel processing. Few of the tools are Apache spark (Spark Core Programming, n.a.; Kannan, 2015), a cluster computing platform to process batch applications, Machine Learning, streaming data processing, and interactive queries; Map Reduce (Seema & Jha, 2015), an Algorithm based on the YARN framework to perform the distributed processing in parallel in a Hadoop cluster; Apache Hive (Hiba et al. 2019), a Data warehousing tool that uses query language known as HQL or HIVEQL; Apache Impala, an open-source SQL engine; Apache Mahout(Anil et al. 2020), used for implementing various Machine Learning algorithms offering implementations of classification, clustering, dimensionality reduction and linear algebraic computations; Apache pig, an open-source Apache library that runs on top of Hadoop, providing a scripting language used for analysing massive datasets by representing them as dataflow (Swarna & Zahid 2017); HBase, a non-relational, NoSQL distributed, and column-oriented database that allows for data to be analysed in real-time, as it is entered (History of Apache
HBase, n. a.); Tableau, a software to generate helpful visualizing charts on interactive dashboards and worksheets and many more used in the Business Intelligence Industry (Tableau, n. a.). These tools, with their short descriptions, have been shown in Figure 3.
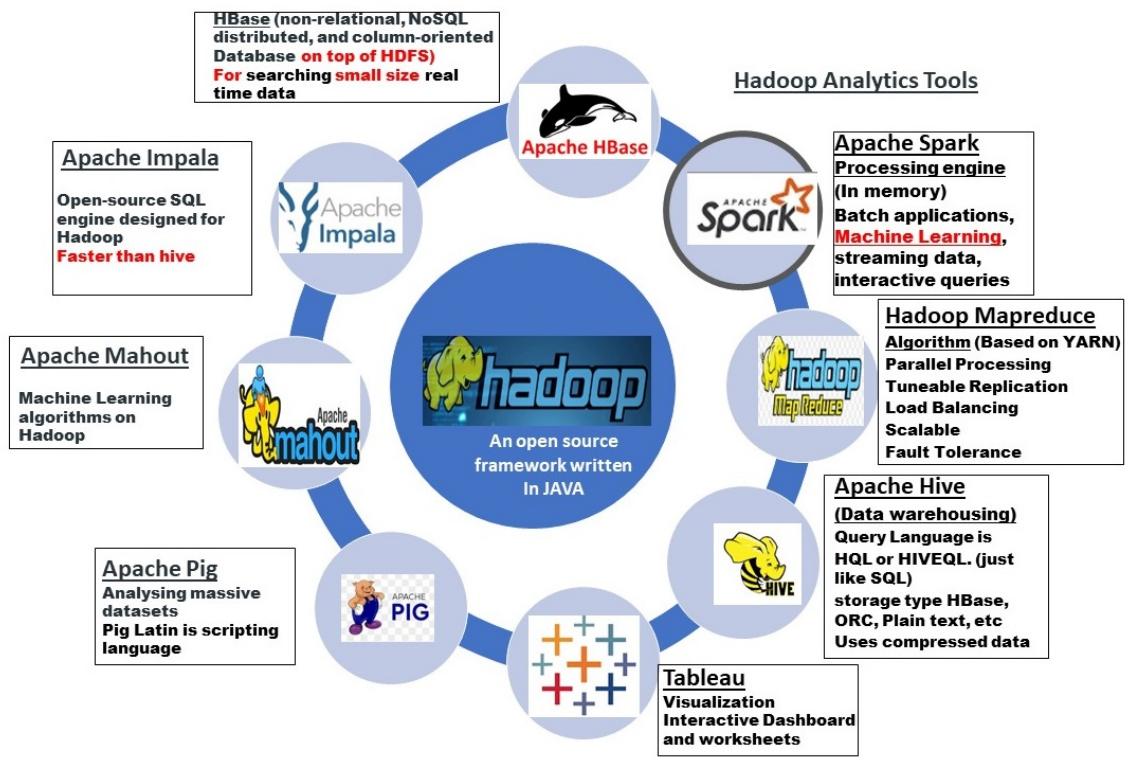 Figure 3: Hadoop Analytics tools for Big Data analysis
## IV. CLOUD-BASED ARCHITECTURE
Open-source tools can be used for Knowledge Agriculture data analytics, visualization, and undertaking corrective action using BI (Business Intelligence) tools like a tableau. However, this needs hardware and software infrastructure with competent programmers. The alternate solution is to use Cloud-Based platform which offers "SaaS (Software as a Service), PaaS (Platform as a Service), and IaaS (Infrastructure as a Service)" (IBM Cloud Education, n. a.). SaaS utilizes the internet to deliver applications that run directly through web browsers, thus sparing the employees and companies from the efforts of installing, managing, and upgrading software. PaaS provides a framework for developers to build upon and create customized applications. IaaS is a form of virtual cloud computing technology that provides highly scalable infrastructure, including servers, networks, operating systems, and storage. Using IaaS, businesses hire resources on-demand and scale it as per their requirements instead of having to buy the hardware outright. Google Cloud Platform Services (GCP), Amazon Web Services (AWS), Microsoft Azure, Digital Ocean, Linode, Rackspace, and Cisco Metapod are a few companies providing IaaS. In 2020, the cloud-based segment had the largest share of the agriculture analytics market. The large share of cloud-based market is primarily due to easy accessibility, lower maintenance, affordable pricing, and reliable security. Furthermore, benefits provided by cloud-based solutions in terms of SaaS, PaaS, and IaaS for agriculture analytics are helping the segment grow at the highest speed. A few basic architectures based on a few major cloud service providers for big farm data analytics are discussed below.
### a) Google Cloud Platform (GCP)-based architecture
A typical system architecture based on the Google cloud platform is shown in Figure 4. Here, data from IOT devices are captured using MQTT protocol through IOT core (fully managed Service for securely connecting and managing millions of IoT devices), and data is prepared through DataPrep (explores, cleans, and prepares structured and unstructured data for analysis). Thereafter this data is analyzed along with the other historical database stored in Firestore (a NoSQL document database), using Cloud Functions (a serverless execution environment for building and connecting cloud services) and BigQuery/ML that creates and executes machine learning models. The information after analysis is made available to Data analysts/farmers through Pub/Sub, which provides messaging between applications.
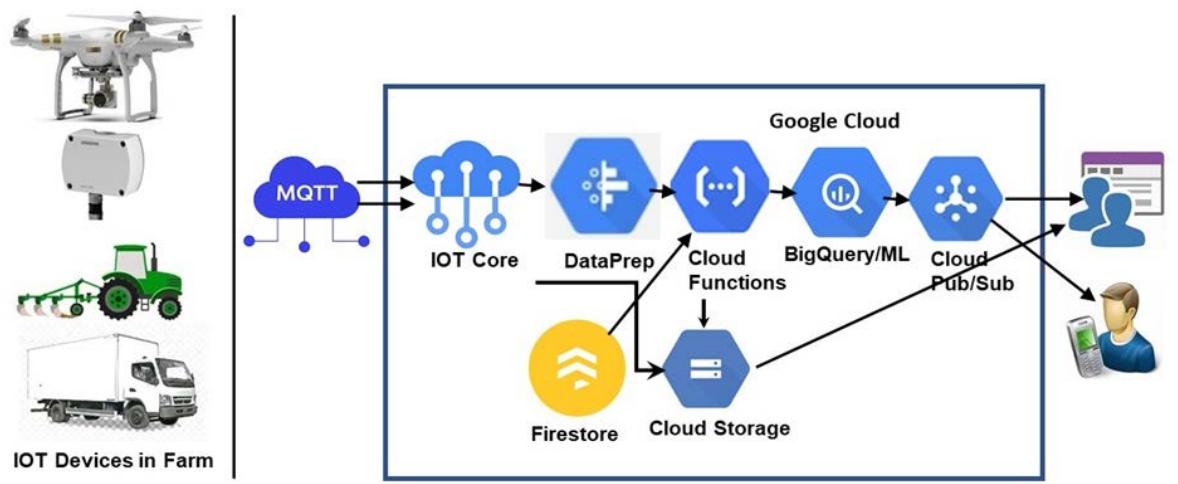 Figure 4: System architecture for farm data analysis and prediction based on Google cloud (Note: The GCP icons are available in the open domain)
## i. Use case-Taranis (Google cloud along with Tensor Flow)
As much as forty percent of crops in agriculture are regularly lost due to pests, crop illnesses, weeds, and lack of nutrients. Using drone technology and artificial intelligence, Taranis (Taranis, n.d.), working in several countries worldwide, with more than 20 million acres of land in Russia, Eastern Europe, and South America, is providing farmers with modern tools on the cloud along with Tensor Flow to reduce crop loss, increase yields, and lower costs (Google Cloud, n.d.). To develop BI (Business Intelligence) models, drones were deployed to capture tens of millions of photographs over the past year and a half, which have been analyzed and tagged. Each photo has up to a thousand items of interest, such as insect damage or leaf discoloration. The company claims to have processed around 100 million distinct features in approximately 700,000 images. The insights provided through visualization provide farmers with the information that enables them to intervene early and prevent crop loss. Farmers can target problems with concrete solutions, like adding fertilizer in a specific area with low in nutrients. The scalable Compute Engine dedicates information from the images when new images arrive. Data is uploaded to a Cloud SQL database for further analysis.
Tensor Flow (TensorFlow, n. a.) is an open-sourced machine learning platform that delivers a complete functional solution with a focus on deep neural networks to analyze massive amounts of unstructured data. It contains a diverse and complete set of libraries, tools, and community resources. Tensor Flow is used for building the machine learning models by using tens of millions of photographs of agriculture fields for training. Feeding the dataset for the new photographs and comparing them with models is used to discover items of interest, such as insect damage or leaf discoloration.
### b) Amazon Web Services (AWS) based architecture
A typical broad system architecture using AWS is shown in Figure 5. It would be observed from the Figure that broad modalities are similar. The IOT data is streamed using a tool known as Kinesis which allows real-time streaming of IOT data from the devices deployed on the farm. Another tool, IoT Core connects billions of IoT devices such as sensors, actuators, embedded devices, wireless devices, and smart appliances over MQTT, HTTPS, and LoRa WAN protocols and routes trillions of messages to users without managing any infrastructure.
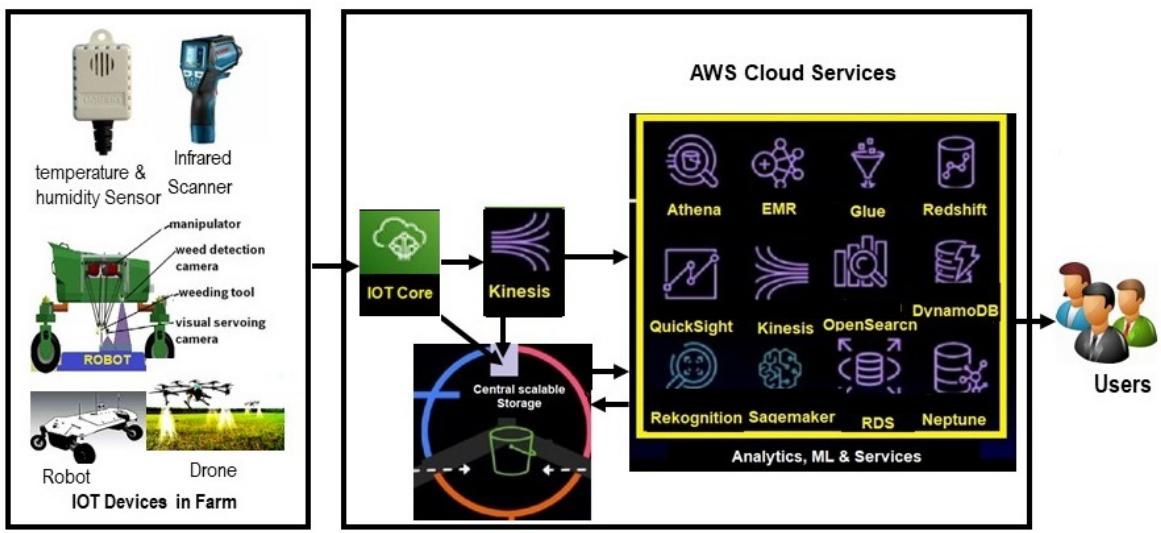 Figure 5: System architecture for farm data analysis and prediction based on Amazon Web Services (AWS) (Note: The AWS icons are available in the open domain)
Kinesis Data Analytics (KDA) analyzes streaming data to gain actionable insights and responds to farmers' needs in real-time. It also generates real-time alerts and dashboards. KDA supports standard ANSI SQL and provides an easy-to-use schema editor. It includes open-source libraries based on Apache Flink. IoT Analytics datasets can be taken to the Quick Sight console (Business intelligence tool) for creating dashboards and visualizations. Red shift is a high-performance, petabyte-scale data warehouse service for analytical processing (OLAP) workloads, while RDS Postgre SQL or Aurora typically stores terabytes of relational data for on-line transaction processing (OLTP) workloads. Dynamo Db stores non-relational data, and Neptune is a fully managed graph database. Glue is a server less data integration and ETL (Extract, Transform and Load) tool used for discovering, preparing, and combining data for data analysis and Machine Learning. Open Search provides for free-text search. Athena is a serverless interactive query service, an upgraded SQL query engine from the Trino open-source project, that makes it easy to analyze data in storage using standard SQL. Amazon has developed their own EMR, which is taking the place of Apache Hadoop and Apache Spark. This makes it simpler to perform tasks that involve big data analysis such as data transformation, graph analytics, and machine learning on a managed cluster platform. Rekognition is part of the artificial intelligence services provided for image analysis.
## i. Use cases
Mantle Labs(Mantle Labs, n. a.)uses the AWS cloud platform to automate the processing of satellite data from 500 million hectares of agricultural land spanning six continents for tracking vegetation health, soil moisture, and climate impact daily. This service provides an accurate, near real-time risk assessment to the world's 600m farmers, instantly. The company states that it can accumulate and analyze billions of pixels of imagery from several satellites on a daily basis to create a data cube of the entire world. It uses Elastic Container Registry (ECR) for storing container images and Fargate as a serverless compute engine. ECR allows sharing and downloading of images securely over Hypertext Transfer Protocol Secure (HTTPS) with automatic encryption and access controls. Fargate is a serverless compute engine that enables building applications without managing servers. Mantle Labs also leverages Simple Queue Service (SQS) for event-based batch processing of satellite images. The data analysis forecasts crop health, forest changes, climate impact, crop observation, drought impact analysis, and field-level profitability analysis. The deep learning engine has the capability to examine petabyte-scale data to provide high-resolution analysis for any area on the planet. The farmers can use the platform for crop monitoring and near real-time production estimation, including commodity price forecasts, production, and supply chain analysis. To bank and insurance companies, it offers credit risk assessment, underwriting and pricing, portfolio creation and risk diversification, claims fraud management, and processing (AWS, n. a.). Mantle Labs, with the Agri-EPI Centre, offered its Geobotanics platform, which runs crop monitoring solutions, for UK (United Kingdom) food security during the coronavirus pandemic ("Crops and Soil Newson Agri-tech partners support COVID-19 food security", 2020).
GeoPard, Köln, Germany (GeoPard, n. a.) uses AWS for spatial data analytics and artificial intelligence algorithms for crop farming that automates workflows to create VRA maps for seeding, fertilizing, and crop protection based on various data sources and agronomic logic. Variable-rate technology (VRT) allows determination of the exact number of passes over an area to deliver the right amount of farm inputs such as fertilizer, chemicals, pesticide, lime, gypsum, and irrigation water. By creating a Zones Map from specified data layers such as Topography, Satellite Images, Soil Sampling, High-Density Sensors and Cameras, Applied Datasets of Yield, VRA maps can be employed for any agricultural field. Data visualization leads to new ideas, and analytics helps to solve problems by creating solutions and writing prescriptions agronomists.
CropX captures raw data from global soil sensors and integrates it with topography/soil maps, weather forecasts data, satellite imagery, hydraulic models, crop models, user inputs, data from the controllers, and agricultural equipment such as sprayers, tractors & harvesters, and then ingests it to a centralized platform running on Elastic Compute Cloud (Amazon EC2) instances. It then analyses and saves satellite imagery, agronomical data, and insights in the cloud storage. It uses SNS to transfer messages between services. The Service provides crop-specific and growth-stage-specific insights and recommendations, such as advising farmers when, where, and how much to irrigate, fertilize and spray (CropX, n. a.).
### c) Microsoft Azure
Farm Vibes. AI (Project Farm Vibes, n.a.) is Microsoft's open-source Multi-Modal Geospatial ML Models for Agriculture and Sustainability. There are three main components of FarmVibes.AI. The first one consists of data ingestion from sources such as satellite imagery (RGB, SAR, multispectral), drone imagery, weather data, custom sensor data (such as weather sensors), and more. The input data is pre-processed for building ML models with ease based on parameters that can be specified. The inbuilt notebooks are used to tune the models to achieve a level of accuracy for the specific parts of the world or seasons. The library includes data for detecting practices (for example, harvest date detection in the country for a particular crop), estimating climate impact (both seasonal carbon footprint and long-term sustainability), microclimate prediction, and crop identification. The artificial intelligence arm of Farm Vibes has three parts, namely, Async Fusion, which pairs sensors and satellite imagery to create nutrient heat and soil moisture maps; Space Eye, which removes clouds from satellite imagery; Deep MC, which uses sensor data and weather forecasts to predict the temperatures and wind speeds of a farm's microclimate; and a "what if" analysis tool that predicts effect on the soil's carbon sequestration abilities based on variances in farming methods.
## i. Use Case-Bayer
Bayer's Climate Field ViewTM is a data integration tool that provides yield analysis, field region reports, field health imagery, and manual seed scripts. As per the company's report, the Software is being used on more than 180 million farming acres across more than
20 countries. Microsoft and Bayer have entered into a strategic partnership to build a new cloud-based set of digital tools and data science solutions to enable the rapid development of agriculture food tech applications by the combination of modern cloud technology and adding a layer of data(Digital Farming, n. a.).
## V. CHALLENGES
Soil fertility has severely degraded in many parts of the world due to intensive agriculture, increasing use of fertilizers and pesticides, over-grazing, water pollution, deforestation, salinization, and accumulation of non-biodegradable waste. Climate change due to global warming further aggravates land degradation, soil erosion, and soil fertility. Natural disasters like flooding and landslides are being witnessed more frequently worldwide. Severe soil degradation can reduce crop yield by over $50\%$ (FAO, 2019). At the same time, Food and Agriculture Organization of the United Nations has estimated that the world population will exceed 9 billion by 2050, and the world will lose about 250 million cropproduction acres due to urbanization and soil degradation from excessive tillage and other farming practices (Wilde, 2021). Food loss and waste (FLW) in production, postharvest and consumption stages are 24, 24, and 35 percent, respectively, accounting for more than 80 per cent of food wastage in these stages, which is quite alarming (Li et al, 2017).
The agriculture analytics market is expected to grow to (2.27 billion by 2027, at a CAGR of (17.5%) from 2020 to 2027. The key factors driving the growth are rising pressure to meet global demand for food, especially in the current world environment of food shortage due to the COVID epidemic, climate changes, and war. This environment has led to an increasing need for improved farm productivity that is possible only by the use of Knowledge Agriculture deploying modern tools and technology of AI and predictive analytics to improve the yield and cut down the losses of 1.2 billion tonnes globally; (40%) of all food is never eaten when both farming and post-farming are taken into account, as per WWF-UK (WWF, 2021). Going with cloud-based technologies and applying big data in the agribusiness chain will reverse the trend of farmers selling their land for choosing employment in the service sector and make the agriculture business profitable.
The lack of technical know-how among farmers, the fragmented agriculture industry, and need for heavy capital investment for Knowledge Agriculture, lack of standardization for data management and data aggregation may hamper the growth of this market. Further, political compulsions, farmers', and trade unions' lack of trust in industrialists and solution providers are significant impediments. One of the most significant challenges is discovering stable business and operational frameworks for private-public collaborations. The Indian Government's withdrawal of farm bills is a pointer (Mukherji in Business Standard, Jan, 17, 2023). The explicit motive for data harvesting is the prediction of consumers' wants and needs. The farmers fear that the data collected by service providers can be manipulated by them for their own advantages. For example, the forecast of a higher need for fertilizer in a specific region of the world may lead to an artificial increase in prices in that region in collusion of service provider and fertilizer supplier. Beyond data access and infrastructure, digital democracy calls for a fundamental redistribution of decision-making power from a small number of corporate stakeholders to a broader group of farmers and citizens. GODAN (Global Open Data for Agriculture and Nutrition) of United Nations, currently with more than 374 partners from national governments, non-governmental organizations, international and private sector organizations, pleads for the active sharing of data on agriculture and nutrition among all the stakeholders (GODAN, n. a.). The European Commission's launch of public consultations on the Data Act with the possibility of imposing binding rules to provide governments access to private-sector data has started heated debates. The Data Act is a proposal by the European Commission for a legislative provision that "aims to create a fair data economy by ensuring access to and use of data for legitimate purposes, including in business-to-business and business-to-government [B2G] situations" (European Commission, 2021).
## VI. WAY-AHEAD
Linking data from farm operations on agricultural sites with information and knowledge collected from laboratories will be required to be effectively analyzed and used to optimize sector performance. The best possible solution for this is to make accessible global data from land globally and provide a platform for analysis and use for long-term sustainable development by improving economic opportunities for farmers. Upgrading the skills of all the stakeholders, resource persons in agriculture Universities, students and farmers, open access to research, meta-analysis, and available data publication is vital for food nutritional security. Providing more specialized Big Data analysis tools on mobile devices, and extending the information about the features, benefits, and limitations of each framework in various local languages will help the world population. Carnegie Mellon University is undertaking a research project for automatic speech recognition for 2000 languages from the present 200 (Science Daily, 2023). WDF University for SDG2030 has developed skill development on-line courses, which provide choice for translation of courses in many Indian and foreign languages (WDF University, n. a.). Hence, technological issues related to ingestion, analysis, processing, and application associated with Farm Data must be included in studies and constitute an essential research topic.
## VII. CONCLUSION
There is an urgent need to create a sustainable food system to feed the growing population on the earth. The climate crisis grew increasingly severe and irreversible in the year 2022. The world witnessed record ice melt at the poles, catastrophic flooding in Pakistan and China, record-breaking heat waves in the US (United States) and Europe, and severe drought in Africa. The war between Russia and Ukraine has led to rising energy prices and climate-fuelled droughts, and has pushed a perilously stretched global food system to the brink. The situation has led to an increased interest in investigating how our food is grown and ensuring that the most efficient practices are used. Efficiency in growing more food needs urgent use of tools and technology for Knowledge Agriculture. Countries have to adapt it to escape a cycle of catastrophes and debt. The 2030 agenda for 17 Sustainable Development Goals (SDGs) aims to end poverty and malnutrition around the globe, preserve the climate and environment while sustaining the planet's resources. The agenda was adopted in 2015, and now after, seven years (mid-term of 2015-2030), "the world continues to lose ground in its efforts to end hunger, food insecurity, and malnutrition", according to the report of SOFI(State of Food Security and Nutrition in the World) released in 2022 (Food and Agriculture Organization of United Nations, 2022). The information admits that "many of the SDG2 targets are growing wider each year". Eight hundred twenty-eight million people, around $10.5\%$ of the world population, were affected by hunger globally in 2021, an increase of 46 million since the end of 2020. Nearly 3.1 billion people globally could not afford a healthy diet in 2020, an increase of 112 million from 2019 due to the pandemic and war. The government of India has been providing free food, to prevent death from hunger, to its 814 million population since March 2020 under the National Food Security Act, which has been extended up to Dec. 2023 (The Economic Time, 2022). The total adds to 3.924 billion of 7.79 billion, about $50\%$ world population for the year 2020, lacking proper food during pandemic. Serious efforts are required to avoid the bleak future by using modern tools and technology to farm sustainably and climate sustainably and offer farmers an adequate advice, training, and skill.
Generating HTML Viewer...
References
42 Cites in Article
Lubana Al-Sayed (2020). Technologies at the Crossroads of Food Security and Migration.
Robin Anil,Capan (2020). Apache Mahout: Machine Learning on Distributed Dataflow Systems.
Christopher Asakiewicz (2016). Cognitive Analytics for Making Better Evidence-Based Decisions.
Mantle Labs Improves Global Food Supply Chain Financing on AWS.
L Brown (2013). Peak Water: What Happens When the Wells Go Dry? Earth Policy Institute.
David Bullock,Keith Curran (2019). On-farm Agronomic Research, Data Generation, and Modeling in the Data-Intensive Farm Management Project and Washington State Farmers Network.
Jane Loveday,Gregory Morrison,David Martin (2022). Identifying Knowledge and Process Gaps from a Systematic Literature Review of Net-Zero Definitions.
Kalluri Praveen (2025). Smart Farming and Digital Agriculture: Technology-Driven Solutions for the Future.
Peter Hustinx (2021). EU Data Protection Law: The Review of Directive 95/46/EC and the General Data Protection Regulation.
(2018). FAO fisheries and aquaculture in action.
(2019). Food and Agriculture Organization of United Nations (FAO).
(2022). The State of Food Security and Nutrition in the World.
Keith Fuglie,Nicholas Rada (2015). Policies and productivity growth in African agriculture.
Ben Schaap,Suchith Anand,André Laperrière (2020). Improving data access for more effective decision making in agriculture.
Alberto Gonzalez-Sanchez,Juan Frausto-Solis,Waldo Ojeda-Bustamante (2014). Predictive ability of machine learning methods for massive crop yield prediction.
Mohammad Salari (2025). AI Needs Cloud, Cloud Needs AI: How Google Cloud AI is Revolutionizing Healthcare.
A Hiba,Abu-Alsaad (2019). Retailing Analysis Using Hadoop and Apache Hive.
Iaas Vs PaaS vs. SaaS, IBM Cloud Education.
P Kannan (2015). Beyond hadoopma preduce apachetez and apache spark.
Li,G Xue,J Liu,X Parfitt,E Liu,Å Van Herpen,C Stenmarck,K O'connor,S Östergren,Cheng (2017). Missing food, missing data? A critical review of global food losses and food waste data.
Jharna Majumdar,Sneha Naraseeyappa,Shilpa Ankalaki (2017). Analysis of agriculture data using data mining techniques: application of big data.
Paul Labrogere (2008). Com 2.0: A path towards web communicating applications.
L Mccue (2020). Supply chain analytics: What it is and why it matters.
Mukherjee Sanjeeb (2023). Tuesday, January 17, 1709-10. ADDISON.
PM Narendra Modi withdraws three farm laws, asks farmers to go home. Business Standard.
X Pantazi,D Moshou,T Alexandridis,R Whetton,A Mouazen (2016). Wheat yield prediction using machine learning and advanced sensing techniques.
Gus Cicala (2020). Presenting Project Information with Microsoft Project 2019.
Asm Sayem (2023). Speech Analysis for Alphabets in Bangla Language: Automatic Speech Recognition.
Seema Maitrey,C Jha (2015). MapReduce: Simplified Data Analysis of Big Data.
Subhashini Chellappan,Dharanitharan Ganesan (2018). Introduction to Apache Spark and Spark Core.
Aprajita Srivastava (2018). Technology Assisted Knowledge Agriculture for Sustainable Development Goals.
Swa Rna C,Zahid Ansari (2017). Apache Pig - A Data Flow Framework Based on Hadoop Map Reduce.
Tableau (2018). Tableau.
Talend Big Data and Agriculture: A Complete Guide.
Taranis (null). Taranis.
Tensorflow Unknown Title.
(2022). MacInnes, Rt Rev. Rennie, (23 July 1870–24 Dec. 1931), Bishop of Jerusalem since 1914; Hon. Secretary, CMS in Egypt and the Northern Sudan, 1902–14; Hon. Canon of St George’s Collegiate Church, Jerusalem, 1909.
Deepak Vohra (2016). Apache HBase and HDFS.
S Veenadhari,Bharat Misra,C Singh (2014). Machine learning approach for forecasting crop yield based on climatic parameters.
Matt Wilde (2021). Farmland Loss Threatens Food Supply.
No ethics committee approval was required for this article type.
Data Availability
Not applicable for this article.
How to Cite This Article
Aprajita Srivastava. 2026. \u201cData-Driven Knowledge Agriculture: A Paradigm Shift for Enhancing Farm Productivity and Global Food Security\u201d. Global Journal of Science Frontier Research - A: Physics & Space Science GJSFR-A Volume 23 (GJSFR Volume 23 Issue A1).
Explore published articles in an immersive Augmented Reality environment. Our platform converts research papers into interactive 3D books, allowing readers to view and interact with content using AR and VR compatible devices.
Your published article is automatically converted into a realistic 3D book. Flip through pages and read research papers in a more engaging and interactive format.
Our website is actively being updated, and changes may occur frequently. Please clear your browser cache if needed. For feedback or error reporting, please email [email protected]
Thank you for connecting with us. We will respond to you shortly.