One of the critical transportation infrastructures is road tunnels and fire safety is one of the important aspects of their operation. Interaction between the fire, tunnel users, traffic, and fire safety measures influences fires in road tunnels. Therefore, a complex model is required to analyse the risk and quantify the consequences. In this paper, a novel quantitative risk analysis model developed for UK road tunnels is presented consisting of a quantitative consequence analysis model and a quantitative frequency frequency analysis model. The proposed quantitative consequence analysis model is provided through three sub-models; queue model, distribution model, and egress model. The frequency analysis is via an event tree that takes into account the tunnel fire rate in UK road tunnels. After a brief description of this model, the proposed method is illustrated through a case study of an urban road tunnel. The effect of different emergency ventilation systems on societal risk and sensitivity of the model to premovement time, accident frequencies involving Heavy Good Vehicles (HGVs), tenability threshold temperature, and different burning vehicles were studied in this case study.
## I. INTRODUCTION
The number of road and rail tunnels constructed worldwide within the last 15 years has increased. This increase is due to the considerable rise in traffic volume. Not only has the number of tunnels increased, but the type and complexity of fire safety systems used in them have also changed. Tunnels can relieve congestion in developed urban areas and reduce travel times in urban areas.
However, the growth of using tunnels results in an endogenous problem, the severity of accidents that may occur [1]. Although the accident rate in tunnels is lower than on open roads as shown in [2], accidents can lead to severe consequences due to tunnel nature. Fire is one of these disastrous consequences, which can cause human losses and structural damage [3]. Much research about tunnel fire dynamics and influencing parameters has been performed within the last 20 years. [4] summarized the main research in that field. Fire in Mont Blanc in France (1999; 39 fatalities), fire in Frejus in France (2005; 2 fatalities and 21 injuries), and fire in Yanhou in China (2014; 40 fatalities) have raised awareness of the safety issues of the tunnels, and that of the road tunnel users. Therefore, risk analysis has become one of the essential tools to improve and optimize the safety level of road tunnels. There are several methods of risk analysis to determine risks and evaluate the effectiveness of safety measures. One of these methods is quantitative risk analysis (QRA), which has been one of the explicit requirements under the European Union (EU) Directive (2004/54/EC) [5]. QRA includes event tree analysis and consequence analysis models. Various QRA models for fire in road tunnels have been developed by different countries, such as the TuRisMo model of Austria, the TUNPRIM model of the Netherlands, the Italian risk analysis model, and the OECD/PIARC model [6]. Societal risk represented graphically in the form of a frequency/ number of fatalities (FN) curve, is the main output of these models. The calculated societal risk must be evaluated by comparison with the risk acceptance criteria, i.e. must be less than a specified minimum and acceptable value (threshold) as presented in the case studies, for instance, Diamantidis, 2005 [7]; Botschek et al., 2007 [8]; Kohl and Zibert, 2010 [9].
In the UK, many of the 48 road tunnels have been constructed when transport conditions, knowledge, and technical possibilities were in their infancy and very different from the present. For instance, current traffic volume and its composition are not the same as decades ago. There are still tunnels under construction and also innovations today that permit the use of safety systems and devices that were improbable before.
Although the UK's design manual BD78/99, which was published in August 1999 and then superseded by CD 352 in March 2020, identifies risk analysis as a practical method for determining the risk level of all road tunnels in the United Kingdom, it must be improved and the lack of a quantitative risk model, a comprehensive system-based risk assessment tool to cover fires in road tunnels, is felt.
In other industries, the risk assessment system or software is widely used to be as a decision-support tool [10,11]. Therefore, it is important to develop a robust and flexible QRA software tool that is suitable for road tunnels.
As far as research work and further development of methods are concerned, efforts should focus on developing a systematic approach to performing a quantitative risk analysis (QRA) model for the UK road tunnels. Along with both legal regulations and requirements defined in the UK, the risk analysis model can be an additional tool to estimate the level of safety that meets the respective requirements. Consequently, a model of quantitative risk analysis concerning safety in road tunnels called LBAQRA has been developed to perform a risk analysis as required by UK regulations.
The LBAQRA performs a quantitative risk assessment and includes quantitative frequency analysis and quantitative consequence analysis.
This paper first presents a brief description of the sections of this model and how it derives the societal risk. In the second part, an illustrative case study was carried out to study the sensitivity of this model to various risk indicators, and the risk reduction potential of different ventilation strategies.
Risk assessment of fire incidents in road tunnels includes complicated scenarios as they constitute interactions among the fire, tunnel users, and safety measures such as fire detection, tunnel alarm, or emergency ventilation. Thus, many risk indicators, which affect risks for tunnel users, describe the scenario. In order to evaluate the LBAQRA and included risk indicators, Southwick Tunnel with 490 m length is investigated. The tunnel is an urban tunnel with approximately 46900 vehicle/day traffic density in the Eastbound bore. A total of 94 fire scenarios is included in this project. Under-study scenarios have different heat release rates (HRR), fire source locations, and traffic conditions. The influences of different emergency ventilation strategies including various activation times, ventilation velocities and operational strategies, and detection times on societal risk are studied. In each scenario, the possibility for safe egress is estimated by 3D fluid dynamics simulation via measuring tenability thresholds through the evacuation path. The sensitivity of the model to pre-movement time, accident frequencies involving HGVs, tenability threshold temperature, and different burning vehicles were studied as well.
## II. METHODOLOGY
The specific consequences of tunnel fires such as oxygen concentration decrease, and toxic gases' concentration increase make them one of the catastrophic hazards in road tunnels. Consequently, assessment of risk either quantitatively or qualitatively should be considered an influential tool to reduce such hazards. Although quantitative risk analysis models have been developed in countries such as Austria, Italy, and Singapore to improve the validity of qualitative risk analysis, there is a lack of a quantitative risk model, a comprehensive system-based risk assessment tool to cover fires for road tunnels in the UK. Therefore, it was decided to develop the most appropriate quantitative risk analysis model for safety in UK road tunnels, leading to improved and consistent decisions on the grounds of safety in the design and operation of road tunnels, LBA Quantitative risk analysis model (LBAQRA).
Due to the specific features of each tunnel, risks must be evaluated considering the tunnel geometry and its infrastructures, fire safety measures, as well as equipment and management procedures. In addition, it requires the analysis of many complex factors and processes related to human behaviour, such as pre-evacuation times, interactions between occupants, interactions between occupants and smoke, etc. These aforementioned parameters are taken into account in this model.
This model consists of two main sections: quantitative consequence analysis and quantitative frequency analysis.
### a) Quantitative Consequence Analysis
The number of fatalities is calculated via quantitative consequence analysis which comprises three parts: queue model, distribution model, and egress model.
The queue model calculates the length of the vehicle queue behind the fire by considering traffic density, percentage, and type of vehicles in each lane, and a comparison between tunnel closure time and saturation time. Then the number of vehicles queueing in each lane and consequently the number of exposed tunnel users is estimated by queue length and traffic density.
 Figure 1: The Process Sequence of Calculating the Number of People in the Queue.
After calculating the number of potentially exposed people, the distribution model is used to divide the queue into cells of the same size and then distribute tunnel users homogeneously. The total distance of the evacuation path is calculated by the distribution model taking into account both the longitudinal and lateral shares in the evacuation route. Exposed tunnel users distributed in each cell start the evacuation path from their initial position and they travel cell by cell towards a place of safety i.e., an emergency exit or the tunnel portal.
It should be mentioned that the structure of the queue formation model and the distribution model has been inspired by [12].
The egress model is a four-section timeline model. The first stage is detection which depends on the safety equipment in the tunnel $(t_{det})$. The second stage is the alarm stage which is the time between detection and the time when the alarm system is activated $(t_{alarm})$. The third stage is the pre-movement stage including recognition time, response time, and the time to exit the vehicle $(t_{pre})$. The distance users have from the accident and the severity of the fire influence the recognition time. The variation of response time is opposite to that of the recognition time as those who are actively evacuating influence those still in their car. The last stage is traveling, which depends on the movement speed and the distance to the emergency exit $(t_{travel})$. In this model, the relationship between walking speed and people density is used to estimate walking speed. The presence of other people can influence walking speed during evacuation.
The total time of these stages defines RSET (required safe escape time). According to this description, RSET was calculated through Eq.(1) as below:
$$
R S E T = t _ {d e t} + t _ {a l a r m} + t _ {p r e} + t _ {t r a v e l} \tag {1}
$$
The next step is the verification of users' egress process to find out if evacuees can start and then continue the evacuation process based on the considered tenability thresholds. In this section, the evacuation time is compared with the time when the tenability thresholds exceed their limits, ASET.
Three indicators are measured at humans' height at the centre of each cell to assess whether occupants can travel the evacuation path and reach a place of safety.
The Tenability Criteria used for this Model are:
- Fractional Irritant Concentration (FIC) $< 1$.
- Fractional Effective Dose (FED) $< 1$.
- Gas temperature $< 80^{\circ}C$
The total number of casualties is defined as the sum of fatalities in each cell where the tenability thresholds are exceeded (RSET>ASET). The total number of causalities in the whole tunnel is determined by the sum of fatalities in each lane.
### b) Quantitative Frequency Analysis
The quantitative frequency analysis is an event tree. The first column of the frequency event tree is initial fire frequency which has been obtained from the historical statics of fire incidents in England road tunnels. Then this initial fire rate is updated by considering the length, traffic volume, and gradient of the under-studied tunnel. Then the updated fire rate is distributed across event tree branches including "time of the incidents", "traffic condition", "type of fire incidents", "vehicle type", and "fire source location".
The results of quantitative consequence analysis and quantitative frequency analysis are presented in terms of social risk, as an FN curve. Risk acceptance is obtained using the ALARP (As Low as Reasonably Practicable) criterion in the UK.
## III. CASE STUDY
In order to achieve the purpose of this study mentioned in the introduction section, a specific tunnel was investigated. This tunnel, Southwick Tunnel, is located on the A27 between the junction of the Holmbush interchange (A27), portal A and the Hangleton interchange (A293), portal B, UK.
The structure is a twin-bore curved unidirectional road tunnel. Each bore is approximately 490 meters long and carries two lanes of traffic. The bores are connected by 3 cross passages, approximately 100m apart and 100m from either portal. This tunnel has a positive longitudinal slope of $3\%$ from portal A to B.
The tunnel equipped with a longitudinal ventilation system consists of 14 jet fans (7 pairs) installed at the ceiling of each bore. The system operates automatically to remove pollution from vehicle exhausts and also to help manage smoke in the event of a fire. Monitoring systems are considered to consist of the Tunnel Control Centre (TCC) with CCTV video surveillance, air quality monitoring, and automatic fire detection systems.
This tunnel has an annual average daily traffic of about 46900 vehicles/day traffic density in the Eastbound bore with an average percentage of $77\%$ passenger car, $0.2\%$ bus, $19\%$ truck, and $3.8\%$ HGV.
Three different traffic conditions, free fluid, congested, and stoppage, were considered. 158 MW, 47 MW, and 30 MW fire scenarios at three locations including 0.3L, 0.5L, and 0.8L (L is tunnel length) are studied. Overall, 94 scenarios were simulated via Fire Dynamic Simulator (FDS) to analyse different emergency ventilation systems for the aforementioned fire loads.
FN curves as the output of quantitative risk analysis and sensitivity analysis of this model taking into account pre-movement time, accident frequency involving HGVs, tenability threshold temperature, and different types of vehicles were carried out for the scenarios understudied.
## IV. RESULTS
### a) FN Curve
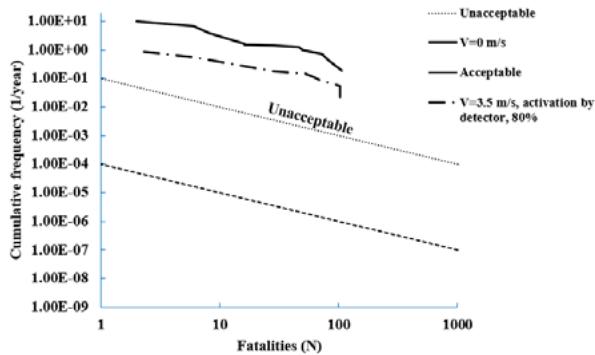
Five different ventilation conditions listed in Table 1 in the case of 158 MW, 47 MW, and 30 MW fire scenarios were studied to investigate the effect of ventilation system strategy on the FN curve. According to the Regulatory Reform (Fire Safety) Order 2005, all tunnel operators in the UK are obliged to take precautions to ensure that the safety risk in the tunnel is as low as reasonably practicable (ALARP). The ALARP limit, acceptable and unacceptable limits, was adopted by Moonis et al. (2008) [13]. In this study, three different traffic conditions including free flow, congested, and stoppage were considered. FN curve of scenarios without ventilation was located at the unacceptable region which means it could not meet the safety target (Figure 2 (a)). The comparison between scenarios without ventilation $(V = 0\mathrm{m / s})$ and other ventilation conditions in Table 1 was presented in Figure 2 (b, c, and d). According to FN curves, when the ventilation system was activated at $4\mathrm{min}$ after ignition, there was no obvious difference between FN curves of $V = 0\mathrm{m / s}$ and $V = 3.2\mathrm{m / s}$ with $4\mathrm{min}$ activation time (Figure 2 (b, c)). It means as the ventilation system was activated very late, it could not cope with the influences of fire and smoke. On the other hand, when the ventilation system was activated $2\mathrm{min}$ after ignition (Figure 2 (d)), the FN curve was lower than in scenarios without ventilation which showed the positive effect of the activation time of the ventilation system. Although it was still in the unacceptable region.
For scenarios with a $3.5\mathrm{m / s}$ ventilation velocity, jet fans were activated by the detection system when the temperature was above $68^{\circ}C$. The activation time was between 2.67 and 3.17 min for HGV fires and between 6 and 7.17 for bus fires. As the detection time of these scenarios depended on the linear heat detection system, same as ventilation system activation, and this time was the first stage of the evacuation timeline, people started to evacuate later than scenarios with 1 min detection time (Scenario 1-4 - Table 1). Although for 30 MW fire scenarios, the activation time was between 2 and 3 min, the positive effect of higher ventilation velocity, $3.5\mathrm{m / s}$, could make a more tenable situation during evacuation and alleviate the negative effect of late activation of jet fans (Figure 2 (e)).
Table 1: Under Study Ventilation Systems
<table><tr><td>Scenario No.</td><td>Ventilation velocity (m/s)</td><td>No. Fans</td><td>Ventilation activation time after ignition</td></tr><tr><td>1</td><td>0</td><td>-</td><td>-</td></tr><tr><td>2</td><td>3.2</td><td>80%</td><td>4 min</td></tr><tr><td>3</td><td>3.2</td><td>100%</td><td>4 min</td></tr><tr><td>4</td><td>3.2</td><td>80%</td><td>2 min</td></tr><tr><td>5</td><td>3.5</td><td>80%</td><td>Activation by detector at 68°C</td></tr></table>
 a) $V = 0$
 b) Scenario 1 and 2
 c) Scenario 1 and 3
 d) Scenario 1 and 4
 e) Scenario 1 and 5 Figure 2: FN Curve of Different Emergency Ventilation Systems
### b) Sensitivity Analysis
Basic recognition and response times, and time taken to leave the vehicle Sensitivity analysis was carried out for 30 MW, 47 MW, and 158 MW fire scenarios where $80\%$ of jet fans were activated 2 min after ignition with a $3.2\mathrm{m / s}$ velocity. Recognition time, response time, and time to leave the vehicle are determined as premovement times of tunnel users 'evacuation, a time before the evacuation process toward the emergency exits begins. In this model, these pre-movement times have basic values, $t_{rec,base}, t_{res,base}$, and $t_{veh}$ (each type of vehicle). The higher these values, the more likely that the harmful effects of the fire incident reach the users before they start the evacuation. Three modes, basic values of basic pre-movement parameters, half of the basic pre-movement parameters, and double the basic pre-movement parameters, were considered to study the sensitivity of this model to pre-movement times. The expected damage value, EDV, which is calculated via Eq.(2), was calculated for each mode.
$$
E D V = \sum N _ {s i} \times F _ {S i}, \tag {2}
$$
Where $N_{si}$ is the number of fatalities for each fire scenario and $F_{si}$ is the cumulated frequency of each fire scenario.
Table 2 illustrates the variation of EDV for half and double pre-movement parameters in comparison with its value in the standard configuration.
Table 2: The Variation of EDV for Half and Double Pre-Movement Parameters in Comparison with its Value in the Standard Configuration
<table><tr><td></td><td>Half Parameters
Zone 1, Zone 2, Zone 3</td><td>Reference Parameters
Zone 1, Zone 2, Zone 3</td><td>Double Parameters
Zone 1, Zone 2, Zone 3</td></tr><tr><td>trec,ini (min)</td><td>1,1.5,2</td><td>2,3,4</td><td>4,6,8</td></tr><tr><td>tres,ini (min)</td><td>2,1.5,1</td><td>4,3,2</td><td>8,6,4</td></tr><tr><td>tveh (s)</td><td>4 for PC, 8 for van, 30 for bus, and 2 for truck and HGV</td><td>8 for PC, 16 for van, 60 for bus, and 4 for truck and HGV</td><td>16 for PC, 32 for van, 120 for bus, and 8 for truck and HGV</td></tr><tr><td>EDV</td><td>3.54E-01</td><td>5.89E-01</td><td>9.04E-01</td></tr><tr><td>Variation%</td><td>-40.00%</td><td>-</td><td>53.35%</td></tr></table>
By halving these parameters, the EDV decreased by $40\%$. On the other hand, by doubling these parameters, the EDV increased by $53.3\%$ which indicated greater pre-movement time and consequently, a higher number of tunnel users implemented evacuation process later and were in the damage intolerable condition for too long. Borghetti et al. [12] also carried out the same analysis and showed the same variation.
### c) The Accidents Frequency Involving HGVs
To study the influence of incident frequency involving HGV, the frequency of HGV fire scenarios without ventilation decreased by a factor of 10. That leads to lower cumulative frequencies and a lower FN curve compared to the initial FN curve of the same scenarios (without ventilation) (Figure 3). These results were explained when considering that the frequency of occurrence of each scenario depended directly on the value of the incidental frequencies.
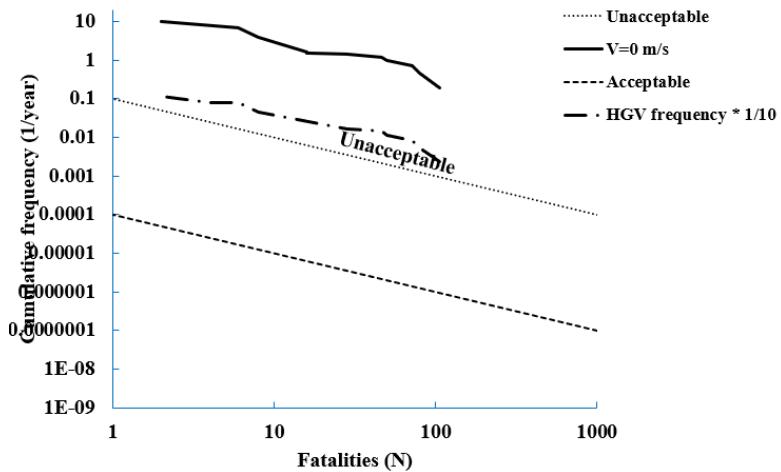 Figure 3: Sensitivity Analysis of the Model to the Influence of Incident Frequency Involving HGV, HGV FN Curves of Scenarios Without Ventilation
### d) Tenability Threshold Temperature
The tenability threshold temperature defines to what temperature exposed tunnel users can resist the extended damage of fire and smoke before considered as being dead. The initial tenability threshold temperature in this model is $80^{\circ}\mathrm{C}$, the tolerable maximum temperature for 15 min exposure during a tunnel fire according to PIARC (1999). To study the sensitivity of results to this temperature, three cases were considered, initial temperature, halved temperature, and double temperature. It is reasonable to expect that increasing the threshold temperature results in a lower EDV or fewer fatalities, and vice versa. Table 3 shows the EDV variation in relation to the standard configuration, halving, and double values. Doubling this temperature made the EDV decrease by about $35\%$ while halving it caused the EDV to increase by $17.8\%$.
Table 3: The EDV Variation in Relation to Tenability Threshold Temperature of the Standard Configuration, Halving, and Double Values
<table><tr><td></td><td>Halved parameter (°C)</td><td>Reference parameter (°C)</td><td>Doubled parameter (°C)</td></tr><tr><td>Tten</td><td>40</td><td>80</td><td>160</td></tr><tr><td>EDV</td><td>5.44E-01</td><td>4.62E-01</td><td>3.00E-01</td></tr><tr><td>Variation%</td><td>17.80%</td><td>-</td><td>-35.04%</td></tr></table>
### e) Different Types of Burning Vehicles on the Evacuation Time
A comparison between the HGV and bus fire scenario located in the middle of the tunnel length and $80\%$ of the tunnel length for three traffic conditions was carried out. In this model, the exposed tunnel users are distributed homogeneously into cells. The time required for each cell evacuation via emergency exits was between 192 and 695 s for the HGV fire and between 590 and 705 s for bus scenarios. Lower evacuation time for HGV scenarios was probably due to more effect of HGV fire scenarios on pre-movement time. The basic recognition time decreased for more severe accidents and consequently, people became aware of the threatening situation within a shorter time. The percentage of dead people and ASET are reported in Table 4 for the various scenarios. Results clearly show that in the case of a bus fire, all people might safely evacuate the tunnel except in one scenario. In the event of HGV fires, most or all people might be at risk.
Table 4: The percentage of Dead People and ASET
<table><tr><td></td><td>Traffic</td><td>Fire Location (%L)</td><td>Ventilation Velocity</td><td>People at Risk (%)</td><td>ASET Range (S)</td></tr><tr><td>Bus</td><td>Free fluid</td><td>0.5</td><td>0</td><td>0%</td><td>616-681</td></tr><tr><td>Bus</td><td>Congested</td><td>0.5</td><td>0</td><td>0%</td><td>603-698</td></tr><tr><td>Bus</td><td>Stoppage</td><td>0.5</td><td>0</td><td>3.15%</td><td>625-705</td></tr><tr><td>Bus</td><td>Free fluid</td><td>0.8</td><td>0</td><td>0%</td><td>638-684</td></tr><tr><td>Bus</td><td>Congested</td><td>0.8</td><td>0</td><td>0%</td><td>600-690</td></tr><tr><td>Bus</td><td>Stoppage</td><td>0.8</td><td>0</td><td>0%</td><td>590-700</td></tr><tr><td>HGV</td><td>Free fluid</td><td>0.5</td><td>0</td><td>100.00%</td><td>633-703</td></tr><tr><td>HGV</td><td>Congested</td><td>0.5</td><td>0</td><td>90.91%</td><td>192-690</td></tr><tr><td>HGV</td><td>Stoppage</td><td>0.5</td><td>0</td><td>72.00%</td><td>599-651</td></tr><tr><td>HGV</td><td>Free fluid</td><td>0.8</td><td>0</td><td>57.00%</td><td>623-693</td></tr><tr><td>HGV</td><td>Congested</td><td>0.8</td><td>0</td><td>45.00%</td><td>600-698</td></tr><tr><td>HGV</td><td>Stoppage</td><td>0.8</td><td>0</td><td>81.54%</td><td>598-692</td></tr></table>
## V. CONCLUSION
Fire is the most important critical event for road tunnel users' safety. Although the UK's road tunnels design manual identifies risk analysis as a practical method for determining the risk level of all road tunnels in the United Kingdom, it must be confessed that there is a need for a comprehensive system-based quantitative risk assessment tool to cover fires in road tunnels.
Risk assessment techniques play a very valuable part in tunnel safety decision-making. Consequently, a model of quantitative risk analysis concerning safety in road tunnels called LBAQRA has been developed to perform a risk analysis as required by UK regulations for complex fire scenarios.
The proposed model performs a quantitative risk assessment to effectively and efficiently evaluate the risks for UK road tunnels and includes quantitative frequency analysis and quantitative consequence analysis. The frequency of each fire scenario has been determined based on the basic fire rate of UK road tunnels per 100 million veh-km. This basic fire rate is updated by taking into account the length, traffic, and gradient of the tunnel under study. Then the effect of time of fire incident, traffic condition, accident type, vehicle type, and the fire source location on the updated fire rate is considered through branches of the frequency event tree.
The quantitative consequence model comprises three parts, the queue formation model that estimates the number of potential tunnel users for each lane of a multi-lane tunnel separately, the distribution model that calculates the evacuation distance in two dimensions, and the egress model that calculates the required egress time.
This paper first presents a brief description of the sections of this model and how it derives the societal risk. In the second part, an illustrative case study was carried out for the Southwick Tunnel to study the robustness of this model, and the risk reduction potential of different ventilation strategies was assessed. A study of various emergency ventilation strategies shows that when the ventilation system is activated very late, it cannot cope with the influences of fire and smoke. For scenarios with a $3.5\mathrm{m / s}$ ventilation velocity when jet fans are activated by the detection system, a higher ventilation velocity can make a more tenable situation during evacuation and alleviates the negative effect of late activation of jet fans, although the activation time is between 2 and $3\mathrm{min}$.
### The Sensitivity Analysis Shows that:
- By halving pre-movement time parameters, the EDV decreases. By doubling these parameters, the EDV increases, which indicated higher pre-movement time and consequently, a higher number of tunnel users who implemented the evacuation process later and were in the intolerable environment for too long and became incapacitated.
- When the frequency of HGV fire scenarios decreases by a factor of 10, that leads to lower cumulative frequencies and a lower FN curve. This indicates that the frequency of occurrence of each scenario depended directly on the value of the incidental frequencies.
- An increase in the threshold temperature results in a lower EDV or fewer fatalities, and vice versa because the threshold temperature is the main tenability criterion that determines intolerability conditions.
- Different types of burning vehicles result in different evacuation times because the basic recognition time decreased for more severe accidents such as HGV fire and consequently, people became aware of the threatening situation within a shorter time.
#### ACKNOWLEDGMENT
We would like to appreciate for UKM's grant GUP-2020-015, and London Bridge Associates Ltd.
Generating HTML Viewer...
References
13 Cites in Article
A Beard,D Cope (2008). Assessment of the safety of tunnels.
Ciro Caliendo,Maria De Guglielmo (2012). Accident Rates in Road Tunnels and Social Cost Evaluation.
Ciro Caliendo,Paolo Ciambelli,Maria De Guglielmo,Maria Meo,Paola Russo (2012). Numerical simulation of different HGV fire scenarios in curved bi-directional road tunnels and safety evaluation.
R Haddad,C Maluk,E Reda,Z Harun (2019). Critical velocity and backlayering conditions in rail tunnel fires: State-of-the-art review.
(2004). European Parliament and the Council of the European Union.
Eva Jančaříková,Peter Danišovič,Juraj Šrámek (2008). Increase of road tunnels safety using Tunnel Traffic & Operation Simulator.
D Diamantidis (2005). Risk analysis versus risk acceptability in major European tunnel projects.
K Botschek,B Kohl,R Hörhan (2007). Austrian Risk Analysis for Road Tunnels-Development of a New Method for the Risk Assessment of Road Tunnels.
B Kohl,M Zibert (2010). Risk analysis study for Slovenian motorway tunnels.
Michael Hadjimichael (2009). A fuzzy expert system for aviation risk assessment.
Mauro Roisenberg,Cíntia Schoeninger,Reneu Da Silva (2009). A hybrid fuzzy-probabilistic system for risk analysis in petroleum exploration prospects.
M Moonis,A Wilday,M Wardman (2008). Semi-quantitative risk assessment of commercial scale supply chain of hydrogen fuel and implications for industry and society.
No ethics committee approval was required for this article type.
Data Availability
Not applicable for this article.
How to Cite This Article
Razieh Khaksari Haddad. 2026. \u201cDesign and Implementation of a Quantitative Risk Assessment Model for UK Road Tunnels\u201d. Global Journal of Science Frontier Research - I: Interdisciplinary GJSFR-I Volume 23 (GJSFR Volume 23 Issue I1).
Explore published articles in an immersive Augmented Reality environment. Our platform converts research papers into interactive 3D books, allowing readers to view and interact with content using AR and VR compatible devices.
Your published article is automatically converted into a realistic 3D book. Flip through pages and read research papers in a more engaging and interactive format.
Our website is actively being updated, and changes may occur frequently. Please clear your browser cache if needed. For feedback or error reporting, please email [email protected]
Thank you for connecting with us. We will respond to you shortly.