We compare frequencies of volcanic eruptions (VEs) in the past 270 years with variations of solar activity and summary curve of eigen vectors (EVs) of the solar background magnetic field (SBMF) from the WSO synoptic magnetic maps. In the period 1868 -1950 and 1990-2020 the total numbers of volcanic eruptions are maximal during the maxima or the descending phase of the magnetic field cycles with the dominant southern polarity, and minimal during the maxima or ascending phase of the magnetic field cycles with the northern polarity. While in the earlier years (1762-1868) this link disappeared. The frequency analysis of VEs with Morlet wavelet reveals the dominant period of about 22 years and weaker periods of 10.7 and 55-70 years. Comparison of VE frequencies with the modulus summary curve (MSC) of EVs of SBMF for solar cycles after 1868 reveals a strong positive correlation (coefficient of 0.84) with the maxima of VEs occurring when the summary curve of EVs derived from the solar magnetic fields have the southern polarity, or more active southern hemisphere of the Sun, and minima when the northern one.
## I. INTRODUCTION
Volcanos occur when the inner energy of Earth under its surface approaches a certain critical level, so that the hot magma, which is under a huge inner pressure, can squirt from the Earth's interior through a weak region of the crust producing volcanoes. Geomagnetic storms induced by interplanetary coronal mass ejections, interplanetary magnetic fields and solar wind particles \[see, for example, [1] and references therein\] can cause either sporadic electric currents in the earth locations along the breaks of the surface, which can heat up the surface and reduce their resistivity to the shifts [2], or induce the currents leading to piezoelectric tension of the breaks on the surface leading to volcanoes [3].
The Volcanic Explosivity Index (VEI) [4] was introduced for evaluation of the eruption effects on the terrestrial atmosphere based on the estimation of the volume of volcanic eruption materials (ejected tephra, ashflows, pyroclastic flows etc), the height of the ash column, duration of eruption. The eruptions with the $\mathrm{VEI} = 6$ and higher can cause the effect of a volcanic winter [5] - a noticeable cooling of the atmosphere caused by the ash pollution that can, in turn, cause anti-greenhouse effect shielding the solar radiation leading to global cooling.
Also the long-term cooling effect of major VEs can be assisted by variations of ozone abundances affected by stratospheric sulphuric aerosols appearing after volcanic eruptions [6, 7]. Ash-rich particles are found to dominate the volcanic cloud optical properties for 2-3 months, while the lifetime of sulphuric aerosols is determined their uptake on ash, rather than by reaction with radicals [8]. Therefore, volcanic activity can be an important component of the solar-terrestrial interaction.
The early papers tried to link the terrestrial volcanic occurrences with solar activity [9- 16]. Later by applying the wavelet analysis to the historical records of large volcanic eruptions other authors managed to establish a connection between the global volcanicity and solar activity cycle of 11 years [17, 18]. Other papers either confirmed [19] or denied [20] the existence of 11 year cycles in a frequency of volcanic eruptions, while some studies showed close relationships between earthquakes, volcanic eruptions and solar activity proxies in the Earth atmosphere [7, 21, 22].
There was a clear correlation detected between the occurrences of large earthquakes at any terrestrial location and high-speed solar wind streams active during solar minima [22-24] and high energy protons, whose densities are known increasing during the maxima of solar activity defined by averaged sunspot numbers [25, 26]. This suggests that geomagnetic storms occurring in the terrestrial atmosphere during maximum years of solar activity can affect the properties of the faults and gestate in some regions with large earthquakes and associated volcanic eruptions [2, 3, 7, 21, 27].
A number of authors discussed existing relationships between proxies for solar activity and climate, including variations in ozone, temperatures, winds, clouds, precipitation, and modes of variability such as the monsoons and the North Atlantic Oscillation (NAO) \[see, for example, [6, 7] and references therein\]. The volcanic aerosols serve as sources for heterogeneous chemical reactions destroying stratospheric ozone, that can lower absorption of the solar UV radiations and reduces the radiative heating in the lower stratosphere [6]. Most of the authors still support the idea that volcanic activity is increased during minima of solar activity [15, 17, 20], although without providing the confidence levels of their analysis.
The increase of frequency of strong volcanic eruptions during the minima of solar activity was suggested to be associated with the variations of circulation of atmospheric masses in the terrestrial atmosphere induced by the solar input linked to a solar cycle [7]. The further link of volcanic eruptions with solar activity can involve some induced changes in the basic state of the atmosphere caused by the effects energetic particles from solar flares, which can change atmospheric circulation patterns. This was suggested to alter the Earth's spin that, in turn, can lead to moderate earthquakes and volcanoes relieving the tension of the volcanic magma [17]. This mechanism could reduce a probability of powerful volcanic eruptions while increase the number of moderate eruptions [17].
Anderson [28] suggested an alternative model, in which the presence of sufficient quantities of volcanic aerosols can change the circulation of the terrestrial atmosphere to such the extent that it would change the velocity of the Earth rotation that, in turn, leading to an increase of earthquakes and eruption of powerful volcanoes. At the same time, Bumba [29] demonstrated possible links of longitudinal distribution of solar magnetic fields with geomagnetic disturbances.
Hence, despite definite inks are not clear yet between volcanic eruptions and solar activity, these eruptions can have essential consequences for terrestrial environment by the emergence of volcanic lava and ashes, which can affect terrestrial atmosphere, its energy exchanges, air quality and living conditions in neighbouring cities [5, 6, 17]. Thus, effects of volcanic eruptions, if their frequencies are noticeable, should be included in one or another ways into any models of the global climate changes [30].
Although, there was a recent development of finding a new proxy of solar activity, the eigen vectors of the solar background magnetic field (SBMF) derived with the principle component analysis (PCA) from the synoptic magnetic maps captured by the full-disk magnetograph of the Wilcox Solar Observatory, US [31, 32]. The modulus of the summary curve of the two principal components of SBMF fits rather closely the averaged sunspot numbers currently used as the solar activity index [31-33]. The advantage of the new proxy, the summary curve of PCs, is that it not only provides the amplitudes and shapes of solar activity cycles but also captures the leading magnetic polarities in these cycles and links not only to the sunspot index but also to various solar flare indices [33].
The solar activity was shown to be defined by the solar dynamo action in the two layers of the solar interior producing two magnetic waves having close but not equal periods of about 11 years. The interference of these two magnetic waves leads to a grand period of about 350-400 years for their amplitude oscillations when the normal magnetic wave (and cycle) amplitudes approach grand solar minima (GSM) caused by the wave's beating effect [32]. Such grand periods coincide with well-known GSMs as Maunder minimum (MM), Wolf and Oort and other grand minima [34]. In fact, the Sun was shown to enter in 2020 the period of a modern GSM lasting until 2053 [32, 35].
Recently, Velasco Herrera et al. [36] using the Bayesian algorithm applied to the averaged sunspot numbers obtained the similar results reporting the modern Grand Solar Minimum to occur in cycles 25-27, similar to that reported by Zharkova et al. [32]. Furthermore, these prediction results about the modern GSM in cycles 25-27 were confirmed by some other researchers [37, 38], who used the same WSO synoptic magnetic field data and obtaining the spectra of the zonal harmonics of the SBMF approaching the GSM, which were interpreted with 3D solar dynamo models.
During the most recent GSM, MM, there was a reduction for solar radiation [39] and the terrestrial temperature by about 1C [40], which, in turn, was proxied by the absence of sunspots and active regions on the solar surface during the MM [34]. Although, the terrestrial temperature was found increasing since Maunder minimum by 0.5C per century [41, 42], which was first assigned to the increase of solar activity producing a modern warming period [43]. However, from cycle 21 the solar activity became systematically decreasing that coincided with a decrease of the solar background magnetic field in the approach of the GSM [31, 32]. And indeed, from cycle 21 the solar activity became systematically decreasing that coincided with a decrease of the solar background magnetic field in the approach of the grand solar minimum (GSM) [32, 33].
On the other hand, in the past few hundred years the Sun was shown to provide some additional radiation to the Earth by moving closer towards the Earth orbit because of the solar inertial motion (SIM) caused by the gravitation of large planets [44, 45]. These periodic variations of the Sun-Earth distance, and the solar irradiance, occur every 2100-2200 years, called Hallstatt's cycles, which were independently derived from the isotope abundances in the terrestrial biomass [46, 47]. In the current Hallstatt's millennial cycle, the Sun-Earth distances are decreasing from the MM until 2600 that leads to the increase of solar irradiance deposited to the atmosphere of the Earth (and other planets) [45]. This SIM effect is likely to contribute to the terrestrial atmosphere heating, in addition to any heating caused by the greenhouse gasses considered in the terrestrial models that requires further investigation.
However, the most essential effect of SBMF in the next few decades will come from a reduction of solar activity, or the modern grand solar minimum, which started in 2020 and will last until 2053 [32]. Geomagnetic storms can be associated with volcanic eruptions [2, 3, 7, 21] either by causing sporadic electric currents [2], or by inducing the currents leading to piezoelectric tension of the breaks on the surface [7]. The scope of the current paper is to establish more definite links between the frequency of volcanic activity and the variations of solar activity using both the sunspot numbers [48] and the new proxy of solar activity linked to eigen vectors of the solar background magnetic field [32, 33].
## II. ANNUAL FREQUENCY OF VOLCANIC ERUPTIONS
The information about the volcanic eruptions was derived from the Smithsonian Institution's GVP database [49], including the volcanoes that are known or suspected to have erupted within the Holocene or Pleistocene. The GVP website provides access to the raw data and a history of volcanic eruptions. The main list of Holocene volcanoes contains 1408 volcanoes associated with 9928 eruptions (version 4.10.0 dated May 14, 2021) [49]. The dates of volcanic eruptions are determined by different methods and with varying precision. There are 2 criteria, which a volcanic eruption must satisfy, in order to be included into this research: it must be accurately dated, and it must be historically confirmed.
Fig. 1 shows the annual frequency of volcanic eruptions, $N_{yr}$, (violet line) that were recorded from 1700 to 2020 (4961 in total, of which 3822 with $\mathrm{VEI} \geq 2$ ), which are used for investigation of volcanic eruptions numbers links with a solar cycle in section 3.1 and the wavelet spectral analysis in section 3.2. In order to eliminate random variations of the annual volcanic eruption frequencies, $N_{yr}$, the data was smoothed with the running averaging filter over an 11 year window and plotted as the averaged (black) curve in Fig. 1. This is the frequency of volcanic eruptions (VEs), which is used in the future statistical analysis in section 3.5.
Also in Fig. 1 we built the envelope curve (red line) along the maximal magnitudes of the averaged curve of volcanic eruption occurrences (black curve). In order to build this curve, we needed to do some interpolation of the data in the gaps when no data was available. In the last century, the frequency of observed volcanic eruptions,$N_{yr}$, is higher, and in the twentieth century(1900-1999), 2944 eruptions were observed(of which 1940 with $\mathrm{VEI} \geq 2$ ). However, the fixation of a larger number of the eruptions in recent years is most likely due to changes in the method of registering the eruptions. Completeness of the dates of volcanic eruptions for$\mathrm{VEI} \geq 5$begins since 1800, for$\mathrm{VEI} \geq 4$- since 1900 and for$\mathrm{VEI} \geq 3$- since 1960.
Hence, for building this red curve only in Fig. 1, the interpolation by the cubic spline was carried out for the intermediate magnitudes of the VE averaged frequencies marked by the black curve to produce the red line, during the times when volcanic data were missing, by assuming that in the past three centuries the maximal numbers of volcanic eruptions were similar to that in the past few decades. In this operation we assumed that the data gaps in volcanic eruptions of different strength are a random process that is reasonable assumption for the timescale of 200 years applied, and the trends in the early data have been eliminated by a cubic spline. For all other research in this paper the real counts of VEs are used.
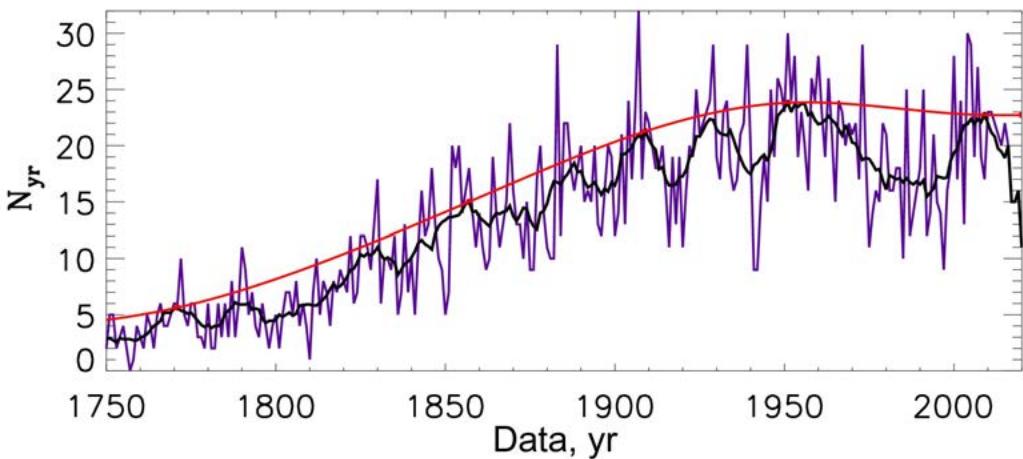
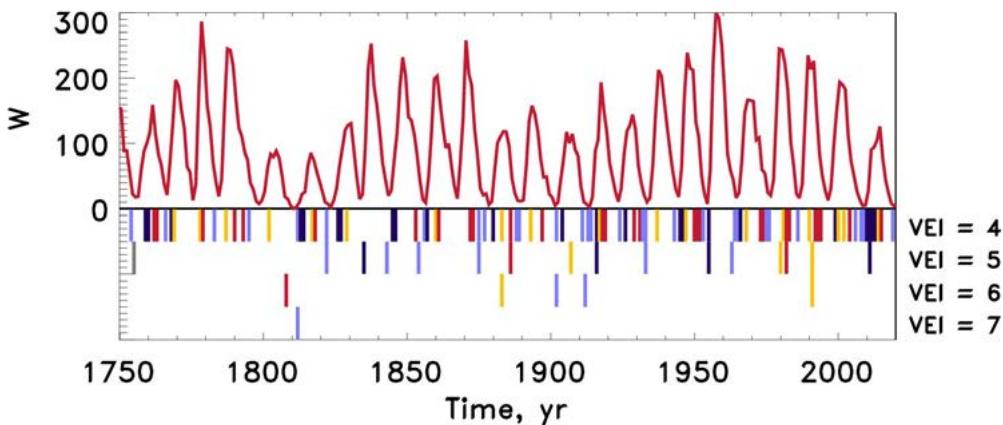 Fig. 1: Total numbers, $N_{yr}$, of the annual volcanic eruptions in the period of 1750-2020 (violet line). The annual numbers of volcanic eruptions (VEs) averaged with a running filter of 11 years (black line) over-plotted with the envelope curve (red line) marking the maximal magnitudes in the black curve (see text in section 2 for details).
## III. DATA ANALYSIS
### 3.1 Eruptions frequencies versus averaged sunspot numbers
Solar activity is currently defined by the average number of sunspots and groups on a solar disk at a given day or month. [48]. There is a well-known 11-year cycle of solar activity [48], or a 22-year cycle, during which a complete reversal of the magnetic polarity of the sunspots occurs. The annual numbers of sunspots were taken from the Solar Influences Data Analysis Center (SIDC) at the Royal Observatory of Belgium $^{1}$.
The 25 cycles of solar activity occurred during the period of 270 years from 1750 until 2020 are shown in Fig. 2, top plot. The averaged sunspot numbers are plotted versus the available frequencies of the eruption of volcanoes of different significance. It is seems that the very strong volcanic eruptions (VEI $\geq 5$ ) occur during the minima of solar activity defined by the sunspot index. The further analysis of these links is presented in section 3.4 below.
#### 3.2 Periods of volcanic activity from the wavelet analysis
If the volcanic activity has a periodicity and the dominant one is about 11 years then this would be a good verification of the connection between solar and volcanic activity. This point was investigated following the fruitful results for other active terrestrial features [18] by applying a wavelet spectral analysis with Morlet mother wavelet to the frequencies of volcanic eruptions (VEs) plotted by the black curve in Fig. 1 discussed in section 2, and the result is plotted Fig.
3.
Wavelet transform of signals is the spectral analysis method providing a two-dimensional scan of the analysed signal (time and frequency, or period), in which the coordinates of the time and frequency are independent variables. This representation allows one to explore the properties of the signal simultaneously in time and frequency domains. This makes the wavelet analysis as an excellent tool for examining the series with time-varying frequency characteristics. By considering the time series in the frequency-time space it is possible to derive dominant periods and their variations in time. The mother wavelet was selected as the Morlet wavelet (the real part of it is damped function of cosine), because with this choice one can obtain a high frequency resolution, which is important for our task.
The power of the wavelet spectrum is shown in Fig. 3 by a colour bar plotted next to the wavelet spectrum. The cone of influence (COI) marked by the black dashed line, defines the parts of the spectrum with the essential border effects in the starting and finishing parts of the time series, because of a limited statistical data (border effects). Consequently, the results outside the COI are excluded from the further investigation, in particularly, in the calculations of the global wavelet spectrum. In order to verify the spectral features derived from the wavelet analysis, Fourier spectrum of the VE frequencies is also calculated and presented by the indigo line in Fig.
3.
The wavelet spectrum of the temporal series of volcanic eruptions (VEs) in 1750-2020 years reveals the two powerful peaks: one occurring at $21.4 \pm 1.4$ years (corresponding to a double 11 year cycle) and the second one occurring at $55.6 \pm 10.5$ years (its nature is unknown yet); although the latter is loosely close to the one of 80 years reported by Stothers [17]. At the same time, the peak near the period of $10.7 \pm 0.9$ (close to the duration of a single solar activity cycle) previously reported by some researchers \[see for example, [17] and references therein\] is much less pronounced than the one of 22 years. This double cycle feature indicates the importance of some factors associated with 22 year cycles.
This motivates us to investigate further the link of volcanic eruptions with the solar activity and to use the proxy of solar activity where such the double period naturally occurs. Namely, we need to compare the variations of VE frequencies with the variations of the two eigen vectors (EVs) of SBMF linked to magnetic polarities for each solar cycle, thus, accounting for a double solar cycle of about 22 years. The basics of how these eigen vectors were obtained and what they represent [32] are reiterated below.
#### 3.3 Solar background magnetic field as a new solar activity proxy
Recently [32, 33, 50], the Principle Component Analysis was applied to the low-resolution full disk solar background magnetic field (associated with the poloidal magnetic field) measured by the Wilcox Solar Observatory from the synoptic full disk magnetic maps.
We use the temporal variations of the initial vector $\vec{X}$ of latitudinal magnetic waves, $\vec{X}$, obtained from the full disk synoptic magnetic maps with 30 strips in latitude averaged over 360 points in longitudes. By calculating the covariance matrix $C = \text{var} \vec{X}$, one can find the eigen values $\lambda_{i}$ of this vector $\vec{X}$ by equating the determinant to zero, e.g. $\det(C - \lambda I) = 0$, where $I$ is the unity matrix. For each eigen value $\lambda_{i}$ one can calculate the corresponding components $Y_{i}$ of eigen vectors $\vec{Y} = A \vec{X}$ where $A$ is the matrix of regression coefficients. One can find that $\text{var}(\vec{Y}_{i}) = \lambda_{i}$. The covariance matrix can be also written as $C = A D A^{T}$, where $A^{T}$ is the transported matrix $A$ and $D$ is the diagonal matrix of the derived eigen values. In this definition the components $\vec{Y}_{i}$ of the new vectors $\vec{Y}$ can be assigned to a separate process supported by the variance derived for this component. The components $\vec{Y}_{i}$ with the largest variance are called principal components (PCs).
The sets of eigen values $\lambda_{i}$ and eigen vectors $Y_{i}$ were derived from the observed magnetic synoptic maps and sorted by the variance of the data contributing to each eigen vector, revealing that the eigen values and corresponding eigen vectors come in pairs: first two eigen values covering for $39\%$ of the observed magnetic data variance, the next two - $18\%$ and for the all four pairs covering for about $95\%$ of the magnetic data variance [33]. The first pair of two largest eigen values with the maximum variances of the data corresponding to the two largest eigenvectors, EVs, were considered to be the Principal Components (PCs).
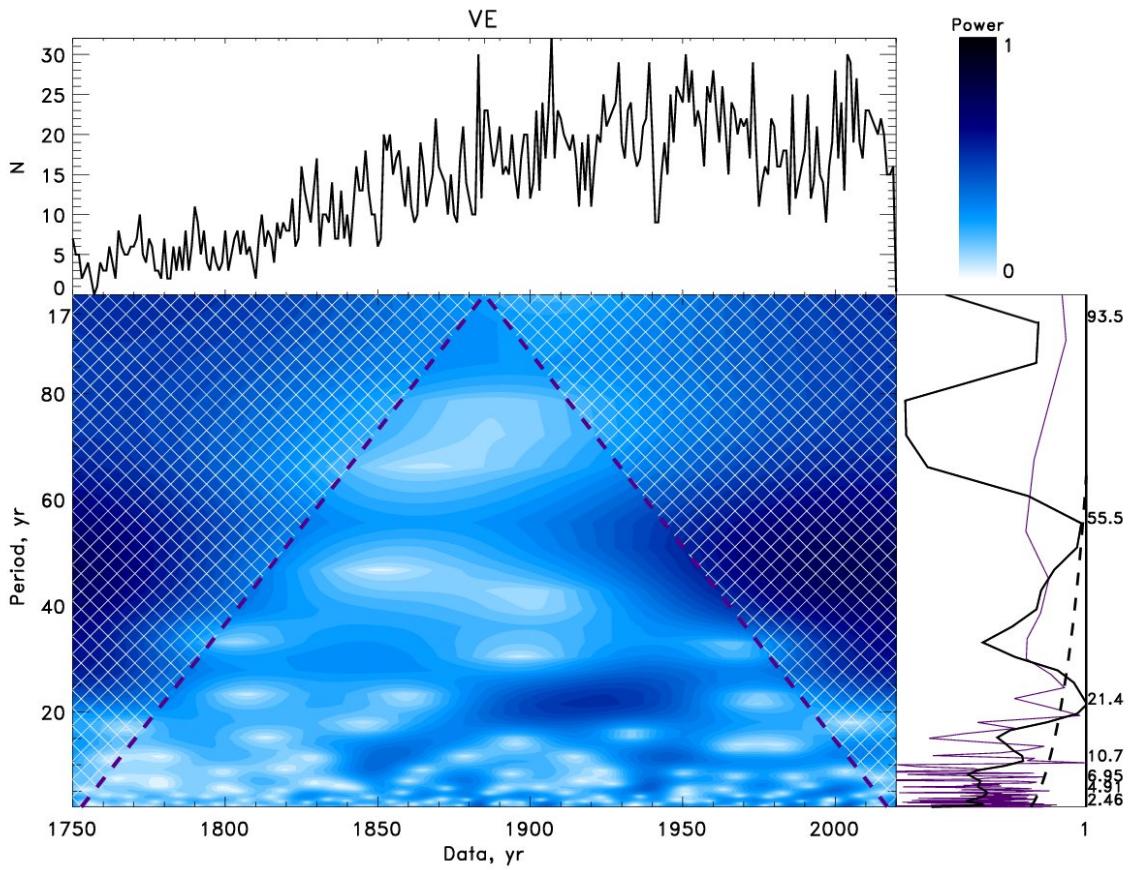 Fig. 3: Top plots: Time series of the annual volcanic eruptions in the period of 1750-2020 (top left) with the power bar for the wavelet spectrum (top right). Bottom plots: The wavelet spectrum with periods (Y-axis) derived from frequencies of volcanic eruptions (bottom left) obtained using the Morlet wavelet. The Cone of Influence (COI) marked by the black dashed line. The global wavelet spectrum (the solid black line) and Fourier spectrum (the indigo line) (bottom right). The black dashed line presents $95\%$ confidence interval for the global wavelet spectrum (see the text in section 3.2 for details).
These two eigen vectors (EVs) were added into a summary curve and suggested as a new, additional proxy of solar activity [32]. These PCs are considered to represent the two dynamo waves in the solar background (poloidal) magnetic field generated by the dynamo mechanism from the dipole magnetic sources [32]. The PCs were described analytically by a series of a few cosine functions by applying the symbolic regression analysis based on the Hamiltonian principle [51] and deriving the mathematical formulae describing the amplitude and phase variations of the resulting waves [31, 32]. The polarity of the summary curve changes periodically from cycle to cycle being either southern or northern one that indicates which hemisphere of the Sun is more active. The similar indication of the increased activity in a given hemisphere is often reported for each cycle in sunspots [52, 53].
This summary curve of these two PCs derived for cycles 21-23 and predicted for cycle 24-26 [31, 32] is plotted in Fig. 4 (top plot) also showing the variations of the dominant solar background magnetic field: northern for positive and southern for negative amplitudes. The prediction of the summary curve to cycles 25 and 26 presented in Fig. 4 (top plot) taken from Fig. 2, bottom plot in Zharkova et al. [32]) shows a noticeable decrease of the predicted average sunspot numbers in cycle 25 to $\approx 80\%$ of that in cycle 24 and in cycle 26 to $\approx 40\%$ that is linked to a reduction of the amplitudes of solar cycles and an increase of phases between the two eigen vectors of SBMF derived with PCA leading to grand solar minima (GSMs) [32, 50]. The formula for the summary curve, which has a 22 year cycle when the same polarity returns, allows us to do its prediction by thousand years backward and forward presented in Fig.3 [32]. This prediction revealed the occurrence of grand solar cycles of 330-380 years, separated by Grand Solar Minima (GSMs), whose timing reproducing reasonably well the well-known grand minima: Maunder, Wolf, Oort, Homeric and many other ones.
This summary curve was proposed by Zharkova et al. [32] as a new (additional) solar activity proxy since the module of the summary curve fits rather closely the averaged sunspot numbers currently used as a solar activity index (Fig. 4, bottom plot). A close resemblance was found between the modulus summary curve and the curves describing the averaged smoothed sunspot numbers in cycles 21-23 [32] and 21-24 [33] shown here with some small exception for the descending phase of cycle 23, which was later explained by the strongly inflated sunspot numbers used at Locarno observatory [54]. After their correction, the averaged sunspot numbers in cycle 23 fit rather closely the modulus summary curve presented in Fig. 4, bottom plot. Recently, the two PCs, and other eigen vectors of SBMF, were derived from the SBMF data for cycles 21-24 confirming the previous eigen vectors derived from cycle 21-23 [33]. Moreover, the authors demonstrated the links of the summary curve of these PCs to the averaged sunspot numbers for the whole period of sunspot observations from 1700 to 2020 [55] and also shown that other three pairs of eigen vectors are linked to the indices of a flare activity in soft X-ray and radio emission recorded for cycles 21-24 [33].
Hence, from the one hand, this modulus summary curve is found to be a good proxy of the traditional solar activity contained in the averaged sunspot numbers as recently confirmed by [55, 56]. On the other hand, this summary curve is a derivative from the principal components of SBMF with clear mathematical functionalities representing at the same time the real physical processes - poloidal field dynamo waves - generated by the solar dynamo [32]. These points motivated the authors [32] to suggest the summary curve of the two PCs as a new, or additional, proxy of solar activity representing poloidal magnetic field of the Sun, in addition to the sunspot index supposedly linked to the toroidal magnetic field [55].
The suggestion for usage for evaluation of the solar activity of the solar background magnetic field obtained from the same WSO magnetic synoptic maps reported earlier [31, 32] has been recently utilised for the prediction of solar activity in cycle 25, which is expected to have smaller activity compared to cycle 24 [37, 38]. This is in line with our prediction of the modern grand solar minimum (2020-2053) [32, 35]. Some other predictions of cycle 25 based on the analysis of the existing sunspot index in the past 370 years using Artificial Intelligence methods also confirmed the conclusions of lower activity in cycle 25-27 [36, 57].
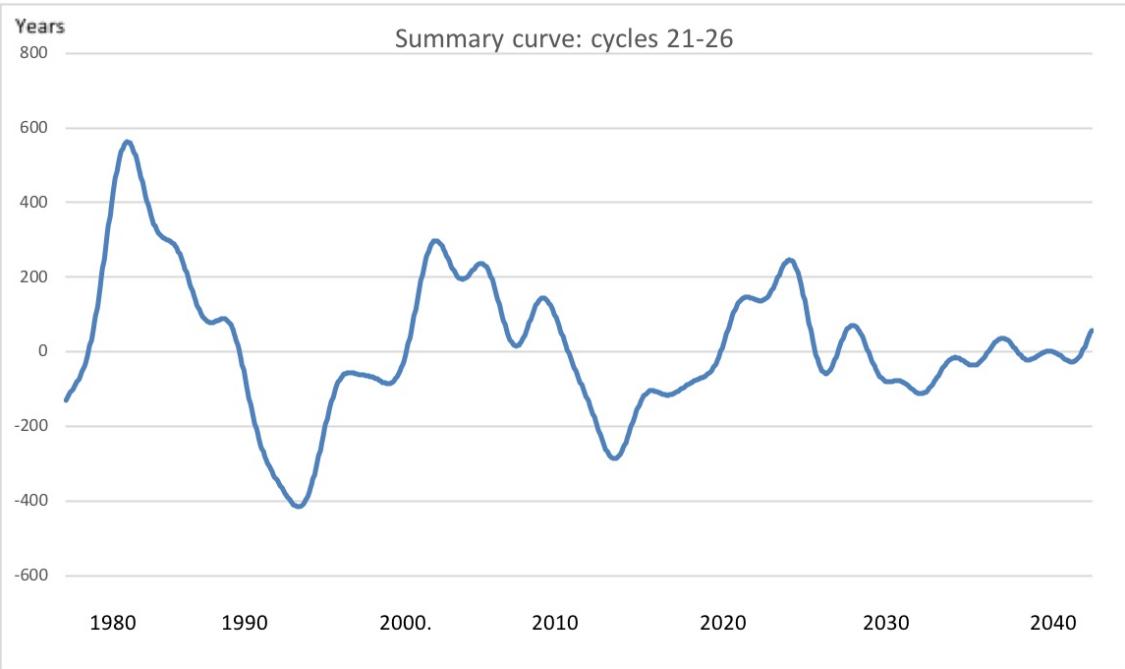 Fig. 2: The averaged sunspot numbers (red curve) describing solar activity in 1750-2020 (top) versus the annual frequencies for volcanic eruptions of different significance (from lower (top line) to higher (bottom line) marked by colour bars. Colours of the bars below the redd curve define the phases of solar activity cycles when eruptions occurred: blue - ascending, yellow - maxima, red - descending and light blue - minima.
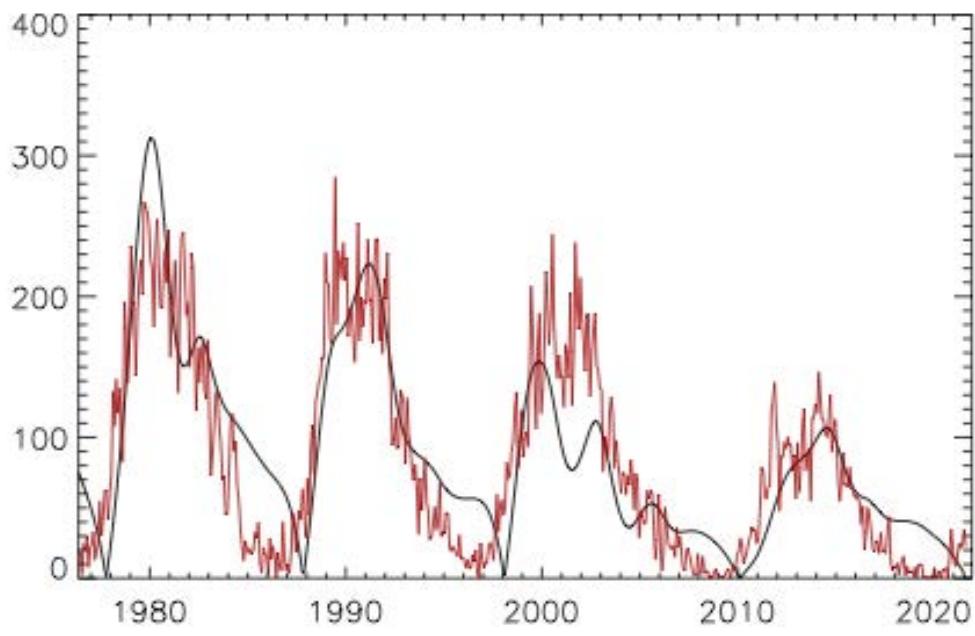 Fig. 4: Top plot: The summary curve in arbitrary units, of EVs, or PCs, for cycles 21-26 derived from the data for cycles 21-23 and extrapolated for cycles 24, 25 and 26 (a courtesy of [32]). Bottom plot: Modulus summary curve, in arbitrary units, derived from the summary curve above for cycles 21-24 overplotted on the averaged sunspot numbers used as the current solar activity index (a courtesy of [33]) confirming the summary curve of EVs as an additional proxy of solar activity for cycles 21-24.
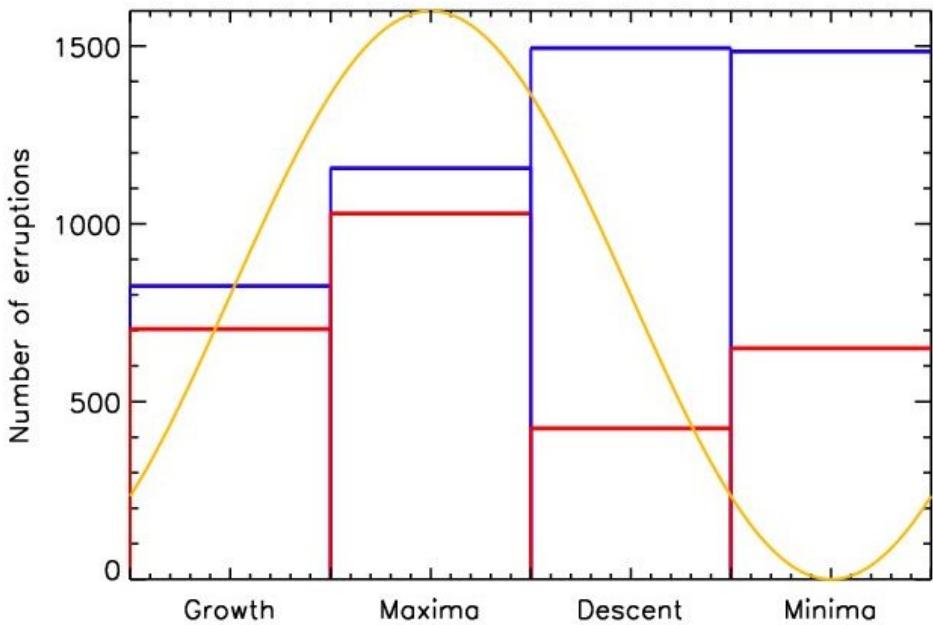
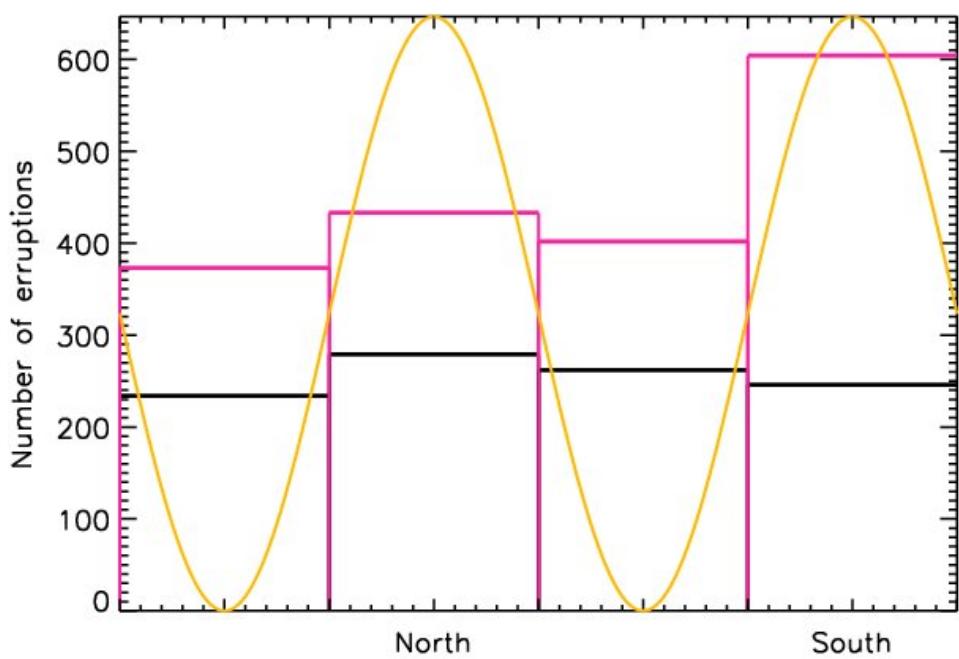 Fig. 5: Top plot: Volcanic eruption (VE) numbers added for the time intervals of four quartiles (see Table 1 and the text for details) of a symbolic 11-year solar cycle (cosine function, yellow line) for the intervals from 1750 until 2020 for the cycles defined by sunspots (blue line) and by eigen vectors, EVs (the red line). The total number of volcanic eruptions is $\approx 4960$. Bottom plot - Volcanic eruption (VE) numbers counted for the times of quartiles (see the text for details) of a symbolic 22 year solar cycle (yellow line) emulating the summary curve of eigen vectors (EVs) of SBMF (see Fig. 4, top plot) for the two periods: 1750-1868, 1000 VEs (black line) and 1868-1950, 1800 VEs (magenta line). The total numbers of VEs is $\approx 2800$. The leading magnetic polarities (northern and southern) of the summary curve, or the most active solar hemisphere [52, 53], are indicated below X-axis in the positions of 11 year cycle maxima.
#### 3.4 Volcanic eruptions versus solar activity phases
In order to compare volcanic frequencies at different phases of solar cycles, let us define the quartiles of a single 11 year cycle associated with sunspot index and for double 22 year cycle associated with the eigen vectors of SBMF. For each solar cycle of 11 years having a quasi-normal distribution, the maximal and minimal numbers of sunspots are calculated, and the temporal interval between them was divided by 8 to obtain smaller intervals, so that each cycle with two minima and one maximum has 16 points. Then for the ascending (growth) and descending (descent) phases we use 4 intervals counted from the minimum but before maximum, within which a number of VEs are added. For the maximal phase we use four intervals (two from the each side from the maximum) and for the minimal phase we use the four intervals (two from the each minima occurred before and after this cycle). Therefore, each quartile covers approximately even time intervals for different phases of the cycles. The total number of volcanic eruptions was 4960 occurring over the whole time interval from 1750 until 2020.
For the eigen vector cycles of 22 years the rectangles along the time on axis X show the intervals of maxima and minima of double cycles (separating the maxima and minima by the two plus two intervals of the ascending, or descending phases of a 11 year cycle) so that the two lower points go to minimal interval and the two higher points go to the maximal interval. We also indicate for a 22 cycle the leading magnetic polarities in a given 11 year cycle (northern with a positive sign and southern with a negative one). For this case we considered only about 2800 volcanic eruptions occurred in 1750-1950 when their numbers were not potentially affected by the open air nuclear weapon testing $^{2}$. For a comparison with EVs we also divided the total number of VEs into the two periods: 1750-1868 (1000 volcanic events, in total) and 1868-1950 (1800 VEs, in total) following the differences in their occurrences during these intervals (see section 3.5 for more details) caused by either the Earth North pole movement or by weaker solar activity, in general.
The distributions of total numbers of volcanic eruptions in the four quartiles of an 11-year solar cycle (yellow line) shown by the rectangles on the axis X: growth, maximum, descent and minimum are presented in Fig. 5 (top plot) for the whole volcanic dataset (4890 eruptions defined by the violet curve in Fig. 1 defined either by sunspots (blue line, see also Table 1) or by modulus summary curve of EVs (red line). The distributions of the VE subset recorded in 1750-1950 excluding the VEs which are likely to be affected by the open nuclear weapon testing $^{3}$ (2800 eruptions, in total, taken from the data plotted by the violet curve in Fig. 1) is shown in Fig. 5 (bottom plot). The symbolic cycle of 11 years is represented by yellow cosine function (with the Y-axis on the right) showing maximal magnitude of unity) and minimal magnitude of 0 (zero).
If 11-year solar cycles are defined by sunspots, then the largest numbers of volcanic eruptions are found to occur during the descending and minimal phases of the solar activity that agrees with the previous findings [17, 20, 27]. However, if the 11-year solar cycle is defined by the modulus summary curve (MSC) of the eigen vectors (EVs) of SBMF defining the solar activity via the complementary poloidal magnetic field [32], then the total numbers of volcanic eruptions (VEs) in the quartiles of the MSC cycles shown by the red lines in Fig. 4, top plot, are maximal during the maxima of MSC and minimal during its minima. These differences in the distributions of the numbers of VEs over the sunspot and MSC solar activity curves (blue and red rectangles, respectively) can indicate either some critical differences in the solar cycles definitions derived from sunspots and from the SBMF, occurring either permanently or during particular periods when the sunspot data availability was not very good, or point out to the real physical differences in solar activity proxies defined from toroidal (sunspots) and poloidal (background) magnetic fields [55].
Furthermore, we can consider a symbolic double cycle of solar activity of 22 years (see Fig. 5, bottom plot) comprising two 11 cycles with the opposite polarities e.g. the MSC for cycles 21 and 22 in Fig. 4, bottom plot, where cycle 21 has EVs of the northern polarity and cycle 22 has EVs of the southern polarity. as shown in Fig. 4, top plot. The magnitudes of these symbolic 11 year cycles marked by yellow lines are shown in the right Y-axis of Fig. 5 varying from 1 (maximum) to 0 (minimum). Then the total numbers of VEs in each quartile versus double cycle of EVs are shown here (see Fig.5, bottom plot) for the selected maximal and minimal quartiles during the intervals of 1750-1868 (black curve), where the numbers of VEs are nearly constant and of 1868-1950 when the maximal numbers of VEs occurs during the maxima of 11 year cycles with southern polarity and the minima of VE numbers - during the maxima of 11 year cycles of with northern polarity of the summary curve indicating a dominant activity in the southern hemisphere of the Sun.
Indeed, in the case of 22-years, or double cycles, there is a clear indication that for the period of 1868-1950 the VE frequencies (indigo lines in Fig.5, bottom plot) are maximal during the magnetic cycle maximum in the 11-year cycles having the EVs with southern magnetic polarity (the second 11-year cycle in Fig.5) compared to the minima occurring during the maximum of magnetic 11 year-cycle with northern polarity. This finding showing the maximal frequencies of volcanic eruptions occurring during the maxima of solar magnetic field activity is closer to the other studies of volcanic and earthquake occurrences in the recent century linking the increase of a geomagnetic activity during the periods of dominant activity in the southern solar hemisphere, e.g. dominant southern polarity of the interplanetary magnetic field [23-26].
While for the earlier period of 1750-1868, the number of volcanic eruptions there is some very small or insignificant increases of VE numbers (black line) during the maxima of magnetic cycles with either northern or southern polarity. These differences between the VE numbers to be nearly constant during a solar 11 years cycle for the early years of the 17-18 centuries while revealing the maximal VE numbers during the maxima of solar 11 year activity with southern polarity in the later years (from the second half of the 19 century) can point out to some natural terrestrial phenomena (e.g. a north pole migration) causing these steady VE numbers during the early years as discussed in section 4.1 below. However, the fact that the distributions of VE numbers in the quartiles are nearly constant for all quartiles for the definition of solar activity by the eigen vectors of SBMF while reveal maximal magnitudes during the descending and minimal phases of the solar activity defined by sunspots allows us to conclude that there are some discrepancies in the solar cycle definitions related either to the objective lack of observations or their dating in the early years before the second half of the 19 century [55].
Table 1: The total number of volcanic eruptions N occurred for a given phase of a solar cycle and% from the total number of eruptions in the cycle derived for several VEI in the period of 1750-2020.
<table><tr><td rowspan="2">VEI</td><td colspan="2">Growth</td><td colspan="2">Max</td><td colspan="2">Descent</td><td colspan="2">Min</td><td>All</td></tr><tr><td>N</td><td>%</td><td>N</td><td>%</td><td>N</td><td>%</td><td>N</td><td>%</td><td>N</td></tr><tr><td>1</td><td>171</td><td>15.0</td><td>269</td><td>23.6</td><td>324</td><td>28.4</td><td>375</td><td>32.9</td><td>1139</td></tr><tr><td>2</td><td>523</td><td>17.0</td><td>723</td><td>23.5</td><td>961</td><td>31.3</td><td>864</td><td>28.1</td><td>3071</td></tr><tr><td>3</td><td>99</td><td>16.4</td><td>140</td><td>23.3</td><td>169</td><td>28.1</td><td>194</td><td>32.2</td><td>602</td></tr><tr><td>4</td><td>27</td><td>22.4</td><td>20</td><td>15.9</td><td>37</td><td>29.4</td><td>42</td><td>33.3</td><td>126</td></tr><tr><td>5</td><td>5</td><td>29.4</td><td>3</td><td>17.6</td><td>2</td><td>11.8</td><td>7</td><td>41.2</td><td>17</td></tr><tr><td>6</td><td>0</td><td>0</td><td>2</td><td>40.0</td><td>1</td><td>20.0</td><td>2</td><td>40.0</td><td>5</td></tr><tr><td>7</td><td>0</td><td>0</td><td>0</td><td>0</td><td>0</td><td>0</td><td>1</td><td>100.</td><td>1</td></tr><tr><td>All</td><td>825</td><td>16.7</td><td>1157</td><td>23.3</td><td>1494</td><td>30.1</td><td>1485</td><td>29.9</td><td>4961</td></tr></table>
#### 3.5 Statistical links of volcanic eruptions with the eigen vector variations
Let us explore further the temporal variations of the frequencies of volcanic eruptions (VE) and variations of the summary curve of the PCs (Fig. 5, bottom plot), or the eigen vectors, EVs, of the SBMF [32] defining the solar activity during the solar cycles from 1750 to 2020.
In order to compare the frequencies of volcanic eruptions with variations of the summary curve of the PCs of SBMF, the arbitrary amplitudes of the summary curve variations were normalised by its maximal magnitude. The comparison of these two series with the frequencies of volcanic eruptions inverted from minima on the top to maxima at the bottom is shown in Fig. 5: in the top plot - for a symbolic 11 year cycle defined by averaged sunspot num bers and in the bottom plot - for symbolic double solar cycle defined by 22-year. e.g. two 11 cycles, of the summary curve of eigen vectors (EVs) of SBMF, one cycle with the northern and another with the southern magnetic polarity.
The volcanic eruption (VE) frequencies are presented versus a symbolic 22 year solar cycle (two cosine functions (yellow line) with the opposite polarities as shown in Fig. 5, bottom right plot), imitating two 11 year cycles of a summary curve of eigen vectors (EVs) of SBMF (Fig. 4, top plot). The summary VE frequencies were calculated for the intervals marked by rectangular, for the 2 EV cycles for the two intervals: 1750-1868 (black line) and 1868-1950 &1990-2020 (indigo line).
In the period 1868 - 1950 and 1990-2020 the total number of volcanic eruptions (see Fig. 5, right plot) reveals a clear pattern with their maxima following the maxima or descending phase of the magnetic field curve with the southern polarity and minima follow the maxima or ascending phase of the magnetic field maxima with the northern polarity. While in earlier years (1750-1868) this link is not observed, e.g. the total numbers of volcanic eruptions are nearly the same in any intervals of a 22 year cycle having either northern or southern polarities.
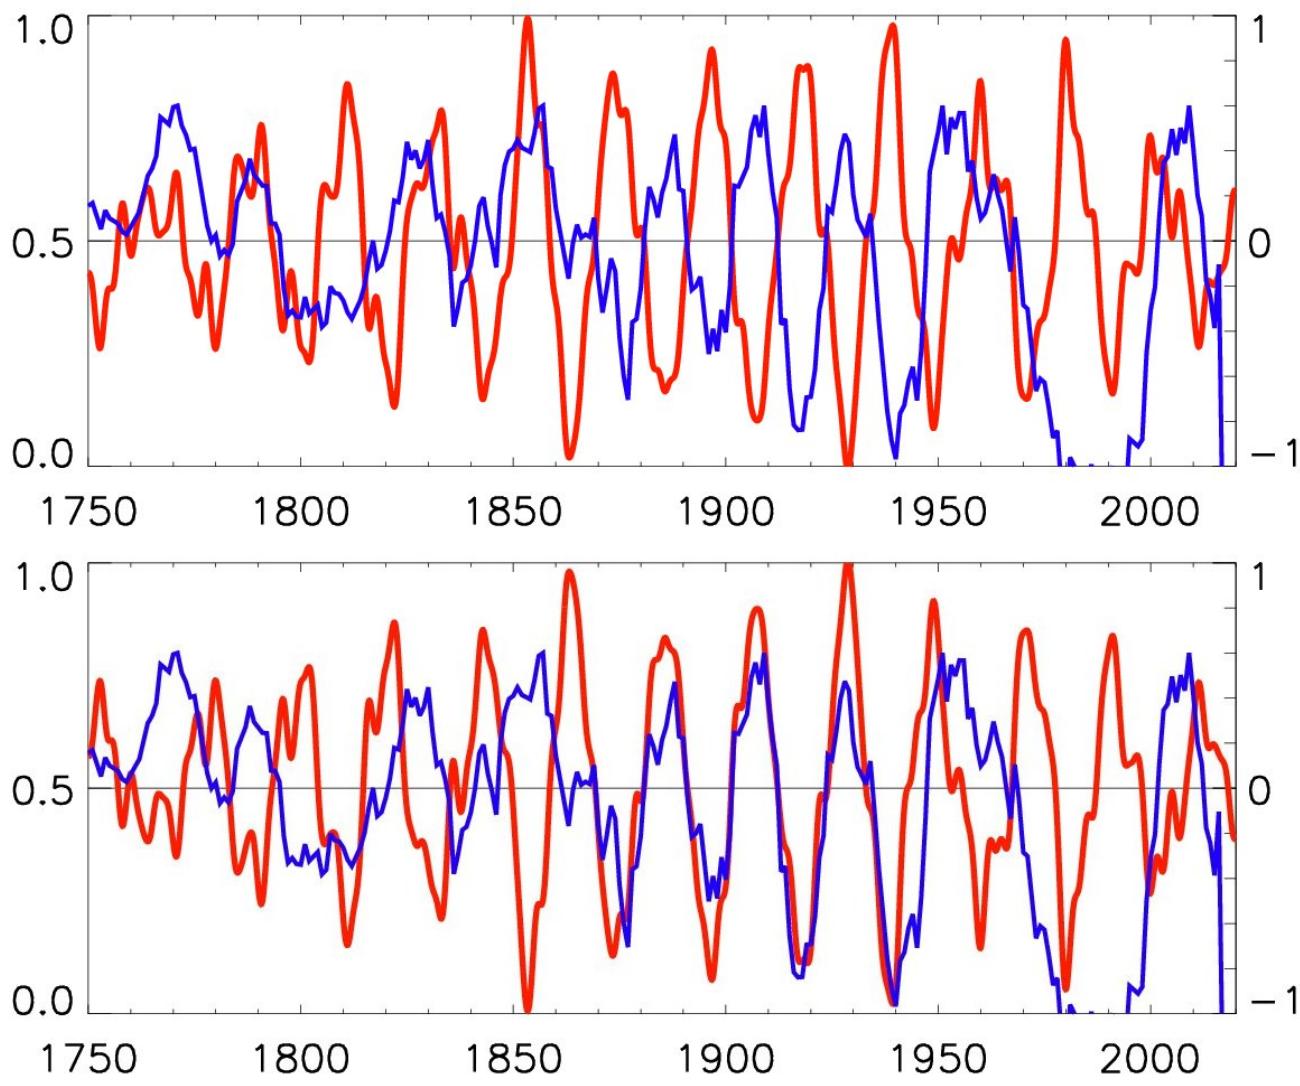
Let us now compare directly these two time series representing temporal evolution of the normalised summary curve of eigen vectors (EV) and the curve of volcanic eruption (VE) frequencies as plotted in Fig. 6: top plot - for real EV of SBMF and VE and bottom plot - for the inverted EV, curve EV1, multiplied by minus unity. The inversion of EV is done so that the maxima of EV1 correspond to the EV cycles with southern polarity and coincide with maxima in VEs, while the minima of VEs correspond to the EV cycles with northern polarity as shown in Fig. 6, bottom plot.
Since we found from Fig. 6 that there were two distinct temporal intervals where the volcanic frequencies show different properties: 1750-1868 and 1868-2020, let us look at the correlation coefficients of these series in Fig. 6 not only for a whole period but also for these two periods, e.g. "by parts". From comparing directly the curves VEs and EVs in Fig. 6, top plot, it is evident that the curve of VEs shows, indeed, different level of correspondence with the curve of EVs in the periods of 1750-1868,1868-1950, 1950-1990 and 1990-2020.
There are close correspondences in the curves during the periods of 1868-1950 and 1950-2020, while not clear links between VEs and EVs before 1868 and during the period of 1950-1990. There is a rather weak correspondence of the EV and VE curves in the early years before 1868 whose nature we need to explore. The disappearance of a link of VEs with the solar or terrestrial magnetic fields in 1950s to 1980s can be linked to the open nuclear bomb testing as the link is restored a few decades after this testing was banned and nearly stopped, so this period was omitted from the consideration.
The Spearman correlation analysis of the overall VE and EV1, or the inverted EV data, was carried out using the IBM SPSS Statistics package (v28) for a) the whole interval from 1750 until 2020, b) for the early interval 1750-1868 and c) for the later interval 1868-1950 &1990-2020. The correlation for the whole interval of the datasets VE and EV1 (1750-2020) produced a positive correlation coefficient of 0.21. This low correlation between VE ad EV1 is likely to be affected by the problems with the datasets reported for the periods before 1868 and between 1950-1990. For the period b) of volcanic eruption in 1750-1868 the correlation coefficient of VEs with EV1, or the inverted EVs, was -0.33, while for the volcanic eruptions in the period c) of 1868-1950& 1990-2020 the correlation reaches the high magnitude of 0.84. Definitely, tin the period c) from 1868 onwards (excluding 1950-1990) there is a strong correlation of volcanic eruptions VEs with EVs of the solar magnetic field when it has the southern polarity. This defines a strong correlation of VEs with the summary curve of EVs having southern polarity and minima at EVs with EVs with northern polarity.
The correlation results are also presented for the key two periods b) and c) with the scatter plots seen in Fig. 7 for 1750-1868 (top plot) and for 1868-1950 &1990-2020 (bottom plot) following the links between VE and EV demonstrated in Fig. 6 (top plot). In the plots we present the data fitting for the correlation coefficients with linear and quadratic functions which seem to be rather close. The standard deviations (STDs) from the fits are shown by the inner set of lines about the fits, while the confidence intervals for a $95\%$ confidence level are shown by the outer lines for the both data sets revealing very close fit of the correlation coefficient in the second period (1868-1950) and much more scattered one in the first one (1750-1868).
Hence, the volcanic eruption (VE) frequencies have maxima every 22 years during the periods when the summary curves of eigen vectors (EVs) have the southern polarity. This coincides with the period of 22 years found from the volcanic eruption frequencies in the wavelet section using the Morlet wavelet shown in Fig. 3. Also this confirms the total numbers of volcanic eruptions shown in Fig. 5 (bottom right plot) during a 22 year cycle (red line) for the period of 1750-1868 (black curve) and 1868-1950 (magenta curve) and the findings that the maximum volcanic eruptions occur during the maxima of solar activity cycles of EVs of SBMF with southern magnetic polarity. Furthermore, this link between VEs and EVs can also explain not only the short term 11/22 year periods of volcanic eruptions but also the longer period of 350 years detected in volcanic eruptions [17], which coincides with the grand solar cycle periods of 350-380 years detected in the EVs of SBMF.
Therefore, a strong correlation of 0.84 (with $p$ value of 0.01) of the frequencies of volcanic eruptions in 1868-1950 and solar magnetic cycles with the southern magnetic polarity of the summary curve, or more active southern hemisphere of the Sun, can be understood in the terms of the accepted views that the increase of geomagnetic disturbances often correspond to an increase in the interplanetary magnetic field of the southern polarity (see, for example, [23, 58-62]). This finding is in line with the other studies showing the high speed solar wind streams during minima of solar activity or possible mass circulation during maxima caused by solar flares and energetic proton fluxes to be the likely drivers of the most powerful earthquakes [24-26] and, possibly, volcanic eruptions [5-7, 17]. A possible reason for the lower correlation in the early years of 1750-1868 is suggested in section 4.1 below.
## IV. DISCUSSION AND CONCLUSIONS
### 4.1 Volcanic eruptions and motion of the North pole
The Carrington solar event in 1859, the largest recorded solar magnetic event, has been associated with the external field changes with the minimum -1760 nT at the Colaba magnetic Observatory in Bombay [63, 64]. Also, there is the evidence that a geomagnetic jerk has occurred around 1860 [65, 66]. The geomagnetic jerk is a relatively abrupt change in the rate of secular variations in one or more parameters of the Earth's magnetic field. One of the most powerful geomagnetic jerks was observed during of 1969-1970. Until about 1971, the northern magnetic pole moved more or less uniformly at a speed of about $10\mathrm{km}$ /year, then suddenly began to accelerate. This acceleration of the pole motion can be associated with the so-called geomagnetic jerk that occurred in 1969-1970 [65, 66].
The geomagnetic jerk, which took place around 1860, may help to explain the change in direction of the northern magnetic pole, which was suggested when considering earthquakes $^{4}$. Another possible confirmation of the internal restructuring of the Earth in the 60s of the 19th century may be a sharp change in the direction of the motion of the Earth's magnetic pole (Fig. 8) according to model calculations $^{5}$. The green curve defines the pole movement in 1590-1750, the blue line - in 1750-1860 and the indigo ccurve in 1860-2025 with the small arrows indicating the direction of movement.
We present in Fig. 8 the calculation of the pole movement from 1590 up to 2025 including the shift in 1590-1860 of the magnetic pole far away from its geographic position first to lower latitudes in 1590-1750 (green line), then further shift to lower latitude nearly along the parallel in 1750 - 1860 (blue line) and then turning the pole movement towards its geographical location in 1860-2025 (the indigo line), approaching in 2025 the location1 of $38^{\circ}057$ of the eastern longitude and $85^{\circ}.778$ of the northern latitude. The smaller movements are also recorded in the Southern pole not shown here.
These pole shifts can cause a reduction of the interaction of the terrestrial magnetic field with the solar magnetic field of any polarity that is likely occurred in the early years of observations of solar activity in the 16-17 centuries. Although, after 1860 the pole began returning back by rapidly approaching the geographic pole position of the Earth that simplified this interaction of the terrestrial magnetic field with the solar magnetic field. This geographical pole position was approached as close as possible in 2018, and after this time the magnetic pole kept moving away again. These dates of the pole movement coincide very well with the periods identified by us from a comparison of the number of volcanic eruptions and the SBMF variations that suggests that the pole movement in the Earth can be the reason of poor interaction of the terrestrial and solar magnetic fields that affects the tension and activity in the terrestrial crusts leading to volcanic eruptions.
#### 4.2 Volcanic eruptions linked to a 22 year magnetic cycle
In this paper we explored the frequencies of volcanic eruptions (VEI $\geq 2$, 3829 eruptions) in the past two centuries and their possible links to the variations of solar activity and solar background magnetic field. In the period 1868 - 1950 and 1990-2020 the total numbers of volcanic eruptions are maximal during the maxima or the descending phase of the magnetic field curve with the southern polarity, and minimal during the maxima or ascending phase of the magnetic field maxima with the northern polarity. While in the earlier years (1762-1868) this link disappeared, the total numbers of volcanic eruptions are nearly the same in any intervals of a cycle having either northern or southern polarities if solar activity is defined by either by sunspots or eigen vectors of solar background magnetic field.
By applying the Morlet wavelet analysis to frequencies of VEs, we detected the dominant period of volcanic eruptions to be about $21.4 \pm 1.4$ years, while there is also a weaker period of 10.7 years similar to that found earlier [17]. This dominant period corresponds to the 22 year period of variations of the summary curve of eigen vectors derived from the solar magnetic field. Curiously enough, the another period of 350 years obtained from the frequency of VEs reported by Stothers [17] can be also accounted by the variations of EVs in a grand solar cycle of 350-380 years reported for SBMF variations [32]. The smaller period of about 50-62 years detected by us is loosely close to the large period of 80 years detected by Stothers [17].
In the next step a direct comparison was carried for the two time series, frequencies of volcanic eruptions, VE, with the summary curve of eigen vectors, EVs, of solar background magnetic field by running the correlation analysis with the SPSS software. During the period of 1868-1950 plus 1990-2020 we derived a rather high positive correlation 0.84 of the number of volcanic eruptions VEs with the southern polarity of the summary curve of EVs derived from the solar background magnetic field representing more active southern hemisphere of the Sun, while during the period 1750-1868 this correlation dropped to the negative one of -0.33. These correlation coefficients are supported by the scatter plots demonstrating mean fitting curves with standard deviations marked in $95\%$ confidence interval. The strong correlation between the VEs and the summary curve of EVs recorded for 11 cycles of EVs after 1868 suggests that possible physical mechanisms of volcanic eruptions are linked to the processes associated with the increased solar activity features in the southern hemisphere.
This strong link of volcanic eruptions with the summary curve of eigen vectors of southern polarity, or more active southern hemisphere of the Sun, is likely to include the increased electro-magnetic interaction of the solar magnetic field of southern hemisphere with the terrestrial magnetic field causing geomagnetic disturbances [23, 58-61] that can lead to shifts of the crusts, most powerful earthquakes [24] and volcanic eruptions. This can be also influenced by the perturbations of solar wind particles and waves on the Earth's air masses during minima of solar activity [17, 24] or an increase in precipitation of energetic particles during the maxima of solar activity[5-7, 17] that can lead to an increase in the tectonic/volcanic instability.
The possible reasons of a reduced correlation between the volcanic eruptions and solar activity index recorded in the period of 1750-1868 can be associated with the migration of the Earth's North pole towards lower latitudes that disrupts the interaction of the solar magnetic field of southern polarity with the terrestrial magnetic field that can affect the status of the Earth crusts and lead to volcanic eruptions. Although, some of the differences between the distributions of eruption frequencies over the phases of solar cycles of 11 years can be related to the differences in solar activity indices defined by sunspots and the eigen vectors of magnetic fields, that is related to actions different types of solar magnetic fields, toroidal and poloidal [55]. While the increase of volcanic eruptions and the lack of correlation in 1950-
1980 can be linked to the open air nuclear bomb testings that distorted natural effects of the interaction of magnetic fields of the Sun and Earth.
In summary, the increase of volcanic eruptions established during the solar activity cycles with the southern polarity of SBMF emphasises the importance of the solar-terrestrial interaction in volcanic eruptions and their effects on the terrestrial climate [30]. This link can also play an important role in the next few decades affected by the modern Grand Solar Minimum (2020-2053) [32, 35] because in cycle 26 the summary EV of the solar background magnetic field will have the southern polarity. Hence, despite the links between volcanic occurrences and solar activity become only established for 8 solar cycles in the past century and in the last four cycles of this century, the consequences of volcanic eruptions for the terrestrial atmosphere can be noticeable during cycle 26 with the southern polarity of solar magnetic field. This can affect the terrestrial atmosphere transparency [8] and can result in further reduction of the terrestrial temperature during the modern GSM (2020-2053).
### ACKNOWLEDGMENTS
The authors wish to express their many thanks to the Smithsonian Institution staff for providing the access to the GVP database containing the volcanic eruption data and the Solar Influences Data Analysis Center (SIDC) at the Royal Observatory of Belgium for providing the averaged sunspot numbers. The authors also express their deepest gratitude to the staff and directorate of Wilcox Solar Observatory, Stanford, US, for providing the coherent long-term observations of full disk synoptic maps of the solar background magnetic field.
Author contributions statement
I.V. gathered and processed the volcanic frequency data while V.Z. provided and analysed the solar background magnetic field data and carried statistical analysis of the data with the SPSS package. V.Z. and I.V. compared and analysed the results, wrote and reviewed the manuscript.
#### Additional information
The authors do not have any competing financial interests.
Generating HTML Viewer...
References
65 Cites in Article
R Stamper,M Lockwood,M Wild,T Clark (1999). Solar causes of the long‐term increase in geomagnetic activity.
Yanben Han,J Guo,C Ma (2004). Possible triggering of solar activity to big earthquakes (Ms?8) in faults with near�west-east strike in China.
N Sobolev,V Demin (1980). Wochenrückblick: Google Books, Content ID, Verwaiste Werke.
C Newhall,S Self (1982). The Volcanic Explosivity Index (VEI): An Estimate of Explosive Magnitude for Historical Volcanism.
M Rampino,S Self,R Stothers (1988). Volcanic Winters.
Alan Robock (2000). Volcanic eruptions and climate.
L Gray,J Beer,M Geller,J Haigh,M Lockwood,K Matthes,U Cubasch,D Fleitmann,G Harrison,L Hood,J Luterbacher,G Meehl,D Shindell,B Van Geel,W White (2010). SOLAR INFLUENCES ON CLIMATE.
E Kluge (2012). Ueber Synchronismus und Antagonismus Yon Vulkanischen Eruptionen und die Beziehungen Derselben zu Den Sonnenfiecken und Erdmagnetischen Variationen.
L De Marchi (1911). Le Cause Dell' Era Glaciale.
W Köppen (1896). Parallelismus zwischen der häufigkeit der sonnenflecken und der vulkanausbr¨uche.
Curtis Lyons (1899). SUN SPOTS AND HAWAIIAN ERUPTIONS.
J O'reilly (1889). On the dates of volcanic eruptions and their concordance with the sunspot period.
H Jensen (1902). Possible relation between sunspot minima and volcanic eruptions.
K Sapper (1930). Cycles of volcanic activity.
R Stothers (1989). Volcanic eruptions and solar activity.
A Mazzarella,A Palumbo (1989). Does the solar cycle modulate seismic and volcanic activity?.
L Ma,Z Yin,Y Han (2018). Possible influence of solar activity on global volcanicity.
J Str ˇstik (2003). Possible correlation between solar and volcanic activity in a longterm scale.
S Schneider,C Mass (1975). Volcanic Dust, Sunspots, and Temperature Trends.
Dhani Herdiwijaya,Johan Arif,Muhamad Nurzaman,Isna Astuti (2015). On the possible relations between solar activities and global seismicity in the solar cycle 20 to 23.
Walter Gonzalez,Bruce Tsurutani,Alicia Clúa De Gonzalez (1999). Interplanetary origin of geomagnetic storms.
S Odintsov,K Boyarchuk,K Georgieva,B Kirov,D Atanasov (2006). Long-period trends in global seismic and geomagnetic activity and their relation to solar activity.
Vito Marchitelli,Paolo Harabaglia,Claudia Troise,Giuseppe De Natale (2020). On the correlation between solar activity and large earthquakes worldwide.
V Martichelli,P Harabaglia,C Troise,G De Natale (2020). On the Long Range Clustering of Global Seismicity and its Correlation With Solar Activity: A New Perspective for Earthquake Forecasting.
D Herdiwijaya,A Johan,M Nurzaman (2014). On the Relation between Solar and Global Volcanic Activities.
D Anderson (1974). Earthquakes and the Rotation of the Earth.
E Kluge (1863). Ueber Synchronismus und Antagonismus Yon Vulkanischen Eruptionen und die Beziehungen Derselben zu Den Sonnenfiecken und Erdmagnetischen Variationen.
V Zharkova,S Shepherd (2022). Eigen vectors of solar magnetic field in cycles 21-24 and their links to solar activity indices.
J Eddy (1976). The Maunder Minimum.
V Zharkova (2020). Modern grand solar minimum will lead to terrestrial cooling.
V Velasco Herrera,W Soon,D Legates (2021). Does Machine Learning reconstruct missing sunspots and forecast a new solar minimum?.
S Shepherd,S Zharkov,V Zharkova (2014). Prediction of Solar Activity from Solar Background Magnetic Field Variations in Cycles 21-23.
V Zharkova,S Shepherd,E Popova,S Zharkov (2015). Heartbeat of the Sun from Principal Component Analysis and prediction of solar activity on a millenium timescale.
I Kitiashvili (2020). Application of Synoptic Magnetograms to Global Solar Activity Forecast.
V Obridko,D Sokolo_,V Pipin,A Shibalvaa,I Livshits (2021). Zonal harmonics of solar magnetic field for solar cycle forecast.
J Lean,J Beer,R Bradley (1995). Reconstruction of solar irradiance since 1610: Implications for climate change.
D Easterbrook (2016). Evidence-based Climate Science.
D Parker,P Jones,C Folland,A Bevan (1994). Interdecadal changes of surface temperature since the late nineteenth century.
S.-I Akasofu (2010). On the recovery from the little ice age.
M Lockwood,R Stamper,M Wild (1999). A doubling of the Sun's coronal magnetic field during the past 100 years.
V Zharkova,S Shepherd,S Zharkov,E Popova (2019). RETRACTED ARTICLE: Oscillations of the baseline of solar magnetic field and solar irradiance on a millennial timescale.
Valentina Zharkova (2021). Millennial Oscillations of Solar Irradiance and Magnetic Field in 600–2600.
Friedhelm Steinhilber,Jose Abreu,Jürg Beer,Irene Brunner,Marcus Christl,Hubertus Fischer,Ulla Heikkilä,Peter Kubik,Mathias Mann,Ken Mccracken,Heinrich Miller,Hiroko Miyahara,Hans Oerter,Frank Wilhelms (2012). 9,400 years of cosmic radiation and solar activity from ice cores and tree rings.
Marilia Hagen,Anibal Azevedo (2023). Influence of Volcanic Activity on Weather and Climate Changes.
V Bumba (1986). Large-Scale Solar Magnetic Fields.
F Steinhilber,J Beer,C Fr¨ohlich (2009). Total solar irradiance during the Holocene.
V Zharkova,S Shepherd,S Zharkov (2012). Principal component analysis of background and sunspot magnetic field variations during solar cycles 21-23.
Michael Schmidt,Hod Lipson (2009). Distilling Free-Form Natural Laws from Experimental Data.
M Temmer,A Veronig,A Hanslmeier (2002). Hemispheric Sunspot Numbers Rn and Rs: Catalogue and N-S asymmetry analysis.
S Zharkov,V Zharkova,S Ipson (2005). Statistical Properties Of Sunspots In 1996 2004: I. Detection, North South Asymmetry And Area Distribution.
(2014). Volcanoes of the World, v.4.3.4.
V Zharkova,I Vasilieva,S Shepherd,E Popova (2022). Comparison of solar activity proxies: eigen vectors versus averaged sunspot numbers.
V Zharkova,I Vasilieva,E Popova,S Shepherd (2023). Comparison of solar activity proxies: eigenvectors versus averaged sunspot numbers.
V Courtillot,F Lopes,J Le Mou¨el (2021). On the Prediction of Solar Cycles.
K Maezawa (1974). Dependence of the magnetopause position on the southward interplanetary magnetic field.
Paul Perreault,S-I Akasofu (1978). A study of geomagnetic storms.
P Stauning (1994). Coupling of IMF BY variations into the polar ionospheres through interplanetary field-aligned currents.
P Stauning,C Clauer,T Rosenberg,E Friis-Christensen,R Sitar (1995). Observations of solar-wind-driven progression of interplanetary magnetic field BY -related dayside ionospheric disturbances.
D Prosovetsky,I Myagkova (2011). The correlation between geomagnetic disturbances and topology of quasi-open structures in the solar magnetic field.
E Cliver,W Dietrich (2013). The 1859 space weather event revisited: limits of extreme activity.
M Mandea,A Chambodut (2020). Geomagnetic field processes and their implications for space weather.
L Newitt,E Dawson (1984). Secular variation in North America during historical times.
Global Volcanism Program,G (2013). Volcanoes of the World.
R Wolf (1870). Studies on the frequency of Sun-spots, and on their connexion with the Magnetic Declination-variation.
No ethics committee approval was required for this article type.
Data Availability
Not applicable for this article.
How to Cite This Article
Irina Vasilieva. 2026. \u201cLinks of Terrestrial Volcanic Eruptions to Solar Activity and Solar Magnetic Field\u201d. Global Journal of Science Frontier Research - A: Physics & Space Science GJSFR-A Volume 23 (GJSFR Volume 23 Issue A3).
Explore published articles in an immersive Augmented Reality environment. Our platform converts research papers into interactive 3D books, allowing readers to view and interact with content using AR and VR compatible devices.
Your published article is automatically converted into a realistic 3D book. Flip through pages and read research papers in a more engaging and interactive format.
Our website is actively being updated, and changes may occur frequently. Please clear your browser cache if needed. For feedback or error reporting, please email [email protected]
Thank you for connecting with us. We will respond to you shortly.