## I. INTRODUCTION
The patient is a consumer of health services and thus has certain rights, putting an emphasis on the delivery of quality health care. Patient satisfaction is an important and commonly used indicator for measuring the quality in health care [1]. Communication and health-related behavior are key markers of patient satisfaction [2]. The three most important aspects in patient - doctor communication are creating a good interpersonal relationship, exchanging information, and involving the patient in making treatment-related decisions [3]. Treatment related decisions are not relevant when doing an independent medical examination (IME) for a third party.
A qualitative study identified three key interacting components; "Listening", "Asking for information", and "Giving information" as central and covering two-thirds of the identified interaction types [4]. A study of patient satisfaction in a disease specific setting identified four factors that displayed eigenvalues greater than 1.0: 'Interpersonal Skills,' 'Quality of Time,' 'Empathy,' and 'Information Exchange' [5].
There are numerous satisfaction surveys available. Consumer satisfaction surveys are used by different organisations and individuals for varying purposes. The patient satisfaction field has increasingly been moving towards disease or condition-specific patient satisfaction questionnaires focussing on decision making, treatment and outcome, tapping aspects of satisfaction that are unique to that disease [6]. Researchers have used modified versions of commonly used questionnaires which excluded subscales not applicable in the context of these studies [7].
Hawthorne demonstrated that a Short Assessment of Patient Satisfaction (SAPS) scale based on seven questions each covering a separate dimension could adequately assess patient satisfaction of health care [8]. The questionnaire was proven robust, with good internal consistency reliability and correlated well with several accepted longer questionnaires. However, the domains are unsuitable for an IME.
An IME is unique in medicine. It is an objective medical examination on behalf of a third-party to confirm the extent of the subject's injuries. The report is often used to confirm or deny benefits, coverage, or settlements, or provide steps for safe return to work. The IME doctor is not the patient's treating doctor or personal adviser, and diagnosis, treatment and outcome are not an issue. However, client satisfaction with the IME is not excluded. The circumstances sometimes considered adversarial by the client might heighten dissatisfaction.
A literature search using the PubMed data-base and the search terms "independent medical examination", "satisfaction", and "questionnaire" failed to identify any relevant publications. A random search found one paper reporting a satisfaction survey conducted on patients from a medico-legal consultation [9].
The aim of this study was to develop a short generic satisfaction questionnaire, with acceptable psychometric standards, suitable for use in the setting of an IME. The scale required sub-scales or domains relevant to the examination that more than likely would influence the patient's/client's satisfaction. The questionnaire needs to be self-administrated, brief, understandable and easy to complete by clients aged 18 years and older. Whether the responses were influenced by socio-demographic factors or health status needed exploring.
## II. MATERIALS AND METHODS
### a) Questionnaire Development
The domains were selected to address aspect of the consultation perceived to be the most likely factors to affect the client's satisfaction with the encounter, focussing on doctor-client relationship, communication, and the client's perception of the adequacy of the history-taking and examination. The five domains selected were: interpersonal manner, communication, technical skill (examination), perceived exchange of information, and time allocation. The outcome was assessed by a question on general satisfaction. The complete questionnaire (IMESQ) of six items is attached in Appendix 1. Each question addresses a single domain and each has a 5-point Likert scale response. The scales are ordinal, varied and not uniformly weighted. Four of the six questions were positively worded. The responses were scored from 1 (the worst) to 5 (best) giving a total score ranging from six to 30. The higher the total score the greater the satisfaction.
To test the construct validity and consistency of the questionnaire, the study included a 0-to-10 numerical scale of satisfaction (NSS) for comparison with the total score from the six items. A further question inquired as to whether the client would be "willing to undergo another examination with the doctor if required". This assumes that higher levels of satisfaction would positively relate to Willingness to be re-examined by the doctor. The choices of responses were: "yes", "no", and "maybe". At the end of the structured questionnaire, a text box for open-ended comments was included to accommodate the qualitative information provided by the respondents. However, commenting was optional.
The study included an additional five questions relating to items thought to be independent variables: gender, age (in four categories), whether the client was born in Australia, had previously undergone an IME, and whether working or not. The latter items were included to see if immigrants, previous experience of a similar examination, and not working influenced the client's perception of satisfaction.
automatically downloaded. The program provides automatic collation and analysis of the total data presented in graphic form, and allows access to individual responses for in-depth analysis.
Some items perceived as probably independent including level of education achievement (Unqualified), domestic status (Partnered), and the EQ-5D 3L quality of life utility scores ( $M =.55$, $SD =.16$, $Mdn =.52$ ) and were added from the client's records for the in-depth analysis.
### b) Study Site
This was a cross-sectional study of clients/ participants who attend the author for an IME between November 2021 and March 2022. Initially the questionnaire was emailed to the client after the examination. There was only one response from the first thirteen clients and emailing was abandoned because of the poor response. The questionnaire was administered following completion of the consultation before the client departed the office. This ensured a satisfactory number of responses. The participants completed and signed a written informed consent.
### c) Statistical Analysis
Data was collated into Excel and DATA tab for analysis. Primary analysis with Shapiro-Wilks test found that all data was not normally distributed except for chronological age. The Items of the IMESQ, the total IMESQ score and the NSS were distributed with an asymmetrical left, negative skewness, with normal-like, left tails. As the Item scores were ordinal and not normally distributed, Spearman's rank-order correlation coefficient was used to analyse the correlations for ordinal and continuous data. The rank-biserial correlation was used for continuous and ordinal data with binary data: "Willingness of further review", gender, Australian born, working, partnered (domestic status), and unqualified (no trade or tertiary qualification). Chi-square statistic was used for comparison of dichotomous and nominal data. For the descriptive purposes, an adapted Dancey and Reidy classification of the strength of correlation was used [10]. A $p < 0.05$ was accepted as the level of significance.
Construct validity of the questionnaire was tested against alternate forms of measuring satisfaction. The total IMESQ score was compared with the NSS using Spearman's correlation. An alternative hypothesis was that satisfaction would correlate with a Willingness to be examined by the doctor again. The potential future utilisation of the service was tested using rank-biserial correlation. The impact of demographic factors on the IMESQ was explored.
Paired inter-Item correlations, Spearman-Brown split-halves reliability and Cronbach's alpha coefficient were used to test internal consistency reliability to determine the extent to which all of the items in the model measure the different aspects of the satisfaction [11]. Although all items contained non-normally distributed data which violates the axioms for using Cronbach's alpha, studies have reported it as a robust measure [12]. Alpha coefficient 0.70 or greater was considered sufficiently reliable [13]. Before performing a Principal Components Analysis (PCA), the suitability of the data for that analysis was tested by the Kaiser-Meyer-Olkin values and Bartlett's Test of Sphericity.
To test the accuracy of the participants' responses, intrarater reliability was assessed using Intra Class Coefficient (ICC) based on the analysis of variance (ANOVA) models [14-17]. The Concordance Correlation Coefficient (CCC) was calculated. Unlike the calculation of the ICC which assumes normal distribution of data, Lin's CCC is the correlation of point estimates in relation to the $45^{\circ}$ line through the origin and is suitable for non-normal data [18,19]. A Bland-Altman analysis identified discordant responses (Outliers) due to possible confounding factors or client bias [20-22]. The impact of demographic factors on the discordant data was explored.
## III. RESULTS
There were 76 respondents. All questionnaires were completed without missing information. Metric and ordinal data was assessed for normality of distribution using Shapiro Wilk statistic. Only chronological age ( $M = 42.9$, $SD = 13.3$, Range [18, 73]) was normally distributed.
The independent variables and descriptive data defining the demographics of the cohort is summarised in Table 1. There was a statistically significant relationship between Male and Unqualified, $\chi^2 (1) = 11.13$, $p =.001$. Males were more likely to be unqualified, Odds ratio = 5.4, 95% CI [1.9, 15.0].
<table><tr><td></td><td>Frequency</td><td>% of Cases</td></tr><tr><td>Male</td><td>34</td><td>45%</td></tr><tr><td><40yo</td><td>27</td><td>36%</td></tr><tr><td>Unqualified</td><td>27</td><td>36%</td></tr><tr><td>Partnered</td><td>53</td><td>70%</td></tr><tr><td>Australian born</td><td>50</td><td>66%</td></tr><tr><td>Working</td><td>48</td><td>63%</td></tr><tr><td>Previous IME</td><td>36</td><td>47%</td></tr><tr><td>EQ5D <0.50</td><td>13</td><td>17%</td></tr></table>
### a) The Questionnaire
Total scores for the IMESQ ranged from 18 to 30 with $36\%$ of the participants having the maximum score of 30 ( $M = 29$, $SD = 3.17$; $Mdn = 29$, $Q1 = 25$ ). The ceiling for each item ranged from $49\%$ to $55\%$ and floor effect from $4\%$ to $11\%$. As expected, multiple logistic regression indicated that there was a very strong collective significant effect between all items and each item and the IMESQ, $\chi^2 (9,76) = 90.27$, $p <.001$, $R^2_N =.96$. The power for the entire model was medium (.67). Spearman correlation showed that there was a low but significant positive correlation between chronological Age and IMESQ, $r(74) = 0.28$, $p =.015$. A significant, small negative correlation was also noted between Unqualified and IMESQ, $r(74) = -0.25$, $p =.033$. The IMESQ had no statistical association with the other independent variables.
### b) Internal Consistency Reliability
Inter-item correlation was high for all items indicating that the questionnaire is possibly unidirectional and that each dimension relates well to all others (Table 2). Cronbach's alpha coefficient was $\alpha =.91$. The corrected item-total correlations show that each item was consistent with the other items taken together (Table 3). Cronbach's alpha when each item was sequentially deleted was no greater than Cronbach's alpha for the whole scale. The high alpha coefficient indicates a high level of internal consistency reliability of the questionnaire and the total score obtained by summing the responses across all items reflects the same construct and the possibility that the questionnaire may be unidimensional [23].
### c) Exploratory Factor Analysis (EFA)
Kaiser-Meyer-Olking Measure of sampling adequacy was 0.87. A KMO value between 0.7 and 0.8 is good and suitable for factor analysis [24]. Bartlett's Test of Sphericity was also significant $(\chi^2 (15) = 308.56, p <.001)$ confirming at least one significant correlation between two of the items [25].
Two of the assumptions for EFA were not met; the sample does not have multivariate normality and the sample size is small. Factor analysis was considered suitable. The total variance across all dimensions is 6 (Table 4). The two principal components explain $79.3\%$ of the variance within the model. Only the first component has an eigenvalue greater than 1; all but the sixth component having an eigenvalue greater than 0.3. A Rotated Component Matrix (Varimax) and biplot confirmed the questionnaire was unidirectional.
### d) Split-Halves Correlation
The IMESQ was divided into odd and even numbered questions for purpose of a split-half correlation. A Spearman's correlation between variables Odds and Evens showed a high, positive correlation between the variables, $r(74) = 0.78$, $p = <.001$. Pearson's correlation showed a higher, positive correlation, $r(74) = 0.82$, $p = <.001$ and the Spearman-Brown-adjusted Pearson correlation for reliability was $r_{\mathrm{SB}} = 0.90$.
### e) Construct Validation Willingness
Sixty-two (82%) of the participants indicated a "Willingness to submit for another examination if required" while the remaining fourteen participants indicated "maybe". A rank-biserial correlation between variables Willingness and IMESQ showed a medium, positive correlation, $r(74) = 0.41$, $p = <.001$. Univariate analysis of correlations between the Items and Willingness showed moderate association of all Items ranging from $r(74) =.31$ to $r(74) =.45$ ( $p <.01$ ). The Kruskal-Wallis test showed that there was a significant difference in mean ranks between the Items and Willingness, $\chi^2(6) = 248.91$, $p <.001$. The Dunn-Bonferroni test revealed that the pairwise group comparisons of all Items with Willingness were significantly different ( $p <.01$ ). Logistic regression analysis showed that the model as a whole was significant at predicting a Willingness to further examination, $(\chi^2(9,72) = 23.01$, $p =.006$, $R^2_N =.42$. Backward step-wise analysis found that at ease was the sole predictor, $\chi^2(1) = 11.75$, $p$ value $= <.001$. Willingness had no statistically significant association with any confounder.
If a suboptimal level of satisfaction is set at scores where both the IMESQ and NSS are in the first quartile, that is an IMESQ $< 25$ and NSS $< 8$, then the criteria apply to 10participants (13% of the cohort.). Of these participants, 8 were unwilling to submit to further examination compared with 6 of the remaining cohort. Participants who had low scores for both the IMESQ and NSS were forty times more likely (OR = 40.0, 95% CI [6.9, 233]) to be unwilling to undergo further examination, $\chi^2(1) = 29.06$, $p <.001$.
### f) Numerical Satisfaction Scale
Scores on the Numerical Satisfaction Scale (NSS) ranged from 5 to 10 with $42\%$ giving the maximum score $(M = 8.78, SD = 1.36, Mdn = 9, Q1 = 8)$. The distribution of data is shown in Figure 1. There was a strong correlation between the IMESQ and the NSS $(r(74) = 0.82, p = <.001)$. The priori power was.76. Neither measure contained outliers. There is a medium, positive correlation between Willingness and NSS, $r(74) = 0.45, p = <.001$. Individually, all questionnaire items had a strong correlation with the NSS, ranging from $r(74) =.58$ to $r =.70, p < 0.001$. The results of backward step-wise logistics regression indicated that there was a strong collective significant effect between the Items and NSS, $\chi^2(9,76) = 53.34, p <.001, R_{\mathrm{N}}^2 = 0.67$. The individual predictors were examined further and identified Examination and Satisfaction as the only significant predictors in the model. NSS had no association with any demographic factors.
### g) Concordance
A Surrogate score was devised based on the "perfect" relationship between the NSS and the IMESQ being identical measures of participant's satisfaction. The NSS score ranges from zero to 10. The IMESQ ranges from a minimum of six to a maximum of 30. The equation for the Surrogate score was $5 + 2.5^{*}\mathrm{NSS}$ giving a range of five to 30. The Surrogate score was calculated for each participant for comparison with the IMESQ for analysis of association and discordance (Figure 1).
A Spearman correlation was performed to reaffirm the correlation between variables IMESQ, Surrogate score and NSS. There correlation between Surrogate and NSS was $r(74) = 1$. The correlation between IMESQ and Surrogate score was consistent with the correlation between the IMESQ and NSS, $r(74) = 0.82$, $p = <.001$.
A Wilcoxon Signed-Rank test showed that there is a non-significant small difference between IMESQ $(Mdn = 29)$ and Surrogate scores $(Mdn = 27.5)$, $z = -1.7$, $p =.085$, $r = -0.25$. A paired t-test for dependent samples also showed that this difference was small and was not statistically significant, $t(75) = 1.41$, $p =.161$, $d =.23$. Only 37 (49%) of the 76 data pairs were concordant. The Kendall tau coefficient $(\tau(76) = 0.03)$ was poor, equivalent to a random response.
The means and standard deviations of the IMESQ $(Mn = 27.3, SD = 3.16)$ and Surrogate scale
$(Mn = 26.9, SD = 3.41)$ are similar. The distribution of both have similar asymmetrical, left/negative skew with long left tails (skew -1.15, -0.88 respectively). The Shapiro-Wilk analysis shows that both measures were non-normal distributions.
The Levene's test found the variances are not significantly different for the IMESQ and Surrogate score, satisfying the assumption of homogeneity of variance, $F(1,150) = 7.12$, $p =.398$. The Brown-Forsy the $F$ two-sample test for variance also found no significant difference, $F(75,75) =.87$, $p =.266$. The IMESQ and Surrogate scores have equivalent variances. The assumption for both tests was that the distribution of data was normal.
### h) Intra-Rater Reliability
The rater consistency was determined by ICC reliability calculated from an Analysis of Variance by three methods \[16,17\]:
$$
\begin{array}{l} \begin{array}{l} \text {I C C (A , 1) p = . 7 5 0 (}. 6 3 2 - . 8 3 4), F (7 5, 7 6) = 7. 0 1, \\p < . 0 0 1, \end{array} \\\begin{array}{l} \text {I C C (C , 3)} \rho = . 7 5 3 (. 6 3 4 -. 8 3 4), F (7 5, 7 5) = 7. 1 0, \\p < . 0 0 1 \end{array} \\\begin{array}{l} \text {I C C (A , 3) p = . 7 5 1 (. 6 3 4 - . 8 3 4) , F (7 5 , 7 5) = 7 . 1 0 , p} \\< . 0 0 1. \end{array} \\\end{array}
$$
According to Cichetti and Sparrow, the intrarater reliability is good [26]. The ICCs calculated from the data are approximately equal and any bias is likely to be small or negligible [17]. However, ANOVA is poor at detecting bias [27].
Lin's CCC is $\rho c =.75$, $F(1,75) = 6.31$, $\rho <.001$, which according to McBride, the concordance between the IMESQ and Surrogate scale is poor compared to a gold standard measurement [28]. Others would disagree, the threshold of acceptable reliability should vary with the circumstances [29, 30]. Irrespective of the quantitative measure of reliability, there is evidence of intrarater discordance.
### i) Discordance - Bland-Altman analysis
Spearman correlation showed that there was a significant small to medium positive correlation between Mean and Difference, $r(74) = 0.32$, $p =.005$. Simple linear regression was used to test if Mean of the scores significantly predicted the Difference in scores. The fitted regression model was: Difference = 2.62 -0.08 * Mean. The constant is positive suggesting that the questionnaire may have a small positive bias. The overall regression was not statistically significant ( $F(1,74) = 0.91$, $p =.343$, $R^2 =.012$ ). The Mean of the two scores does not significantly predict the Difference in scores ( $\beta = -.08$, $p =.344$ ). The coefficient for the variable Mean in the population is not different from zero. This result is unlikely to reflect the real circumstances where some participants may intentionally or subconsciously underrate the responses to the questionnaire as dissent bias and others who overrate the responses as acquiescence bias.
### j) Outliers
Outliers were identified by a Bland-Altman analysis of the Mean score and the Difference between the IMESQ and the Surrogate score (Figure 2). Note that the assumption of a normal distribution of Difference was not met $(W(76) =.87, p <.001)$. There were four data points outside the limits of agreement $(M + 1.96 * SD)$ for the Difference in scores $(< -4.15, >4.90)$; three below and one above. There were 14 Outliers $(< -2.08, >2.45)$ calculated using the Tukey Fences $(k = 1.5)$ algorithm representing $18\%$ of the sample. Five were low outliers underring the IMESQ relative to the NSS and Surrogate scores, and nine were over raters where the responses to the questions were exaggerated.
Rank-biserial correlation showed that there was no significant correlation between Difference and Outlier, $r(74) = 0.20$, $p = .088$. Rank-biserial correlation showed that there was a significant negative correlation between IMESQ and Outlier, $r(74) = -0.33$, $p < .001$. Univariate analysis showed that Items 1, 2 and 4 in the questionnaire had a small negative but significant correlation with Outliers (range $r(74) = .29$, to $r = -.34$, $p < .05$). The Kruskal-Wallis test showed that there was a significant difference in mean ranks between the Items and Outliers, $\chi^2(6) = 248.91$, $p < .001$. The Dunn-Bonferroni test revealed that the pairwise group comparisons of all items with Outliers were significantly different ($p < .001$). Logistic regression analysis to examine the influence of the Items on the variable, Outlier, to predict the value "1" showed that the model as a whole was not significant, $\chi^2(9,76) = 16.02$, $p = .067$, $R^2_N = .31$. Backward step-wise analysis found that At ease (Item 1) was the sole predictor, $\chi^2(1) = 8.56$, $p = .003$, $R^2_N = .15$. A Chi-square test found no statistically significant relationship between Outlier and Willingness, $\chi^2(1) = 0.33$, $p = .569$. No association was found between any of the independent variables and Outliers. When the Outliers were divided into Underraters (coded -1, Difference < -2.08) and Overraters (coded 1, Difference > 2.45), analysis identified a significant association between Under/Over raters and gender. Underraters were entirely male whereas females accounted for two-thirds of the overraters (Table 5). A Chi-square test was performed between Male and Under/Over Outlier. At least one of the expected cell frequencies were less than 5. Therefore, the assumptions for the test were not met. There was a statistically significant relationship between Male and Under/Over Outlier, $\chi^2(2) = 6.85$, $p = .033$. A Kruskal-Wallis test showed that there is a significant difference between the categories of the independent variable Under/Over-rater with respect to the dependent variable Male, $\chi^2(2) = 6.76$, $p = .034$. The Dunn-Bonferroni test showed that the pairwise group comparison of 0 to -1 (Underrater) has an adjusted $p$ -value of less than 0.05 (Table 6).
Further analysis showed that if 4 points difference between the IMESQ and the Surrogate score was arbitrarily the cut-off for potential bias, then all but one Outlier identified by analysis would still be Outliers. This single case would be considered false negative.
## IV. DISCUSSION
This study has shown that the IMESQ is a valid, unidimensional measure of patient satisfaction following an independent medical examination. The short questionnaire has been shown to produce meaningful results in the assessment of client satisfaction. Although the questions had a high ceiling effect, the aim of the IMESQ is not to identify high achievement but to identify deficiencies which can be corrected.
Inter-item correlation is high for all pairs of items and each dimension relates well to all others. The internal consistency reliability is excellent, greater than the commonly recommended minimum value for Cronbach's alpha (0.70) [13]. A strong split-halves reliability is further evidence of internal consistency.
Construct validity has been demonstrated. The parallel measure, NSS, correlates strongly with the IMESQ. Although not strictly a direct measurement of satisfaction, client Willingness correlates moderately with the IMESQ. Willingness may be subject to confounding factors such as indecision or client bias. In the absence of a correlation with Outlier, it cannot be concluded that the responses to Willingness in this sample were biased. Some client might have difficulty expressing dissatisfaction with the service while they were still in the office, which could result in overestimated satisfaction of care. Nonetheless, the findings indicate that the IMESQ can be used to obtain reliable and valid information of satisfaction with an IME.
At ease was a predictor of Willingness and Outlying scores. "Interpersonal manner" appears to be the dominant determinant of client satisfaction on factor analysis. Communication skills, putting the client at ease and being respectful were dominant determinants of client satisfaction.
With the exception of chronological age and being unqualified, scores on the IMESQ were not influenced by the other socio-demographic characteristics. The association between chronological age and the IMESQ was small indicating that the score was better with age but not specifically for clients over 40 years of age. Other researchers have noted that satisfaction increased with age [31, 32]. The IMESQ was negatively associated with having no educational qualifications and may reflect a pessimistic outlook on returning to work. Furthermore, the IMESQ was not influenced by quality of life/general health status. This contrasts with other researchers who found that satisfaction correlated with the health status and emotional well-being [33-35].
The client who is angry and frustrated by the cause of the injury (blame), medical management, and/or processing of the claim may intentionally or subconsciously underrate the scores on the questionnaire and produce low IMESQ scores due to dissent bias. From the data, it has been shown that the responses can be discordant. A small group, all male, was shown to underrate their responses, and another group, predominantly female, to exaggerate their responses. The addition of suitably a worded question representing a "Dissatisfaction" domain directed to assessing dissatisfaction with treatment and management might yield useful information of circumstances beyond the scope of the IME that influence the responses to the questions. Given that Outliers had a difference of 4 between the IMESQ and Surrogate score calculated from the NSS, an additional 5-point Likert scale question with reverse scores could be considered to gauge the impact of dissatisfaction as a confounder on client responses. A reverse score for a Dissatisfaction item may not alter the scoring balance.
### a) Limitations
The study has some fundamental limitations which probably do not invalidate the conclusions. The study is an underpowered, small cohort of clients and one examiner. The study needs to be expanded to include several examiners and translated into other non-English languages.
Parametric statistical methods are not appropriate when using Likert scales as they violate the assumptions of use. Studies have shown that parametric statistics accommodate the violations of these assumptions and can be used without the concern of answers being invalidated [12]. Criticism of the statistical analysis may be well founded.
The Likert responses for each item were not rated equally. Only two of the six items had a central neutral response. The inclusion of a neutral response may represent neutral bias, true indecision or uncertainty. The use of an equivalent rating scale to all questions including a neutral central response would make for approximately equivalent weighting of all scales.
The use of balanced six or seven point Likert scales with more extreme anchors could reduce negative skew and the ceiling effect which was $42\%$ to $67\%$ across all items in this model. However, the purpose of the questionnaire is not the identification of high achievement but marginal or poor performance areas which can be addressed and improved. There is probably no advantage beyond a five-point Likert scale with a central neutral response if the purpose of the questionnaire is to identify suboptimal performance. High ceiling effects indicate a limited instrument range, possible response bias, and inadequate questionnaire performance [36]. The floor effect of less than $15\%$ for all items is within the recommended range [37].
Additional domains could be considered to expand the scope of assessment of the IME process. A question about the initial "Introduction" which makes the client aware of the process and improves the interpersonal relationship has value. The inclusion of a question to measure the clarity and use of "Common language" has strong merit. Doctors often use medical language with which the client may not be familiar and the subsequent response to an inquiry may be inadvertently inappropriate.
The issue of bias frequently occurs when using Likert scales. The high ceiling in the individual item scales more than likely has an element of acquiescent bias. This study has shown evidence of both underrated and exaggerated responses. If suboptimal measures are defined as a total IMESQ score less than 25 and a NSS score less than 8 (these being the first quartile), 10 (13%) respondents met these criteria. This would seem a reasonable threshold level to raise concerns.
## V. CONCLUSIONS
In conclusion, scores on the IMESQ questionnaire can be used as a measure of global satisfaction with an Independent Medical Examination. The questionnaire is valid and has good internal consistency, reliability and reproducibility. The questionnaire is not influenced by socio-demographic, general health or psychological distress. All six items represent six different domains. Where the results of the questionnaire do not meet the level of "satisfactory", the weaker aspects of the IME examination can be identified and addressed. The IMESQ fulfils the criteria of a 360-degree audit. It satisfies the requirements of the various professional bodies for Continuing Professional Development. It may, on occasions be useful evidence in medical defence of a claim relating to the IME, if the allegation is not concordant with the responses given on the questionnaire.
### Appendix
#### IMESQ
1. How good was this doctor at making you feel at ease? (polite, being friendly towards you, treating you with respect; not cold, abrupt or apparently disinterested)
- Very good
- Good
- Satisfactory
- Poor
- Very poor
2. How good was this doctor at letting you tell your "story" and listening? (paying attention, giving you time to fully describe your illness in your own words)
- Very good
- Good
- Satisfactory
- Poor
- Very poor
3. How good was the doctor at very carefully checking everything when examining you? (meticulous and thorough)
- Very good
- Good
- Satisfactory
- Poor
- Very poor
4. How confident are you that this doctor fully understanding your condition... (that he had accurately understood your concerns; not overlooking or dismissing anything)
- No, definitely not
- No, generally not
- Uncertain
- Yes, generally
- Yes, definitely
5. How good was this doctor at providing time for your consultation? (plenty of time, not rushed)
- Very good
- Good
- Satisfactory
- 。 Poor
- Very poor
6. Overall, how satisfied are you with your consultation? (Please check only one box)
- 。 Very satisfied
- Satisfied
- Neither satisfied or dissatisfied
- Dissatisfied
- Very dissatisfied
7. On a 0-to-10 NAS scale how satisfied are you with the consultation where $0 =$ absolutely dissatisfied and $10 =$ almost satisfied.
 Panel label: Very dissatisfied.
 Panel label: Very satisfied.
8. Would you be willing to be examined by this doctor again?
- 。 No
- 。 Maybe
- Yes
<table><tr><td></td><td>Frequency</td><td>% of Cases</td></tr><tr><td>Partnered</td><td>53</td><td>69.74%</td></tr><tr><td>Australian born</td><td>50</td><td>65.79%</td></tr><tr><td>Working</td><td>48</td><td>63.16%</td></tr><tr><td>Previous IME</td><td>36</td><td>47.37%</td></tr><tr><td>Male</td><td>34</td><td>44.74%</td></tr><tr><td><40yo</td><td>27</td><td>35.53%</td></tr><tr><td>Unqualified</td><td>27</td><td>35.53%</td></tr></table>
Table 2: Matrix of Inter-Item Correlations
<table><tr><td></td><td>At ease</td><td>Tell story & listening</td><td>Examination</td><td>Information exchange</td><td>Time</td><td>Satisfaction</td></tr><tr><td>At ease</td><td>1</td><td>0.70</td><td>0.72</td><td>0.58</td><td>0.72</td><td>0.57</td></tr><tr><td>Tell story & listening</td><td>0.70</td><td>1</td><td>0.80</td><td>0.59</td><td>0.76</td><td>0.69</td></tr><tr><td>Examination</td><td>0.72</td><td>0.80</td><td>1</td><td>0.59</td><td>0.67</td><td>0.55</td></tr><tr><td>Information exchange</td><td>0.58</td><td>0.59</td><td>0.59</td><td>1</td><td>0.60</td><td>0.59</td></tr><tr><td>Time</td><td>0.72</td><td>0.76</td><td>0.67</td><td>0.60</td><td>1</td><td>0.61</td></tr><tr><td>Satisfaction</td><td>0.57</td><td>0.69</td><td>0.55</td><td>0.59</td><td>0.61</td><td>1</td></tr></table>
Table 3: The Cronbach's Alpha Analysis for the Six Item IMESQ
<table><tr><td></td><td>Corrected Item-Total Correlation</td><td>Cronbach's Alpha if Item Deleted</td></tr><tr><td>At ease</td><td>0.8</td><td>0.89</td></tr><tr><td>Tell story & listening</td><td>0.81</td><td>0.89</td></tr><tr><td>Examination</td><td>0.73</td><td>0.90</td></tr><tr><td>Information exchange</td><td>0.68</td><td>0.91</td></tr><tr><td>Time</td><td>0.82</td><td>0.89</td></tr><tr><td>Satisfaction</td><td>0.72</td><td>0.90</td></tr></table>
Table 4: Data from the Principle Component Analysis Table 5: Distribution of Outliers According to Gender
<table><tr><td>Component</td><td>Total</td><td>% of variance - Eigenvalue</td><td>Accumulated%</td><td>Extraction</td><td>Component matrix - Component 1</td><td>Rotated Component Matrix - Component 1</td></tr><tr><td>1</td><td>4.24</td><td>70.64</td><td>70.64</td><td>0.76</td><td>0.87</td><td>0.87</td></tr><tr><td>2</td><td>0.52</td><td>8.67</td><td>79.31</td><td>0.77</td><td>0.88</td><td>0.88</td></tr><tr><td>3</td><td>0.47</td><td>7.86</td><td>87.16</td><td>0.67</td><td>0.82</td><td>0.82</td></tr><tr><td>4</td><td>0.37</td><td>6.09</td><td>93.25</td><td>0.6</td><td>0.78</td><td>0.78</td></tr><tr><td>5</td><td>0.23</td><td>3.8</td><td>97.05</td><td>0.79</td><td>0.89</td><td>0.89</td></tr><tr><td>6</td><td>0.18</td><td>2.95</td><td>100</td><td>0.65</td><td>0.81</td><td>0.81</td></tr></table>
<table><tr><td></td><td></td><td>Female</td><td>Male</td><td>Total</td></tr><tr><td>Under-rater</td><td>-1</td><td>0</td><td>5</td><td>5</td></tr><tr><td></td><td>0</td><td>36</td><td>26</td><td>62</td></tr><tr><td>Over-rater</td><td>1</td><td>6</td><td>3</td><td>9</td></tr><tr><td></td><td>Total</td><td>42</td><td>34</td><td>76</td></tr></table>
Table 6: Results of Dunn-Bonferroni Test for Under/Over Outliers (-1/1)
<table><tr><td></td><td>Test Statistic</td><td>Std. Error</td><td>Std. Test Statistic</td><td>p</td><td>Adj. p</td></tr><tr><td>0: -1</td><td>-22.06</td><td>8.84</td><td>-2.5</td><td>.013</td><td>.038</td></tr><tr><td>0: 1</td><td>3.27</td><td>6.78</td><td>0.48</td><td>.63</td><td>1</td></tr><tr><td>-1: 1</td><td>25.33</td><td>10.61</td><td>2.39</td><td>.017</td><td>.051</td></tr></table>
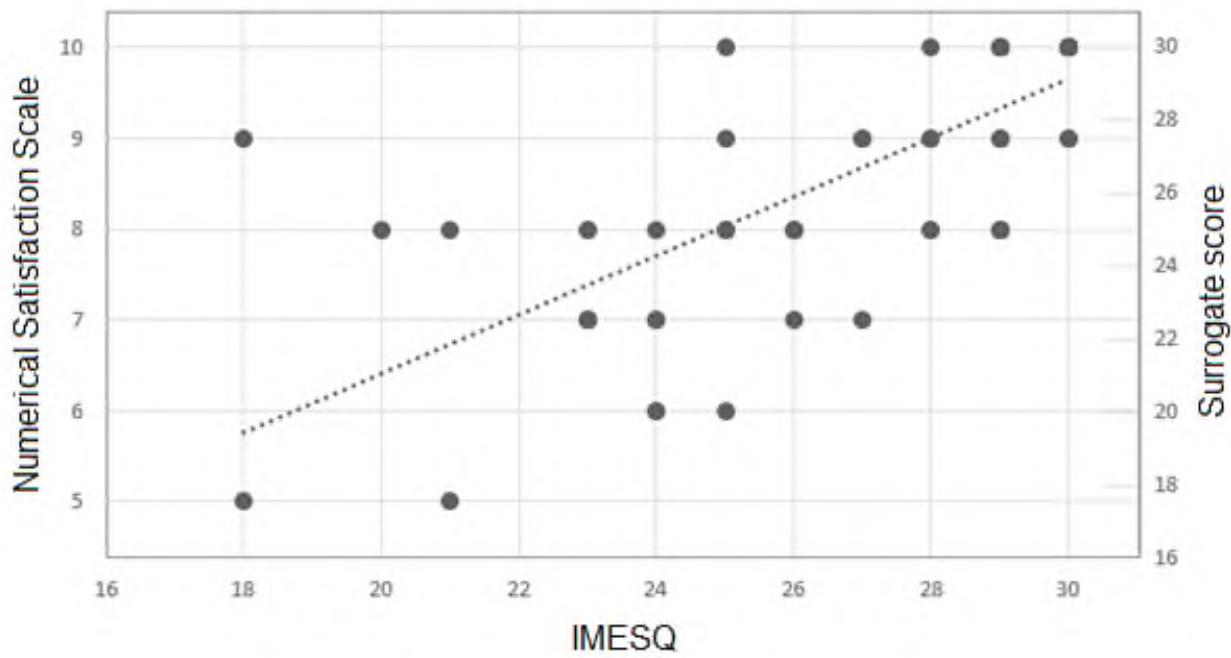 Figure 1: Composite Regression Plot of IMESQ and NSS/Surrogate Scores. For the Purpose of Interpreting Lin's CCC, the Trendline can be Compared with the "Gold Standard" (16,16 To 30,30)
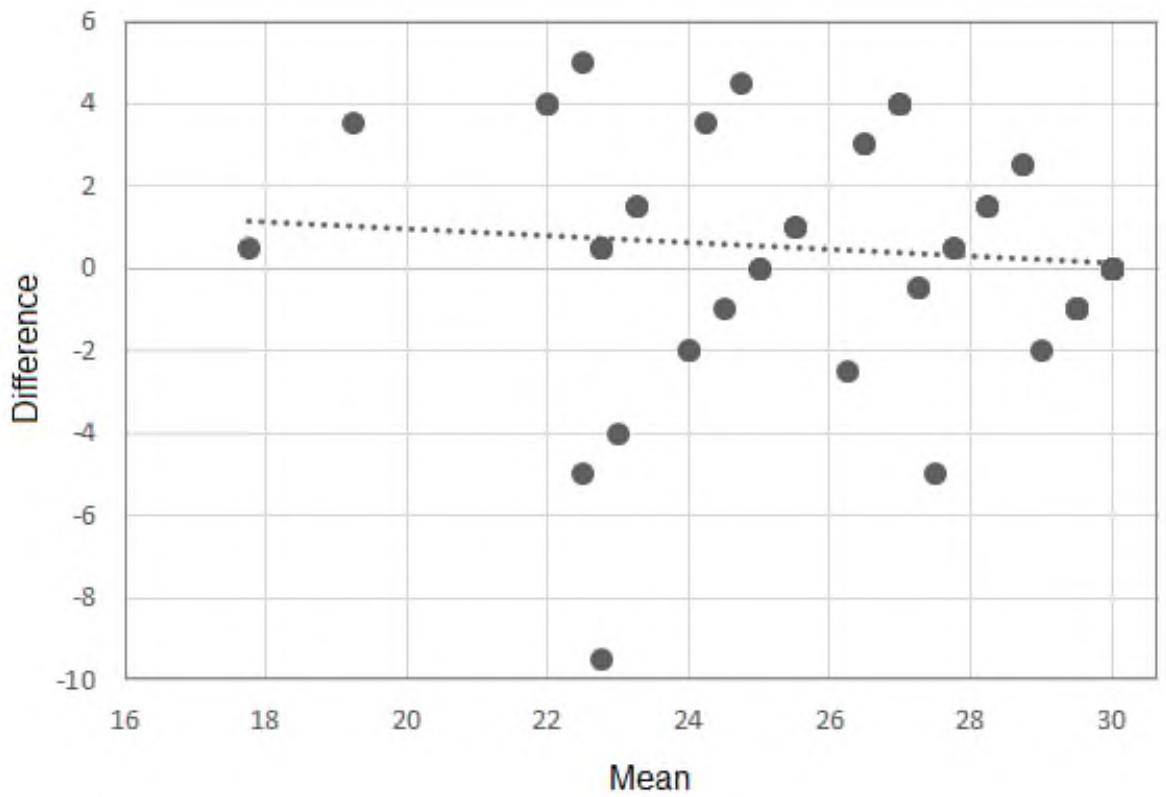 Figure 2: Bland-Altman Plot: Limits of Agreement $< -4.1$, $>4.1$; Outliers $< -2.4$, $>2.3$. The Trendline is an Index of Bias [38]
Generating HTML Viewer...
References
37 Cites in Article
Bhanu Prakash (2010). Patient satisfaction.
T Schoenfelder,J Klewer,J Kugler (2011). Determinants of patient satisfaction: a study among 39 hospitals in an in-patient setting in Germany.
L Ong,J De Haes,A Hoos,F Lammes (1982). Doctor-patient communication: A review of the literature.
Peter Nowak (2011). Synthesis of qualitative linguistic research—A pilot review integrating and generalizing findings on doctor–patient interaction.
D Loblaw,A Bezjak,T Bunston (1999). Development and testing of a visit-specific patient satisfaction questionnaire: the Princess Margaret Hospital Satisfaction with Doctor Questionnaire.
D Loblaw,Andrea Bezjak,P Singh,Andrew Gotowiec,David Joubert,Kenneth Mah,Gerald Devins (2004). Psychometric refinement of an outpatient, visit‐specific satisfaction with doctor questionnaire.
Mariët Hagedoorn,Sabine Uijl,Eric Van Sonderen,Adelita Ranchor,Brigit Grol,Renée Otter,Boudien Krol,Wim Van Den Heuvel,Robbert Sanderman (2003). Structure and Reliability of Ware’s Patient Satisfaction Questionnaire III.
Graeme Hawthorne,Jan Sansoni,Laura Hayes,Nick Marosszeky,Emily Sansoni (2014). Measuring patient satisfaction with health care treatment using the Short Assessment of Patient Satisfaction measure delivered superior and robust satisfaction estimates.
Romain-Glassey,N Gut,M Cathieni,F Hofner,M Mangin,P (2011). A satisfaction survey conducted on patients of a medico-legal consultation.
C Dancey,J Reidy,Pearson Education (2007). Statistics without Maths for Psychology.
K Parmenter,J Waller,J Wardle (2000). Demographic variation in nutrition knowledge in England.
G Norman (2010). Likert scales, levels of measurement and the "laws" of statistics.
J Nunnally,I Bernstein Psychometric theory.
P Shrout,J Fleiss (1979). Intraclass correlations: uses in assessing rater reliability.
Kenneth Mcgraw,S Wong (1996). Forming inferences about some intraclass correlation coefficients..
Terry Koo,Mae Li (2016). A Guideline of Selecting and Reporting Intraclass Correlation Coefficients for Reliability Research.
David Liljequist,Britt Elfving,Kirsti Skavberg Roaldsen (2019). Intraclass correlation – A discussion and demonstration of basic features.
Lawrence I-Kuei Lin (1989). A Concordance Correlation Coefficient to Evaluate Reproducibility.
Lawrence Lin,A Hedayat,Bikas Sinha,Min Yang (2002). Statistical Methods in Assessing Agreement.
J Bland,D Altman (1986). Statistical methods for assessing agreement between two methods of clinical measurement.
Davide Giavarina (2015). Understanding Bland Altman analysis.
Robert Kwiecien,Annette Kopp-Schneider,Maria Blettner (2011). Concordance Analysis.
Paul Gardner (1995). Measuring attitudes to science: Unidimensionality and internal consistency revisited.
Bartlett's Test Of Sphericity And CHANCE FINDINGS IN FACTOR ANALYSIS.
D Cicchetti,S Sparrow (1981). Developing criteria for establishing interrater reliability of specific items: applications to assessment of adaptive behavior.
Gregory Camilli,Lorrie Shepard (1987). The Inadequacy of ANOVA for Detecting Test Bias.
G Mcbride A proposal for strength-of-agreement criteria for Lin's Concordance Correlation Coefficient.
W Martins,C Nastri (2014). Interpreting reproducibility results for ultrasound measurements.
J Kottner,L Audigé,S Brorson,A Donner,B Gajewski,A Hróbjartsson,C Roberts,M Shoukri,D Streiner (2011). Guidelines for Reporting Reliability and Agreement Studies (GRRAS) were proposed.
C Jenkinson,A Coulter,S Bruster,N Richards,T Chandola (2002). Patients' experiences and satisfaction with health care: results of a questionnaire study of specific aspects of care.
Masahiro Andoh,Kunihiko Kobayashi,Shoji Kudoh,Fumikazu Takeda (1997). Using "Care note" to measure the level of satisfaction patients feel with their care, in palliative cancer care, as a measure of their quality of life..
E Kerr,D Smith,S Kaplan,R Hayward (2003). The association between three different measures of health status and satisfaction among patients with diabetes.
Grant Marshall,Ron Hays,Rebecca Mazel (1996). Health status and satisfaction with health care: Results from the medical outcomes study..
D Bernstein,J Houck,W Hammert (2019). A Comparison of PROMIS UE Versus PF: Correlation to PROMIS PI and Depression, Ceiling and Floor Effects, and Time to Completion.
C Terwee,S Bot,M De Boer,D Van Der Windt,D Knol,J Dekker,L Bouter,H Vet (2007). Quality criteria were proposed for measurement properties of health status questionnaires.
N Doğan (2018). Bland-Altman analysis: A paradigm to understand correlation and agreement.
No ethics committee approval was required for this article type.
Data Availability
Not applicable for this article.
How to Cite This Article
Ian Bruce McPhee. 2026. \u201cA Short Satisfaction Questionnaire for an Independent Medical Examination: A pilot study.\u201d. Global Journal of Medical Research - K: Interdisciplinary GJMR-K Volume 23 (GJMR Volume 23 Issue K4).
Explore published articles in an immersive Augmented Reality environment. Our platform converts research papers into interactive 3D books, allowing readers to view and interact with content using AR and VR compatible devices.
Your published article is automatically converted into a realistic 3D book. Flip through pages and read research papers in a more engaging and interactive format.
Our website is actively being updated, and changes may occur frequently. Please clear your browser cache if needed. For feedback or error reporting, please email [email protected]
Thank you for connecting with us. We will respond to you shortly.