This study uses primary data from a survey of 370 observations in Ho Chi Minh City, Vietnam, and adopts the Exploratory Factor Analysis, Confirmatory Factor Analysis (CFA), and Linear Regression Modeling (LRM) with Bootstrap analysis for a reliable test of LRM. Its result shows that factors affecting Seaport competitiveness included Geographical Location,
## I. INTRODUCTION
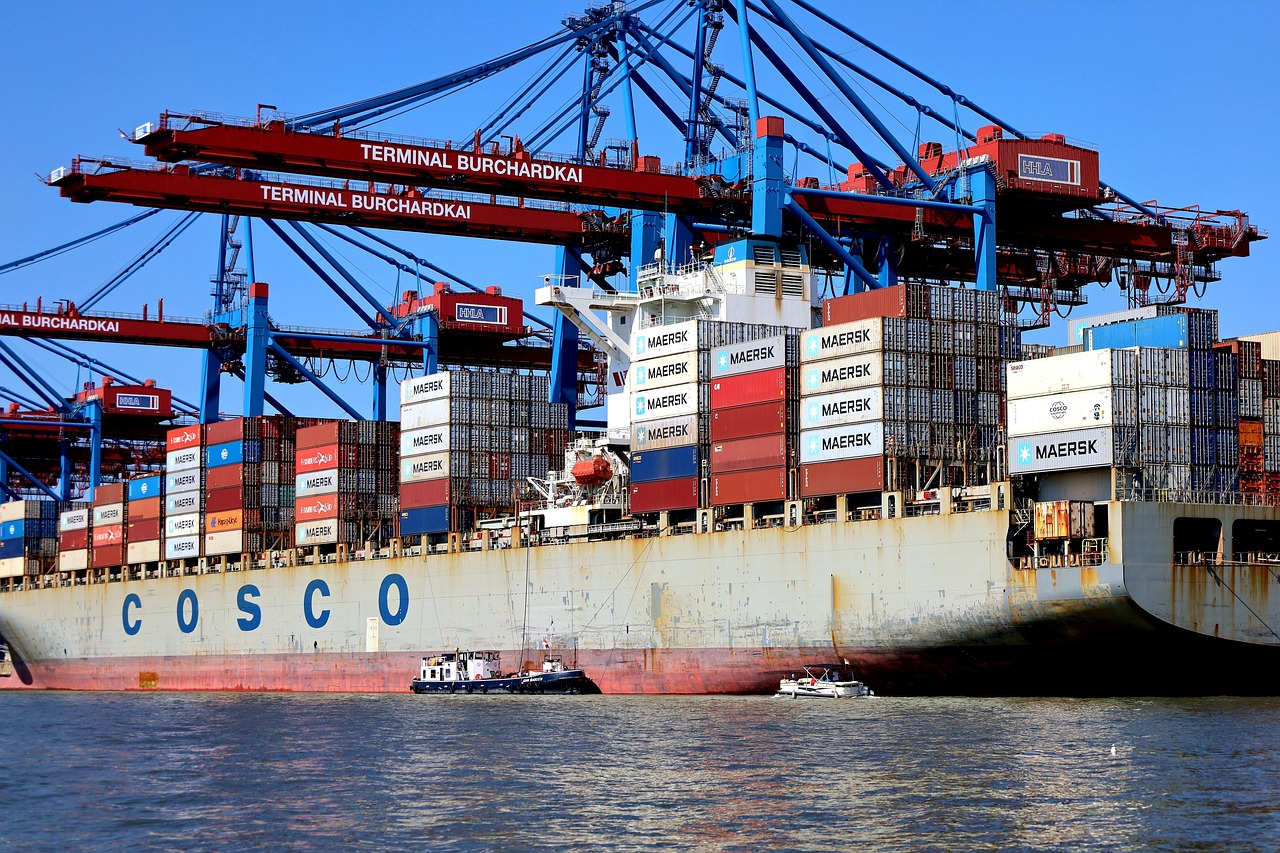
Seaport is a gateway for import and export activities, which is a transit point between sea routes and rail, road, and inland waterway networks. As a coastal country, Vietnam has nearly half of its provinces and cities with seas with a total coastline length of over 3,260 km running along the length of the country. It has a large sea area with many peninsulas, bays, and deep, sheltered bays that face the international maritime route between the Indian Ocean and the Pacific Ocean. From Vietnam's coastal ports on the East Sea, it is easy to go through the Malacca Strait to the Indian Ocean, the Middle East, Europe, Africa, etc., and through the Bashi Strait to the Pacific Ocean to ports in Japan, Russia, and America. However, the development and usage of seaport services have not been commensurate with their available potential and advantages; The seaport system is still scattered and fragmented; Transport infrastructure and industrial parks have not been developed in line with the seaport system; Its technology, equipment, and services are still outdated; Customs service quality is limited and customs clearance costs are high; Scattered investment and unreasonable structure are characterized by an excess of small ports and a lack of large ports and deep-water ports; The modernization of the seaport system is slow, so it is not qualified to receive the world's medium and large tonnage ships, etc. (Nguyen Duc Phu, 2023). This leads to the top issue for seaport development which is building their connectivity and improving their competitiveness. These are also challenges for researchers and seaport managers. This study focuses on (i) Determining the factors affecting its competitiveness; (ii) Building a quantitative model of the above relationship; and (iii) Implications for policies to improve Ho Chi Minh City seaport competitiveness. This study uses primary data from a survey of 370 observations (Seaport experts, port authority managers, managers of domestic shipping lines, and managers of foreign shipping lines) in Ho Chi Minh City to build a practical basis for modeling. Ho Chi Minh City is the economic center of Vietnam, which is adjacent to the sea with a rich river system and has the most developed seaport system in the country with 42 ports and port clusters covering a length of about $13\mathrm{km}$, which support logistics accounting for nearly $60\%$ of the South Region. Ho Chi Minh City ranks $22^{\mathrm{nd}}$ and $26^{\mathrm{th}}$ among the 50 best container ports in two consecutive years 2020 and 2021, which was awarded by the World Shipping Council 2022, a member of the International Association of Ports and Harbors (IAPH) and ASEAN Port Association (APA). Ho Chi Minh City's seaport system has a significant growth, especially the amount of goods throughput has increased steadily over the years, with more than 93 million tons in 2015, it had increased to more than 163 million tons between 2020 and 2022 (of which container goods are 7.8 and 8.11 million TEUS), a number of goods through Ho Chi Minh City seaport system is forecast for steady growth in the years to come (Vietnam Maritime Administration, 2023).
## II. LITERATURE REVIEW
1. "Industrial Cluster" Theory: According to Porter (1998), an industrial cluster is a group of companies and institutions that are geographically linked in a specific field and interconnected by their similarities and mutual support to improve their competitive advantage. The "industrial cluster" theory assumes that the inevitable requirement for enhancing the competitiveness of an economic cluster is to have industrial linkages within it. Today's seaports are not only considered a junction in the transportation chain but also a multi-industry economic cluster including post-port logistics areas (industrial parks, export processing zones, and logistics centers) and multi-modal transport (sea, railway, river, and air transport).
2. Stakeholder Theory: According to Freeman and Reed (1983), stakeholder theory refers to any group or individual that can influence or be affected by the achievement of an organization's goals. Different stakeholders have different interests, perceptions, and ideas on competitive advantages (Castro and Nielson, 2003), they find their interests without appreciating what is significant to others. Therefore, the interests of stakeholders create diverse sets of expectations, needs, and values (Harrison and John, 1994). This diversity of interests poses a potential problem where a failure to satisfy a particular stakeholder may disadvantage others due to resource scarcity and management skills (Freeman, 1984; Mahoney and Pandian, 1992). To balance the interests of different stakeholders, this theory suggests that managers should make decisions by taking into account the interests of their stakeholders (Sternberg, 2000). It recommends that modern companies must satisfy multiple stakeholders to survive in a volatile and uncertain environment (Foley, 2005). The importance of stakeholder orientation comes from several fields, with several studies showing that stakeholder orientation has a positive impact on outcomes (Clarkson, 1995; Greenley and Foxall, 1997). Stakeholder orientation is a condition for achieving the highest goals because stakeholders are not isolated from each other, the success of one stakeholder depends on the others (Polonsky, 1995). Stakeholder theory implies that all parties that are involved in the port system should be taken into account when determining seaport connectivity.
3. Institutional Theory: The institutions are sets of formal, and informal rules, regulations and norms, culture-based perceptions, and strategies of actors in an economic environment(North, 1991; DiMaggio, 1998; Scott, 2001; Strambach, 2010). Organizations can impose constraints on shared participation, limiting the degree of autonomy in decision-making and management control of other organizations (Greif, 2005; Saka-Helmhout and Geppert, 2011). Conversely, institutions also enable actors to choose how to act by removing existing barriers and facilitating access to material resources and relationships (Carney and Child, 2013). With their role in establishing ownership rights, institutions determine several aspects related to how competition between companies is shaped, thereby regulating their missions, fields, functions, and territories (Thorelli, 1986; Fligstein and Freeland, 1995). Institutions with different geographical locations have different procedures and outcomes, which emphasizes the relevance of geography in such analysis (Van der Lugt et al., 2014). With consideration to seaports, their authorities can be highly institutionalized organizations (Child et al.,
2012; Notteboom et al., 2013), which are bound by national rules and policies as well as local structures and values that influence both their behavior and outcomes (Hall, 2003; Ng, et al., 2013; Debrie et al., 2013). Consequently, port authorities themselves can be institutions for other actors, if they are authorized by governments to design regulations and standards for actors within the port's jurisdiction. They can potentially facilitate or hinder strategic options for developing connectivity in a port system. Because institutions are not always consistent, they can facilitate and hinder the strategies of actors (Rodrigues, 2013). From an organizational perspective, port authorities are territorial-bound institutions, in which distance, local agreements and costs committed to infrastructure are interconnected in determining the local institutional logic, including market participants (Notteboom et al., 2013). Some studies consider organizational connectivity as a factor that promotes innovation and new habits (Hall and Jacobs, 2010). As port operating companies acting as part of supply and transportation chains have a natural incentive to integrate networks (Carbone and De Martino, 2003; Notteboom, 2007; Song and Panayides, 2008; Veenstra et al., 2012), changes in port management with greater autonomy and governance rights are provided for port authorities. Similarly, it brings about opportunities to expand their role in shaping port products by expanding into the hinterland (Notteboom et al., 2013). Therefore, the organizational linkage between port authorities and port operators, which naturally exists in port areas, then expands into the hinterland. In this regard, the port authorities do not disrupt existing development paths but develop new capacities and operations through a process of institutional expansion. According to Wilmsmeier et al.(2014), port authorities invest in transshipment centers in the hinterland, which arise beyond their traditional jurisdiction, and the particular importance of informal networks is noted.
4. Port Geography Theory: Weigend (1956) believes that port geography includes key parts such as ports, aircraft carriers, cargo, inland, hinterland, land, and maritime spaces (Wiegmans et al., 2008). It is, therefore, necessary to study ports in the context of a network, rather than as an independent entity. Among them, geography has the most prominent meaning. An ideal port is that it has enough space for its operations and attributes of easy access, deep water, a small tidal range, and an unobstructed climate condition for the whole year. It should pay special attention to the origin and destination of goods, both incoming and outgoing goods. A port that is only a destination for incoming goods has a much narrower function and
opportunity for expansion and development than a port through which cargoes are shipped to and from. Additionally, the connectivity of the port and hinterland will be strengthened in case of their reduced distance, close relationship, and effective spatial planning. Weigend (1956) emphasizes that the effective planning and use of land have a strong influence on both port growth and function as well as that the maritime spatial planning and the growth of a port play an important role in the development of hinterland and maritime networks. The theory of port geography has been adopted by many scientists around the world to build models related to seaports (Kenyon, 1970; Hayuth, 1981; Hoyle, 2010; Ducruet, 2020).
5. Theory of Competitiveness: Porter (1990) introduced the Diamond model with new concepts and explanations about competitive advantage. Instead of focusing on cost minimization in closed economies, today's competition is dynamic and is based on innovation and the search for strategic differentiation as countries are opening up their economies. Porter argues that four interconnected factors represent the significant competitive advantages of countries in specific industries, which include conditional factors of market demand, related supporting industries, strategy, and structure along with business competition. It can be seen that, when applying the theory of competitive advantage to the seaport, the conditional factor is related to seaport facilities. The diamond model emphasizes the possible impact of a port's fundamental strengths and weaknesses on its competitive advantage, which also highlights the potential for competition and cooperation between port users and port service providers (Porter, 2000). In this case, the diamond model is a good solution for reflecting the real conditions because it realizes that port service providers can cooperate with each other and get mutual benefits while minimizing their destructive competition, thus changing the overall competitive structure of the port (Ng, 2006). However, the diamond model does not take into account the characteristics of international and multinational activities (Cartwright, 1993). Rugman and D'cruz (1993) introduced the double diamond model to demonstrate the nature of international competition in the port market. To getan international competitive advantage, the dual diamond model recommends that port managers and decision-makers establish their own national and international diamond mechanisms. This is consistent with the concept of supply and logistics chain because the weakness of any link in the chain will directly affect the performance of other links (Moon et al., 1998). To include inter-nationality as a fundamental concept of port competitiveness,
Rugman and Verbeke (1993) developed a model based on the Porter diamond model which builds local, regional, foreign, and global inventories for each corner of the diamond model. They argue that some have local competitive levels while others have an international level. The inclusion of these inventories in Porter's model formed the expanded diamond model, making it relevant to the global economy. Although Porter's model emphasizes the host country as the main factor of competitive advantage, Dunning (1997) stated that countries other than the host country could influence the competitive advantage of a company in a particular market.
The above arguments relate to this research in explaining the nature of the seaport competitiveness.
### a) Seaport Connectivity and its Competitiveness
1. Seaport connectivity: Indriastiwi et al. (2020) state that seaport connectivity is the linkage of maritime, inland, and ports. Therefore, the concept of seaport connectivity should be studied from the perspective of the entire freight transport chain and the assessment of hinterland connections (inland ports and trade) and maritime connections (Zhang et al., 2018).
2. Hinterland Connectivity: Is mainly determined by inter-modal networks from the port to the hinterland (Wang et al., 2016; Parola et al., 2017). If the smoothness of seaport-inland connections is not consistent with the maritime network, it will affect the port's competitiveness because the increasing size of ships, especially the associated emergence of distribution centers and satellite port networks, will only aggravate the bottlenecks related to port hinterland connectivity (Merk and Notteboom, 2015; Abbes, 2015).
3. Maritime Connectivity: Is the link between ports and shipping lines as well as the link between ports (Arvis et al., 2018). Among them, the link with shipping lines is the most important aspect of maritime connectivity. It is the result of the shipping line's selection of ports. It demonstrates a port's ability to handle ships of different sizes and capacities. The depth of the port, its mooring system, and its facilities play an important role in this connection. While the sea connectivity of the port is its connection to the main sea network, it needs to have efficient sea transport services. This ensures the global movement of goods between this port and other ports. For good sea connectivity, the port needs to have a good link with shipping lines.
Research by Zhang (2006) showed hinterland connectivity can affect the competitiveness of a port in an environment with many competing ports in China. Hinterland connectivity is characterized by transport corridors dedicated to seaport cargoes, such as designated railway lines connecting to ports or inland roads used by both freight trucks and local commuter cars. With research on OECD seaport cities, Olaf and Theo (2015) believes that hinterland connectivity is one of the most important factors affecting seaport competitiveness. With research on the Valencia seaport, Scaramelli (2010) states that hinterland connectivity affects seaport competitiveness. On the other hand, Hayuth (1981) believes that shipping lines are increasingly trying to control costs and coordinate their activities throughout the entire transport chain. They are seeking to lease and operate their container terminals as a priority. Ports that can meet the specific requirements of individual shipping lines and provide them with dedicated terminals will have a competitive advantage. A study of the Port of Rijeka in Croatia by Tijan et al. (2022) states that one of the important factors affecting port competitiveness is hinterland connectivity and maritime connectivity. Research on the seaport system in India, Saha (2022) stated that hinterland port development affects the improvement of seaport competitiveness. Nguyen and Woo (2022) studied the connectivity of the 10 largest container ports in Southeast Asia and found that their connectivity is confirmed to be one of the factors helping Singapore become the most competitive container port in the region. Seaport connectivity is also an important factor that helps Canadian ports promote their competitiveness (Beatriz and Alan, 2015). Seaport connectivity has a positive impact on improving competitiveness (Song and Yeo, 2004; Yeo et al., 2007; Low et al., 2009; Meersman et al., 2010; Da Cruz, 2012; Wang et al., 2016; Parola et al., 2017; Pietrzak et al., 2020; Oliwia et al., 2020). Based on empirical studies, we propose the following hypothesis:
H1: Seaport connectivity has a positive impact on its competitiveness.
### b) Other Factors Affect a Seaport's Competitiveness
Geographical Location: Plays an important role in the operations of ports. Although distance is not an absolute barrier to trade, to overcome such limitations, building an efficient multi-modal network is indispensable. Each port has a hinterland to serve. However, these hinterlands may vary subject to their distance, cost, and topography. Because freight costs are proportional to distance, a favorable geographical location will boost a port's hinterland connectivity (Pallis and Rodrigue, 2022). With research on seaport competition in Southeast Asia, Yeo (2007) shows that geographical location has a strong impact on a seaport's competitiveness. Research on Valencia port in Spain by Scaramelli (2010) shows that geographical location has a positive impact on a seaport's competitiveness. Similar results were found from the research on the global competitiveness of seaports by
Kaliszewski et al. (2020), the research on carriers' selection of seaports in Turkey by Bastuğ et al. (2022), and the research on Rijeka seaport in Croatia by Tijan et al. (2022). With the above studies, we propose the following hypothesis:
H2: Geographical location has a positive impact on a seaport's competitiveness.
Seaport Facilities: Also known as seaport utilities, are container terminals, handling equipment, trailers, container yards, information systems, multi-modal systems, and governance systems (Tongzon and Heng, 2005). In addition, they include container cranes over the length of wharves and deep-water wharves (Wang and Cullinane, 2006). With the emergence of global value chains, it is not surprising that policymakers and port managers around the world are developing strong and competitive port facilities to enhance their hinterland connectivity (Wang et al., 2016; Mohamed-Chérif and Ducruet, 2016; Calatayud et al., 2017). Rajasekar and Rengamani (2019) believe that seaport facilities are one of the extremely significant factors for hinterland connectivity. Especially, several domestic customers during the decision-making process consider adequate port facilities more important than quick response time to the needs of port users (Ugboma et al., 2006). Research on seaports in Spain by Da Cruz (2012) shows that facilities are a factor affecting a seaport's competitiveness. Comparing the competitive advantage of Karachi port with the ones of neighboring emerging countries in the Persian Gulf and Indian Ocean, Liaqait et al. (2020) discover that facilities are a decisive factor affecting a seaport's competitiveness. Similar results were found from the study of container ports in Northeast China by Wan et al. (2022) and the port systems along the "belt and road" by Liuet al. (2020), carriers' selection of seaport in Turkey by Bastug et al. (2022) and Rijeka seaport in Croatia by Tijan et al. (2022). Researching the port system in Vietnam, Ha Minh Hieu (2021) shows that infrastructure affects seaport competitiveness. With the above studies, we propose the following hypothesis:
H3: Seaport facilities have a positive impact on a seaport's competitiveness.
An Information System: Is a combination of human resources, materials, and software to collect, formalize, store, browse, link, and disseminate information within the same organization (O'Brien and Marakas, 2011). Information technology plays an essential supporting role in setting up and deploying information systems and is a catalyst for internal and external integration. According to Sweeny and Evangelista (2005), different types of Information-Communication Technologies enable a degree of external (port community) and external integration as well as the integration of internal and external port processes. Hsu and Lalwani (2010) see the deployment of information and communication technology as a tool to support international transport, with an emphasis on seaports as a focal point of a transport chain.
Reviewing the competitiveness of Agadir port in Morocco, Jouad and Hamri (2020) find that information technology is the decisive factor affecting its competitiveness. Similar results were found from the studies of regional port systems in China by Yi et al. (2021), port chain in Sub-Saharan Africa by Adabere et al. (2021), and Rijeka seaport in Croatia by Tijan et al. (2022). With the above studies, we propose the following hypothesis:
H4: Information technology has a positive impact on a seaport's competitiveness.
Port Authorities: Have become more autonomous and proactively expanded and redeveloped port infrastructure. Port authority activities can be classified into four main categories: traffic management, customer management, regional management, and stakeholder management. More active engagement of port authorities means their active coordination within the transport chain and cluster and more coordination can lead to more efficient supply chains and more competitive ports. Therefore, they have an incentive to improve their coordination within port clusters and supply chains. The active involvement of port authorities is especially suitable for inland transport, as this is quickly becoming the main bottleneck in the international door-to-door transport chain. Port authorities can contribute to effective hinterland access by investing in infrastructure and terminals within the port area, perhaps also outside the port area. They can improve hinterland access by incorporating infrastructure access rules and developing a system of port communities (De Langen, 2009). According to Van den Berg et al. (2012), port authorities recognize the importance of multi-modal transport to serve the development of seaport hinterlands and suggest policies to involve ports in multi-modal connections. Port authorities play an important role in hinterland connectivity to increase traffic flow to their ports. The port authorities also develop new inland routes to their ports. Their engagement in infrastructure investment will increase reliability and attract port users to their ports. Research on seaport connectivity in Southeast Asia by Yeo (2008) shows that port authorities are the decisive factor for a seaport's competitiveness. Research on regional port systems in China by Yi et al. (2021) discovers a positive relationship between a port authority and its port competitiveness. Similar results from the studies of Valencia seaport in Spain by Scaramelli (2010) and seaports in Indonesia by Wahyuni et al. (2019), performance of the port in Sub-Saharan Africa by Adabere et al. (2021), carriers' selection of seaports in Turkey by Bastug et al. (2022); Rijeka seaport in Croatia by Tijan et al. (2022) and Chittagong seaport in Bangladesh show that port authorities are the decisive factor for a seaport's competitiveness (Munim et al., 2022). With the above studies, we propose the following hypothesis:
H5: Port authorities have a positive impact on a seaport's competitiveness.
Corporate Reputation: Can be defined by several attributes that shape buyers' perceptions of whether a company is known, good or bad, trustworthy, reputable, or not (Levitt, 1965). The reputation of a company refers to how people perceive it based on any information (or misinformation) they have about its activities, work environment, and performance in terms of past and future (Fombrun et al., 2000). The reputation of seaports (as measured by the Fortune Reputation Index) influences shippers' expectations of close relationships with specific ports and acts as a moderator of the customer's trust in suppliers. It also constitutes a moderator of the effects of trust on commitment and investments, and the adaptation of business systems to specific relationships. In addition, it is characterized by the fact that the supplier always adjusts its behavior to adapt to new customer requirements, and it affects seaport competitiveness (Bennett and Gabriel, 2001). Research on the port of Valencia, Spain by Scaramelli (2010) shows that the port's reputation is the decisive factor for its competitiveness. A study of container port systems in West Africa by Meersman et al. (2010) discovered a positive relationship between port reputation and its competitiveness. Similar results were found from the studies of seaports in Zachodniopomorskie Voivodeship, Poland by Pietrzak et al. (2020) and Rijeka seaport in Croatia by Tjan et al. (2022). Thus, a port's reputation affects its attractiveness to customers and is closely linked to the extent to which a mechanism ensures fair competition between different entities in ports (Bennett and Gabriel, 2001). Therefore, it is related to preventing anti-competitive practices that often takes much time in exclusive ports. The environmentally friendly operations of a port and its reputation have become more and more important for its competitiveness (Lam and Notteboom 2014; Lun, 2011). With the above studies, we propose the following hypothesis:
H6: The reputation of a seaport has a positive impact on its competitiveness.
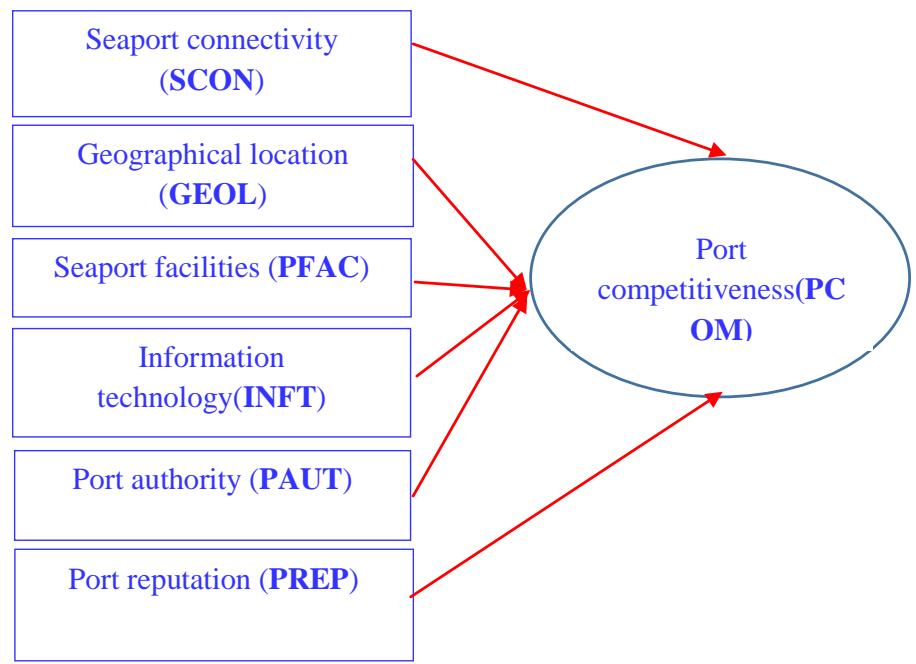
## III. RESEARCH MODEL
 Figure 1: Theoretical Modeling
It is required to have a theoretical assessment and empirical study for further research to expand this theory and provide more empirical evidence and policy implications related to improving seaport competitiveness. Previous studies highlighted the factors that impact seaport connectivity with qualitative analysis or measurement of relationships using quantitative models such as statistical testing, or separate regression models, but did not provide a complete basis for a comprehensive analytical framework on seaport competitiveness. Therefore, the purpose of this study is to extend the findings from previous ones and integrate analysis of their correlation into an exploratory factor analysis and linear regression modeling. The research teams selected a case to study seaport competitiveness in Ho Chi Minh City Port as shown in Figure 1.
## IV. METHODOLOGY
Measurement: All scales are modified from previous studies to fit the research context in Vietnam. We designed a three-step process for the survey. First, we carried out a survey using the expertise method of discussing with 10 port experts with at least five years of experience working at agencies related to the port industry. They are leaders of departments and agencies in Ho Chinh Minh to refer to measuring scales and observation variables that are suitable for the Port Logistics industry. Second, a pilot survey with 10 managers of import and export companies and 10 managers of shipping lines in Ho Chi Minh City to verify if there were any errors in the questionnaire. The sample was selected based on the respondents' willingness to participate in this study. Third, a complete survey was conducted for seaport researchers (20 people), port authority managers (30 people), managers (225 people) of domestic shipping lines, and managers (225 people) of foreign shipping lines whose ships docked at Ho Chi Minh City port. They all had experience in handling cargoes in Ho Chi Minh City seaport. A general of four hundred respondents stuffed out the questionnaire.
A five-point Likert scales starting from "strongly disagree" to "strongly agree" were used to measure all observation variables. To measure the "Seaport connectivity" scale, 4 observation variables were included in the questionnaire. This scale is mainly based on research on the performance of the ports in Barcelona, Marseilles Egypt, and Morocco by Arvis et al. (2018), and research on seaports in Portugal by Da Cruz (2012). For "Geography", 4 observation variables were included in the questionnaire. It was mainly based on research on the performance of the ports in Vietnam by Ha Minh Hieu (2020). For "Seaport facilities", 4 observation variables are included in the questionnaire. It is mainly based on research on the ability to attract customers at Chittagong Port, Bangladesh by Munim et al. (2022). For "Information Technology", 4 observation variables were included in the questionnaire. It was mainly based on research on the port system in Chennai, India by Rajasekar and Rengamani (2019). For "Port Authority", 4 observation variables were included in the questionnaire. It was mainly based on research on port networks by De Langen and Sharapova (2013) and it was adjusted to suit the Vietnamese situation and had several new observation variables built by the authors from the expertise discussion results such as "Port authority can actively participate in investment projects for highway and barge terminals outside their port area"; "Port authority builds a port community information system to allow an effective communication between companies, contributing to the coordination of the transport chain. "For "Seaport reputation", 4 observation variables were included. It was mainly based on research on the Chittagong port network in Korea by Yeo et al. (2015), and it changed into adjusted to fit the Vietnamese situations and had numerous new commentary variables constructed via way of means of the authors from the effects of professional discussions such as "The port we are using has very good relationships with famous ports in the world"; "The port we are always using emphasizes responsibility for the environment and attracting tourists to Ho Chi Minh City." For "competitiveness", 4 observations were included in the questionnaire. It was mainly based on research on port connectivity and competition by Da Cruz (2012) and had several new observation variables built by the authors from the results of expert discussions such as "Annual share growth of the port against the adjacent region/country"; "Dynamic changes of cooperation policies based on economic fluctuations around the world and increasing revenue." Details of the scales are in the Appendix (Table A).
Data Collection and Processing: We launched a survey in Ho Chinh Minh City with 400 questionnaires. This survey lasted from February to May 2023. After data processing, 370 reliable observations were used for data analysis.
According to Fontaine (2005), the exploratory factor analysis modeling was performed in 4 steps: Reliability test of scale; Exploratory Factor Analysis (EFA); Confirmatory Factor Analysis (CFA), and Multiple variable regression. Data analysis was performed on SPSS and AMOS software version 21.0.
## V. RESULTS
### a) Descriptions of Survey Subjects
Table 1 showed the details of the questionnaire. Results showed that $80\%$ were men. The ages were distributed across three groups: under 30, 31-45, 46-55, and over 55 with $20\%$, $55\%$, $16\%$, and $9\%$, respectively. Also, education levels in four groups: Highschool, College & University, Postgraduate, and Other, are $25\%$, $56\%$, $12\%$, and $8\%$, respectively. Occupation with four groups: Managers of domestic transport enterprises, Managers of foreign transport enterprises, Port authority officials, and Seaport experts are $54\%$, $32\%$, $8\%$, and $6\%$, respectively. The majority of survey objects is married $(64\%)$. The income of 30-50 million VND per month accounts for mainly $(70\%)$.
Table 1: Characteristics of Survey Subjects
<table><tr><td></td><td>Frequency</td><td>%</td><td></td><td>Frequency</td><td>%</td></tr><tr><td>Gender</td><td></td><td></td><td>Income</td><td></td><td></td></tr><tr><td>Male</td><td>295</td><td>80</td><td><30</td><td>65</td><td>18</td></tr><tr><td>Female</td><td>75</td><td>20</td><td>30-40</td><td>132</td><td>36</td></tr><tr><td>Total</td><td>370</td><td>100</td><td>41-50</td><td>124</td><td>34</td></tr><tr><td>Ages</td><td></td><td></td><td>>50</td><td>49</td><td>13</td></tr><tr><td><30</td><td>73</td><td>20</td><td>Total</td><td>370</td><td>100</td></tr><tr><td>31-45</td><td>203</td><td>55</td><td>Occupation</td><td></td><td></td></tr><tr><td>46-55</td><td>60</td><td>16</td><td>Managers of domestic transport enterprises</td><td>200</td><td>54</td></tr><tr><td>>55</td><td>34</td><td>9</td><td>Managers of foreign transport enterprises</td><td>120</td><td>32</td></tr><tr><td>Total</td><td>370</td><td>100</td><td>Port authority officials</td><td>30</td><td>8</td></tr><tr><td colspan="2">Education level</td><td></td><td>Seaport expert</td><td>20</td><td>6</td></tr><tr><td>Posgraduate</td><td>44</td><td>12</td><td>Total</td><td>370</td><td>100</td></tr><tr><td>Highschool</td><td>92</td><td>25</td><td>Marital status</td><td></td><td></td></tr><tr><td>College & university</td><td>206</td><td>56</td><td>Single</td><td>135</td><td>37</td></tr><tr><td>Other</td><td>28</td><td>8</td><td>Married</td><td>235</td><td>64</td></tr><tr><td>Total</td><td>370</td><td>100</td><td>Total</td><td>370</td><td>100</td></tr></table>
### b) Reliability Analysis
Table 2: Scale Reliability Test and Rejected Observed Variables
<table><tr><td>No.</td><td>Scale</td><td>Observed Variable are Excluded</td><td>Alpha Coefficients</td><td>Conclusion</td></tr><tr><td>1</td><td>SCON</td><td>None</td><td>0.859</td><td>Good quality</td></tr><tr><td>2</td><td>GEOL</td><td>None</td><td>0.809</td><td>Good quality</td></tr><tr><td>3</td><td>PFAC</td><td>None</td><td>0.867</td><td>Good quality</td></tr><tr><td>4</td><td>INFT</td><td>None</td><td>0.848</td><td>Good quality</td></tr><tr><td>5</td><td>PAUT</td><td>None</td><td>0.851</td><td>Good quality</td></tr><tr><td>6</td><td>PREP</td><td>None</td><td>0.843</td><td>Good quality</td></tr><tr><td>7</td><td>PCOM</td><td>None</td><td>0.844</td><td>Good quality</td></tr></table>
The results in Table 2 showed that: The observed variables all satisfy the conditions in the reliability analysis of the scale through an alpha coefficient $>0.6$, and a variable-total correlation $>0.3$ (Nunnally and Burnstein, 1994).
### c) Exploratory Factor Analysis
Table 3: Pattern Matrix
<table><tr><td></td><td colspan="7">Component</td></tr><tr><td></td><td>1</td><td>2</td><td>3</td><td>4</td><td>5</td><td>6</td><td>7</td></tr><tr><td>INFT1</td><td>0.815</td><td></td><td></td><td></td><td></td><td></td><td></td></tr><tr><td>INFT3</td><td>0.788</td><td></td><td></td><td></td><td></td><td></td><td></td></tr><tr><td>INFT2</td><td>0.764</td><td></td><td></td><td></td><td></td><td></td><td></td></tr><tr><td>INFT4</td><td>0.752</td><td></td><td></td><td></td><td></td><td></td><td></td></tr><tr><td>PFAC2</td><td></td><td>0.878</td><td></td><td></td><td></td><td></td><td></td></tr><tr><td>PFAC3</td><td></td><td>0.869</td><td></td><td></td><td></td><td></td><td></td></tr><tr><td>PFAC1</td><td></td><td>0.858</td><td></td><td></td><td></td><td></td><td></td></tr><tr><td>PFAC4</td><td></td><td>0.771</td><td></td><td></td><td></td><td></td><td></td></tr><tr><td>SCON2</td><td></td><td></td><td>0.855</td><td></td><td></td><td></td><td></td></tr><tr><td>SCON3</td><td></td><td></td><td>0.811</td><td></td><td></td><td></td><td></td></tr><tr><td>SCON4</td><td></td><td></td><td>0.791</td><td></td><td></td><td></td><td></td></tr><tr><td>SCON1</td><td></td><td></td><td>0.749</td><td></td><td></td><td></td><td></td></tr><tr><td>PAUT3</td><td></td><td></td><td></td><td>0.860</td><td></td><td></td><td></td></tr><tr><td>PAUT2</td><td></td><td></td><td></td><td>0.825</td><td></td><td></td><td></td></tr><tr><td>PAUT1</td><td></td><td></td><td></td><td>0.818</td><td></td><td></td><td></td></tr><tr><td>PAUT4</td><td></td><td></td><td></td><td>0.816</td><td></td><td></td><td></td></tr><tr><td>PREP4</td><td></td><td></td><td></td><td></td><td>0.836</td><td></td><td></td></tr><tr><td>PREP1</td><td></td><td></td><td></td><td></td><td>0.811</td><td></td><td></td></tr><tr><td>PREP2</td><td></td><td></td><td></td><td></td><td>0.807</td><td></td><td></td></tr><tr><td>PREP3</td><td></td><td></td><td></td><td></td><td>0.797</td><td></td><td></td></tr><tr><td>GEOL4</td><td></td><td></td><td></td><td></td><td></td><td>0.791</td><td></td></tr><tr><td>GEOL2</td><td></td><td></td><td></td><td></td><td></td><td>0.756</td><td></td></tr><tr><td>GEOL1</td><td></td><td></td><td></td><td></td><td></td><td>0.742</td><td></td></tr><tr><td>GEOL3</td><td></td><td></td><td></td><td></td><td></td><td>0.715</td><td></td></tr><tr><td>PCOM1</td><td></td><td></td><td></td><td></td><td></td><td></td><td>0.886</td></tr><tr><td>PCOM2</td><td></td><td></td><td></td><td></td><td></td><td></td><td>0.878</td></tr><tr><td>PCOM3</td><td></td><td></td><td></td><td></td><td></td><td></td><td>0.856</td></tr><tr><td colspan="6">Kaiser-Meyer-Olkin Measure</td><td>0.827</td><td>0.725</td></tr><tr><td colspan="6">Bartlett's test</td><td>0.000</td><td>0.000</td></tr><tr><td colspan="6">Eigen values</td><td>1.375</td><td>2.289</td></tr><tr><td colspan="6">% of Extracted variance</td><td>69.773</td><td>76.285</td></tr></table>

Table 4 shows that the factors of PCOM are extracted into six factors corresponding to the measured variables of the theoretical model. The total variance extracted is $69.773\%$ at an Eigenvalue of 1.375; EFA of PCOM is extracted into three observed variables with an extracted variance of $76.285\%$ at an Eigenvalue of 2.289; and the Varimax rotation method used.
### d) Confirmatory Factor Analysis
Confirmatory factor analysis aims to test the theoretical measurement model in accordance with practical data (Thompson, 2004).
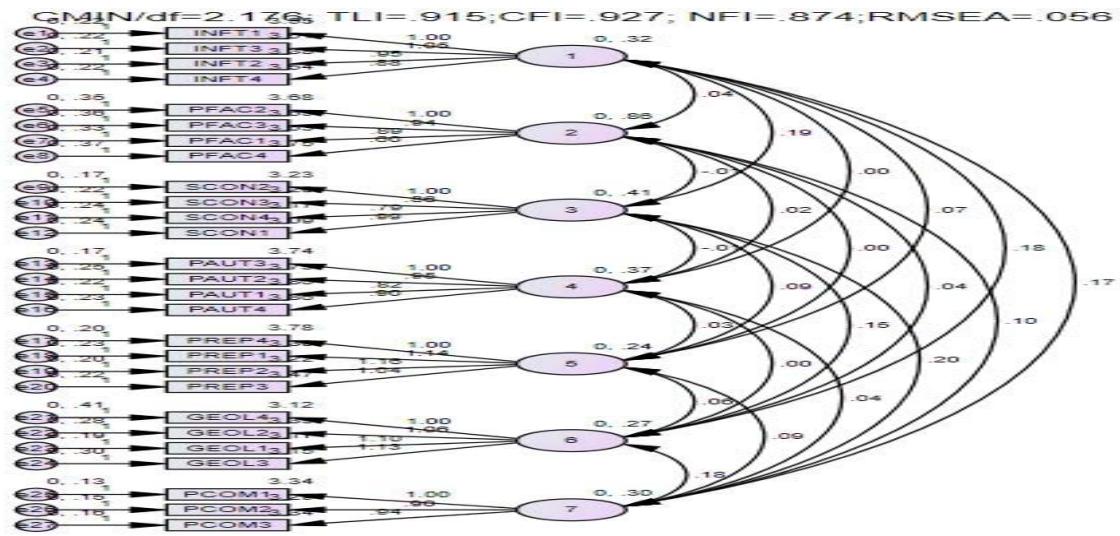 Figure 2: Confirmatory Factor Analysis
Table 4: The Fit Indices of the CFA
<table><tr><th>No.</th><th>Measures</th><th>Indicator Standard Values</th><th>Model Value</th><th>Results</th></tr><tr><td>1</td><td>Cmin/df</td><td>\chi^2/\mathrm{d.f.} < 3 \text{goodfit}; < 5 \text{accepted}; the smaller the better (Bentler and Bonett, 1980; Bagozii and Jy, 1988)</td><td>2.176</td><td>Good</td></tr><tr><td>2</td><td>TLI (Tucker-Lewis Index)</td><td>TLI: the closer it is to 1, the more appropriate; TLI > 0.90 is consistent; TLI \geq 0.95 is in good agreement (Hu and Bentler, 1995)</td><td>0.915</td><td>Good</td></tr><tr><td>3</td><td>CFI (Comparative Fit Index)</td><td>CFI > 0.90; 0 < CFI < 1, the closer to 1, the more suitable (Hu and Bentler, 1995).</td><td>0.927</td><td>Good</td></tr><tr><td>4</td><td>NFI (Normal Fit Index)</td><td>NFI, the closer it is to 1, the more suitable; NFI close to 0.90 is accepted; NFI > 0.95 is, a good fit (Chin and Todd, 1995; Hu & Bentler, 1995)</td><td>0.874</td><td>Accepted</td></tr><tr><td>5</td><td>RMSEA (Root Mean Square Error Approximation)</td><td>RMSEA < 0.05, the model fits well; RMSEA < 0.08, accepted; the smaller the better (Browne and Cudeck, 1993)</td><td>0.056</td><td>Good</td></tr></table>
### f) Regression Analysis Results
Table 5: Coefficients
<table><tr><td></td><td colspan="2">Unstandardized Coefficients</td><td>Stand. Coefficients</td><td>t</td><td>Sig.</td><td colspan="2">95.0% Confidence Interval for B</td><td colspan="2">Collinearity Statistics</td></tr><tr><td></td><td>B</td><td>Std. Error</td><td>Beta</td><td></td><td></td><td>Lower Bound</td><td>Upper Bound</td><td>Tolerance</td><td>VIF</td></tr><tr><td>(Constant)</td><td>-0.002</td><td>0.238</td><td></td><td>-0.009</td><td>0.993</td><td>-0.470</td><td>0.465</td><td></td><td></td></tr><tr><td>SCON</td><td>0.241</td><td>0.040</td><td>0.268</td><td>6.008</td><td>0.000</td><td>0.162</td><td>0.320</td><td>0.756</td><td>1.323</td></tr><tr><td>GEOL</td><td>0.297</td><td>0.042</td><td>0.326</td><td>7.090</td><td>0.000</td><td>0.215</td><td>0.380</td><td>0.716</td><td>1.397</td></tr><tr><td>PFAC</td><td>0.099</td><td>0.026</td><td>0.148</td><td>3.789</td><td>0.000</td><td>0.047</td><td>0.150</td><td>0.990</td><td>1.010</td></tr><tr><td>INFT</td><td>0.154</td><td>0.045</td><td>0.163</td><td>3.419</td><td>0.001</td><td>0.065</td><td>0.243</td><td>0.667</td><td>1.500</td></tr><tr><td>PAUT</td><td>0.083</td><td>0.036</td><td>0.089</td><td>2.296</td><td>0.022</td><td>0.012</td><td>0.155</td><td>0.995</td><td>1.005</td></tr><tr><td>PREP</td><td>0.113</td><td>0.040</td><td>0.117</td><td>2.870</td><td>0.004</td><td>0.036</td><td>0.191</td><td>0.915</td><td>1.092</td></tr></table>
#### Dependent Variable:PCOM
In Table 5, with the t-student test, the independent variables have a statistically significant correlation with the PCOM dependent variable with the significance level $\leq 0.05$ (Green, 1991); Other tests include: adjusted $R^2$: 0.598, model interpretation level
59.8% (Hair et al., 2006); ANOVA: Sig. = 0.000, the regression model is suitable (Hair et al., 2006); VIF < 10, no collinearity; $1 < d = 2,069 < 3$, no autocorrelation (Belsley et al., 1980). The study applied Park test to consider the stability of residual variance (Park, 1966).
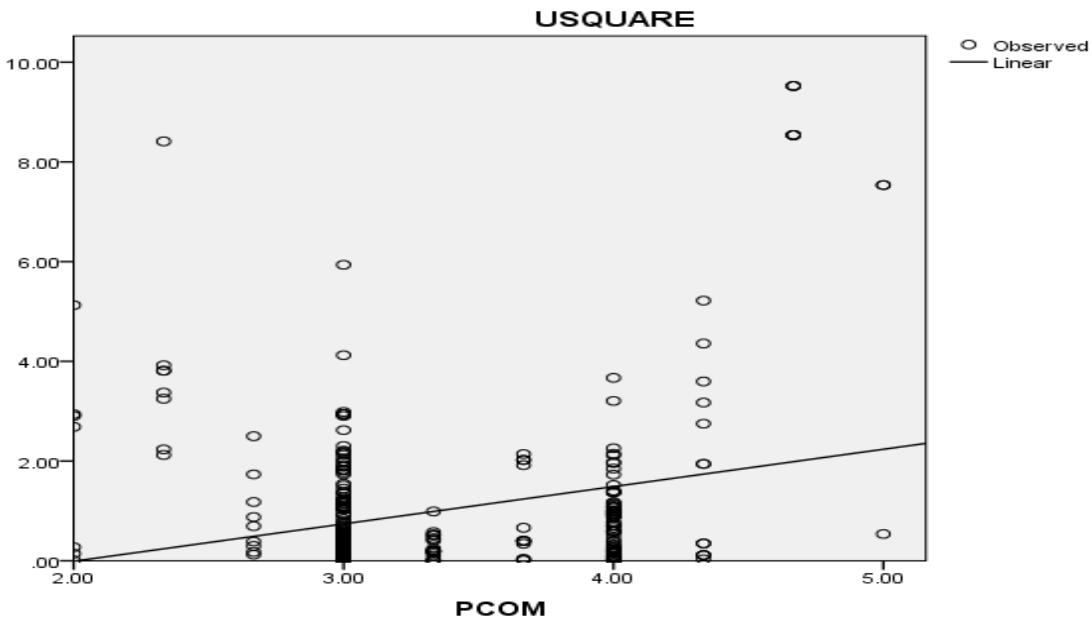 Figure 3: Park Test In Figure 3, the correlation curve is linear, with constant residual variance.
Conclusion: Through 6 tests, factors affecting port competitiveness: SCON, GEOL, PFAC, INFT, PAUT, and PREP'
Table 5: Hypothetical Results
<table><tr><td>Hypothesis</td><td>Impact</td><td></td><td></td><td>Beta</td><td>Sig.</td><td>%</td><td>Position</td><td>Decision</td></tr><tr><td>H1</td><td>PCOM</td><td><---</td><td>SCON</td><td>0.268</td><td>0.000</td><td>24.1</td><td>2</td><td>Accepted</td></tr><tr><td>H2</td><td>PCOM</td><td><---</td><td>GEOL</td><td>0.326</td><td>0.000</td><td>29.3</td><td>1</td><td>Accepted</td></tr><tr><td>H3</td><td>PCOM</td><td><---</td><td>PFAC</td><td>0.148</td><td>0.000</td><td>13.3</td><td>4</td><td>Accepted</td></tr><tr><td>H4</td><td>PCOM</td><td><---</td><td>INFT</td><td>0.163</td><td>0.001</td><td>14.7</td><td>3</td><td>Accepted</td></tr><tr><td>H5</td><td>PCOM</td><td><---</td><td>PAUT</td><td>0.089</td><td>0.022</td><td>8.0</td><td>6</td><td>Accepted</td></tr><tr><td>H6</td><td>PCOM</td><td><---</td><td>PREP</td><td>0.117</td><td>0.004</td><td>10.5</td><td>5</td><td>Accepted</td></tr><tr><td></td><td>Total</td><td></td><td></td><td>1.111</td><td></td><td>100</td><td></td><td></td></tr></table>
The results presented in Table 5 show that all hypotheses are accepted at a confidence level of over $95\%$. Based on the standardized regression coefficient, Beta (Norusis, 1993), factors affecting port competitiveness in order of influence: GEOL (Geographical location), SCON (Seaport connection), INFT (Information technology), PFAC (Seaport facilities), PREP (Port reputation), and PAUT (Port Authority).
### g) Using BOOTSTRAP to Analyze the Reliability of LRM Results
Methods of CFA often require large samples (Anderson and Gerbing, 1988), whereas academic research is often limited in sample size. Bootstrap is a suitable alternative (Schumacker and Lomax, 2010). Bootstrap is an alternative, repeatable sampling method in which the original sample acts as a population. The Bootstrap method generates random samples from the original sample, which has numerous observations, often choosing 1,000 observations. The estimated results from N samples are averaged, and this value tends to be close to the estimate of the population. The smaller the difference between the average value of Bootstrap regression coefficients and the model estimate with the original sample, the more reliably the model estimates can be concluded.
Table 6: Bootstrap Implementation Results
<table><tr><td colspan="3">Parameter</td><td>SE</td><td>SE-SE</td><td>Mean</td><td>Bias</td><td>SE-Bias</td><td>CR</td></tr><tr><td>PCOM</td><td><---</td><td>PFAC</td><td>0.053</td><td>0.001</td><td>0.179</td><td>0.004</td><td>0.002</td><td>2.0</td></tr><tr><td>PCOM</td><td><---</td><td>INFT</td><td>0.033</td><td>0.001</td><td>0.098</td><td>0.001</td><td>0.001</td><td>1.0</td></tr><tr><td>PCOM</td><td><---</td><td>SCON</td><td>0.044</td><td>0.001</td><td>0.261</td><td>-0.001</td><td>0.001</td><td>-1.0</td></tr><tr><td>PCOM</td><td><---</td><td>PAUT</td><td>0.051</td><td>0.001</td><td>0.099</td><td>0.001</td><td>0.002</td><td>0.5</td></tr><tr><td>PCOM</td><td><---</td><td>PREP</td><td>0.063</td><td>0.001</td><td>0.152</td><td>-0.004</td><td>0.002</td><td>-2.0</td></tr><tr><td>PCOM</td><td><---</td><td>GEOL</td><td>0.056</td><td>0.001</td><td>0.394</td><td>-0.002</td><td>0.002</td><td>-1.0</td></tr></table>
The absolute value of CR is less than or equal to 2, so it can be said that the bias is very small, the difference is not statistically significant at the $95\%$ confidence level (Hair et al., 2006). Regression coefficient results before Bootstrap are reliable with a confidence level greater or equal to $95\%$.
Table 6 shows regression coefficient results before Bootstrap was reliable.
## VI. DISCUSSION AND POLICY IMPLICATIONS
Our study has identified 6 factors affecting "Competitiveness" and we sort them in descending significance order as follows: Geographic location; Seaport connectivity; Information technology; Seaport facilities; Port reputation; and Port Authority. This result is consistent with previous research on the port industry in the Bay of Bengal by the Indian Ocean, Croatia by Tijan et al. (2022), Turkey by Băşuğ et al. (2022), China by Yi et al. (2021) and Poland by Pietrzak et al. (2020).
We add new observation variables to the research on seaport competitiveness, specifically "Port authorities are proactively involved in investment projects of highway terminals and barge terminals outside their port area"; "Port authorities build a port community information system to allow effective communication between companies, contributing to the coordination of the transport chain"; "The port we are using has very good relationships with famous ports in the world"; "The port we are always using emphasizes responsibility for the environment and attracting tourists to Ho Chi Minh City"; "Annual share growth of the port against the adjacent region/country"; "Dynamic changes of cooperation policies based on economic fluctuations around the world and increasing revenue."
To improve the competitiveness of Ho Chi Minh City Port, it is necessary to pay attention to 6 factors: Geographic location, Seaport connection, Information technology, Seaport facilities, Reputation and Port authority. In particular, geographical location has the strongest and most obvious impact on competitiveness. This is beyond the capacity of the Port Authority, but requires Government's involvement in developing the road network from seaports to import-export industrial parks, linked ports, and central transit centers. This is also a key factor for the development and capacity improvement of Ho Chi Minh City seaport.
## VII. CONCLUSIONS AND RESEARCH LIMITATIONS
The current study aims to extend the theoretical framework and to provide evidence in empirical results that 6 factors impact port competitiveness, illustrated by the case of Ho Chi Minh City.
The findings highlight the geographical location has the strongest and most significant impact on competitiveness. Hence, this study provides some insights into the current research about factors affecting competitiveness.
Besides its significant contributions, this study has some some limitations. First, the subjects were drawn from only one city in Vietnam, which limits the external validity of this study. Future study should apply similar methods to cases of other sea ports, and to make comparisons to enhance the power of the findings. Finally, this study focuses on the 6 factors. Future studies can examine the effect of other factors on port competitiveness in Vietnam.
### APPENDIX
Table A: Measurement Scale and Observed Variables
<table><tr><td>No.</td><td>Scales and Observed Variables</td><td>Code</td></tr><tr><td>I</td><td>Geographical Location</td><td>GEOL</td></tr><tr><td>1</td><td>The port is located near industrial parks and export processing zones</td><td>GEOL1</td></tr><tr><td>2</td><td>The port is located near central transshipment ports</td><td>GEOL2</td></tr><tr><td>3</td><td>The port is located near main transportation routes</td><td>GEOL3</td></tr><tr><td>4</td><td>The port is located close to other linked ports, including depots</td><td>GEOL4</td></tr><tr><td>II</td><td>Information Technology</td><td>INFT</td></tr><tr><td>5</td><td>IT at the port is well connected to ensure communication between the Port and customers and public agencies (Customs, port authorities, border guards, quarantine...), as well as other port users.</td><td>INFT1</td></tr><tr><td>6</td><td>The port has an integrated online payment system</td><td>INFT2</td></tr><tr><td>7</td><td>The port has a developed IT system to manage and operate the port, using software to plan and arrange the use of wharves, yards, equipment, human resources and manage all container loading and unloading work.</td><td>INFT3</td></tr><tr><td>8</td><td>The availability of electronic procedures allows for faster operations.</td><td>INFT4</td></tr><tr><td>III</td><td>Seaport Facilities</td><td>PFAC</td></tr><tr><td>9</td><td>Adequacy and safety of storage facilities (storage spaces, warehouses, liquid cargo tanks...) and container loading yards.</td><td>PFAC1</td></tr><tr><td>10</td><td>Appropriate draft and port depth</td><td>PFAC2</td></tr><tr><td>11</td><td>Docking station, wharf with complete and modern loading and unloading facilities</td><td>PFAC3</td></tr><tr><td>12</td><td>Internal and inter-regional transport infrastructure is well planned and neatly arranged</td><td>PFAC4</td></tr><tr><td>IV</td><td>Port Authority</td><td>PAUT</td></tr><tr><td>13</td><td>PAUT establishes infrastructure access rules that can improve the efficient use of infrastructure.</td><td>PAUT1</td></tr><tr><td>14</td><td>PAUT establishes infrastructure access rules that can improve the efficient use of infrastructure.</td><td>PAUT2</td></tr><tr><td>15</td><td>PAUT builds a port community information system to help exchange data between companies effectively, contributing to the coordination of the transportation chain.</td><td>PAUT3</td></tr><tr><td>16</td><td>PAUT is decided on the concession of port infrastructure exploitation</td><td>PAUT4</td></tr><tr><td>V</td><td>Port Reputation</td><td>PREP</td></tr><tr><td>17</td><td>The port we are using is very reputable for its reliability in the Asian market</td><td>PREP1</td></tr><tr><td>18</td><td>The port we are using has very good relationships with famous ports in the world</td><td>PREP2</td></tr><tr><td>19</td><td>The port we are using has good operating procedures and ensures labor safety</td><td>PREP3</td></tr><tr><td>20</td><td>The port we are using always emphasizes being responsible for the environment and attracting tourists to Ho Chi Minh City (The most famous city in Vietnam).</td><td>PREP4</td></tr><tr><td>VI</td><td>Seaport Connection</td><td>SCON</td></tr><tr><td>21</td><td>Goods/containers enter and exit the inland through the port.</td><td>SCON1</td></tr><tr><td>22</td><td>Ships of large size and tonnage often call at the port</td><td>SCON2</td></tr><tr><td>23</td><td>The number of shipping services (Including the number of transshipment and direct maritime shipments) has increased rapidly over the years</td><td>SCON3</td></tr><tr><td>24</td><td>Many destination ports are connected and the cost of transporting goods from the departure port to the destination port is reasonable</td><td>SCON4</td></tr><tr><td>VII</td><td>Seaport Competitiveness</td><td>PCOM</td></tr><tr><td>25</td><td>The volume of goods through the port increases every year</td><td>PCOM1</td></tr><tr><td>26</td><td>The port's market share compared to the adjacent area/the whole country accounts for a high proportion</td><td>PCOM2</td></tr><tr><td>27</td><td>The port's revenue increases rapidly every year</td><td>PCOM3</td></tr></table>
Generating HTML Viewer...
References
106 Cites in Article
S Abbes (2015). Seaport competitiveness: a comparative empirical analysis between North and West African countries using principal component analysis.
S Adabere,K Owusu Kwateng,E Dzidzah,F Kamewor (2021). Information technologies and seaport operational efficiency.
J Anderson,D Gerbing (1988). Structural equation modeling in practice: A review and recommended two-step approach.
Jean-François Arvis,Vincent Vesin,Robin Carruthers,César Ducruet,Peter De Langen (2018). Hinterland Connectivity.
Richard Bagozzi,Youjae Yi (1988). On the evaluation of structural equation models.
Sedat Baştuğ,Hercules Haralambides,Soner Esmer,Enes Eminoğlu (2022). Port competitiveness: Do container terminal operators and liner shipping companies see eye to eye?.
T Beatriz,Alan,W (2015). Can ports increase traffic while reducing inputs? Technical efficiency of Spanish Port Authorities using a directional distance function approach.
D Belsley,E Kuh,R Welsch (1980). Regression Diagonistics: Identifying Influential Data and Sources of Collinearity.
Roger Bennett,Helen Gabriel (2001). Reputation, trust and supplier commitment: the case of shipping company/seaport relations.
P Bentler,D Bonett (1980). Significance tests and goodness of fit in the analysis of covariance structures.
Michael Browne,Robert Cudeck (1993). Alternative Ways of Assessing Model Fit.
A Calatayud,J Mangan,R Palacin (2017). Connectivity to international markets: A multi-layered network approach.
V Carbone,M Martino (2003). The changing role of ports in supply-chain management: an empirical analysis.
R Carney,T Child (2013). Changes to the ownership and control of East Asian corporations between 1996 and 2008: The primacy of politics.
A Castro,E Nielson (2003). Natural Resource Conflict Management Case Studies: An Analysis of Power, Participation and Protected Areas.
W Cartwright (1993). Multiple linked "diamonds" and the international competitiveness of exportdependent industries: The New Zealand experience.
John Child,Suzana Rodrigues,Kenneth Tse (2012). The Dynamics of Influence in Corporate Co‐Evolution.
W Chin,P Todd (1995). On the Use, Usefulness, and Ease of Use of Structural Equation Modeling in MIS Research: A Note of Caution.
Max Clarkson (1995). A Stakeholder Framework for Analyzing and Evaluating Corporate Social Performance.
M Da Cruz (2012). Competitiveness and strategic positioning of seaports: The case of Iberian seaports.
P De Langen (2009). Ensuring Hinterland Access The Role of Port Authorities.
J Debrie,V Lavaud-Letilleul,F Parola (2013). Shaping port governance: the territorial trajectories of reform.
P Dimaggio (1998). Strategic Location Choice and Network Formation for Entry.
C Ducruet (2020). Port specialization and connectivity in the global maritime network.
J Dunning (1997). A business and analytic approach to governments and globalization.
J Dunning Unknown Title.
Neil Fligstein,Robert Freeland (1995). Theoretical and Comparative Perspectives on Corporate Organization.
K Foley (2005). Meta-management: a stakeholder/ quality management approach to whole-of-enterprise management.
Charles Fombrun,Naomi Gardberg,Joy Sever (2000). The Reputation QuotientSM: A multi-stakeholder measure of corporate reputation.
J Fontaine (2005). Exploratory Factor Analysis.
R Freeman,D Reed (1983). Stockholders and stakeholders: A New Perspective on Corporate Governance.
R Freeman (1984). Strategic Management: A Stakeholder Approach.
Samuel Green (1991). How Many Subjects Does It Take To Do A Regression Analysis.
Gordon Greenley,Gordon Foxall (1997). Multiple Stakeholder Orientation in UK Companies and the Implications for Company Performance.
Avner Greif (2005). Commitment, Coercion, and Markets: The Nature and Dynamics of Institutions Supporting Exchange.
J Hair,R Aderson,P Tatham,W Black (2006). Multivariate Data Analysis.
P Hall,W Jacobs (2010). Shifting proximities: The maritime ports sector in an era of global supply chains.
Minh Ha,Hieu (2021). Competitive advantage for container port in Vietnam.
J Harrison,C John (1994). Strategic Management of Organizations and Stakeholders.
Y Hayuth (1981). Containerization and the load center concept.
Brian Hoyle (2010). GLOBAL AND LOCAL CHANGE ON THE PORT-CITY WATERFRONT*.
H Hsu,C Lalwani (2010). ICT Implementation in Facilitating International Transport.
L Hu,P Bentler (1995). Evaluating model fit.
Soukaina Jouad,Mohammed Hamri (2020). The Impact of Information Systems on Port Performance: The Case of Morocco's Agadir Port.
F Indriastiwi,S Hadiwardoyo,Nahry (2020). Port Connectivity Model in The Perspective of Multimodal Transport: A Conceptual Framework.
A Kaliszewski,A Kozłowski,J Dąbrowski (2020). Key factors of container port competitiveness: A global shipping lines perspective.
James Kenyon (1970). Elements in Inter-Port Competition in the United States.
J Lam,T Notteboom (2014). The Greening of Ports: A Comparison of Port Management Tools Used by Leading Ports in Asia and Europe.
T Levitt (1965). Harvard business review Christopher A. Bartlett and Sumantra Ghoshal, (Novermber–December 1986), pp. 87–94..
R Liaqait,M Agha,T Beckerc,S Warsi (2020). Case study on the Competitiveness Comparisons of Karachi Port with the Neighbouring Emerging Ports in Persian Gulf and Indian Ocean..
Z Liu,S Schindler,W Liu (2020). Demystifying Chinese overseas investment in infrastructure: Port development, the Belt and Road Initiative and regional development.
J Low,S Lam,L Tang (2009). Assessment of hub status among Asian ports from a network perspective.
Y Lun (2011). Green Management Practices and Firm Performance: A Case of Container Terminal Operations.
Joseph Mahoney,J Pandian (1992). The resource‐based view within the conversation of strategic management.
H Meersman,E Van De Voorde,T Vanelslander (2010). Port Competition Revisited.
O Merk,T Notteboom (2015). Port hinterland connectivity.
Fatima Mohamed-Chérif,César Ducruet (2016). Regional integration and maritime connectivity across the Maghreb seaport system.
H Moon,A Rugman,A Verbeke (1998). A generalized double diamond approach to the global competitiveness of Korea and Singapore.
Z Munim,K Hasan,H Schramm,H Tusher (2022). A port attractiveness assessment framework: Chittagong Port's attractiveness from the users' perspective.
Adolf Ng,Flavio Padilha,Athanasios Pallis (2013). Institutions, bureaucratic and logistical roles of dry ports: the Brazilian experiences.
K Ng (2006). Assessing the attractiveness of ports in the North European container transhipment market: an agenda for future research in port competition.
Ha La,Phat Tran,Thach Bui,Giang Le,Hao Nguyen,Viet Pham (2023). Synthesis of Co3O4 electrodes by electrochemical deposition for water splitting reaction.
Phong Nguyen,Su-Han Woo (2022). Port connectivity and competition among container ports in Southeast Asia based on Social Network Analysis and TOPSIS.
Douglass North (1991). Institutions.
M Norusis (1993). SPSS for Windows base system user's guide release 6.
T Notteboom (2007). The changing face of the terminal operator business: lessons for the regulator.
T Notteboom,P De Langen,W Jacobs (2013). Institutional plasticity and path dependence in seaports: interactions between institutions, port governance reforms and port authority routines.
J O'brien,G Marakas (2011). Management Information Systems.
M Olaf,N Theo (2015). Port hinterland connectivity.
P Oliwia,P Krystian,W Natalia,Andrzej,M (2020). Improving seaport competitiveness by creating a connection to the national rail network.
A Pallis,J Rodrigue (2022). Port Economics, Management and Policy.
R Park (1966). Estimation with Heteroscedastic Error Terms.
Francesco Parola,Marcello Risitano,Marco Ferretti,Eva Panetti (2017). The drivers of port competitiveness: a critical review.
O Pietrzak,K Pietrzak,N Wagner,A Montwiłł (2020). Improving seaport competitiveness by creating a connection to the national rail network.
M Polonsky (1995). Incorporating the natural environment in corporate strategy: a stakeholder approach.
M Porter (1990). The competitive advantage of Nations.
E Porter (1998). Clusters and Competition: New Agendas for Companies, Governments, and Institutions.
Michael Porter (2000). Location, Competition, and Economic Development: Local Clusters in a Global Economy.
D Rajasekar,J Rengamani (2019). Port Hinterland Connectivity.
S Rodrigues (2013). Understanding the Environments of Emerging Markets: The Social Costs of Institutional Voids.
Alan Rugman,J (1993). Rugman Reviews.
R Schumacker,R Lomax (2010). A Beginners Guide to Structural Equation Modeling.
W Scott (2001). Institutions and Organizations.
Dong-Wook Song,Photis Panayides (2008). Global supply chain and port/terminal: integration and competitiveness.
Dong-Wook Song,Ki-Tae Yeo (2004). A Competitive Analysis of Chinese Container Ports Using the Analytic Hierarchy Process.
E Sternberg (2000). Just Business: Business Ethics in Action.
Simone Strambach (2010). Path Dependence and Path Plasticity: The Co-evolution of Institutions and Innovation – the German Customized Business Software Industry.
E Sweeny,P Evangelista (2005). Port Community Learning Needs: Analysis and Design.
H Thorelli (1986). Networks: between markets and hierarchies.
Bruce Thompson (2004). Exploratory and confirmatory factor analysis: Understanding concepts and applications..
E Tijan,M Jovi Ć,D Žgaljić,S Aksentijević (2022). Factors Affecting Container Seaport Competitiveness: Case Study on Port of Rijeka.
J Tongzon,W Heng (2005). Port privatization, efficiency and competitiveness: Some empirical evidence from container ports (terminals).
Chinonye Ugboma,Ogochukwu Ugboma,Innocent Ogwude (2006). An Analytic Hierarchy Process (AHP) Approach to Port Selection Decisions – Empirical Evidence from Nigerian Ports.
Roy Van Den Berg,Peter De Langen,Carles Rúa Costa (2012). The role of port authorities in new intermodal service development; the case of Barcelona Port Authority.
L Van Der Lugt,S Rodrigues,R Van Den Berg (2012). Co-evolution of the strategic reorientation of port actors: insights from the Port of Rotterdam and the Port of Barcelona.
S Wahyuni,F Hui,A Taufik (2019). Revealing Indonesian Port Competitiveness: Challenge and Performance.
M Wan,H Kuang,Y Yu (2022). Research on the Evaluation of the Competitiveness of the Container Multimodal Port Hub.
G Wang,Q Zeng,K Li,J Yang (2016). Port connectivity in a logistic network: The case of Bohai Bay, China.
Teng-Fei Wang,Kevin Cullinane (2006). The Efficiency of European Container Terminals and Implications for Supply Chain Management.
G Weigend (1956). The problem of hinterland and foreland as illustrated by the port of Hamburg.
Elamein Yousif,Elamin Dahawi,Sarah Premraj (2007). Triple whammy in a patient with portal vein thrombosis.
G Yeo,M Roe,J Dinwoodie (2008). Evaluating the competitiveness of container ports in Korea and China.
Y Zhang (2006). Analysis of the incentives in environmental strategies implementation in Chinese ports.
Qi Zhang,Wenyuan Wang,Yun Peng,Junyi Zhang,Zijian Guo (2018). A game-theoretical model of port competition on intermodal network and pricing strategy.
Z Yi,C Yang,M Yu (2021). Managing regional container terminal competition: the roles of information and government support.
No ethics committee approval was required for this article type.
Data Availability
Not applicable for this article.
How to Cite This Article
Ho Dinh Phi. 2026. \u201cFactors Affecting the Competitiveness of the Seaport: A Case Study in Ho Chi Minh City, Vietnam\u201d. Global Journal of Management and Business Research - A: Administration & Management GJMBR-A Volume 24 (GJMBR Volume 24 Issue A1).
Explore published articles in an immersive Augmented Reality environment. Our platform converts research papers into interactive 3D books, allowing readers to view and interact with content using AR and VR compatible devices.
Your published article is automatically converted into a realistic 3D book. Flip through pages and read research papers in a more engaging and interactive format.
Our website is actively being updated, and changes may occur frequently. Please clear your browser cache if needed. For feedback or error reporting, please email [email protected]
Thank you for connecting with us. We will respond to you shortly.