## I. MANILA IN THE CONTEMPORARY PERIOD
It is in a strategic location in the Far East and Southeast Asia, a maritime route, making it a center for trade, commerce, finance, education, and government; thus, it is a commercial and industrial port site. Like during the Philippine Commonwealth, the North Harbor was now developed for inter-island maritime shipping, while the South Harbor was made for foreign trade. There was limited use of the shipping vessels for berth and Anchorage, the domestic vessels in the f Luneta.
The improvement of the port facilities in Manila was strengthened with the Reclamation Law in 1957 and the Local Autonomy Law in 1959, which allowed local governments to initiate public enhancements, especially in the port cities in Manila (e.g., foreshore lands).[^409] The Americans' territorial coastline of Manila in 1901 only provided 4.5 kilometers south of Pasig to Vito Cruz. Seven kilometers were a concern for the South and North Port Harbor areas. The reclamation had considered the Manila Port and Harbor Development one of the programs.
The location of Tondo, Manila, begins at a point in the boundary between monuments forty-two and forty-three, where the center line of Avenida Rizal intersects it; southerly along the center line of Avenida Rizal to the center of the province of Antipolo branch of Manila Bay; western along the center of intersection with Estero de San Lazaro and western of Calle Azcarraga, to the high water line on the shore of Manila Bay[1].
The City of Manila is divided into four representative districts for national representation, each district to be represented by one member in the House of Representatives\[2\]: First District of Tondo, Second Districts of San Nicolas, Binondo, Quiapo, and Sta. Cruz, Third District of Sampaloc and San Miguel, Fourth District of Intramuros, Port Area, Ermita, Malate, Paco, Pandacan, and Sta. Ana.
A total of 40 percent of the maritime transport accounts for the coastal countries, while 46 percent would be the entire transport coast in the Philippines. In 2000, the Philippinesranked third in the five-port based on its efficiency in terms of services and global competitiveness.
Table 1: Port efficiency is from the Global Competitiveness Report, 7 being the best score; Median Clearance time is the median number of days to clear customs; Data for the year 2000. Competition Policy and Regulation in Ports and Shipping, February 5, 2005, p. 8
<table><tr><td>Country</td><td>Port Efficiency Index (1-7)</td><td>Median Clearance Time (Days)</td></tr><tr><td>Hong Kong</td><td>6.38</td><td>Na</td></tr><tr><td>Malaysia</td><td>4.95</td><td>7</td></tr><tr><td>Philippines</td><td>2.79</td><td>7</td></tr><tr><td>Singapore</td><td>6.76</td><td>2</td></tr><tr><td>Taiwan</td><td>5.18</td><td>n/a</td></tr></table>
Based on this chart, the ports of Manila have the least efficient index at 2.79 compared to Singapore at 6.75. Clearance time for cargo in Manila was seven days compared to only two days in Singapore in 2000.
The port efficiency includes physical infrastructure, industry structure, and regulation. Cargo handling services and even tariffs, as well as the behavior of the firms involved in the port industry, are part of this data. Like most infrastructures, ports also undergo rapid changes; the government identifies that buildings, infrastructures within the ports, cargo operations, and other port services must improve. However, the unsatisfactory performance of the port is also reflected in the number of countries. The
management planning brought financial losses to the state, businesses, and consumers[3].
In terms of privatization in south east Asia, Malaysia was the first country to be involved in the private sector, which managed the port facilities, because of the leasing of containers to Port Kelang to a private association in 1986. It continued to become a private sector by 1995, and port productivity increased by 15 to $20\%$.[4]
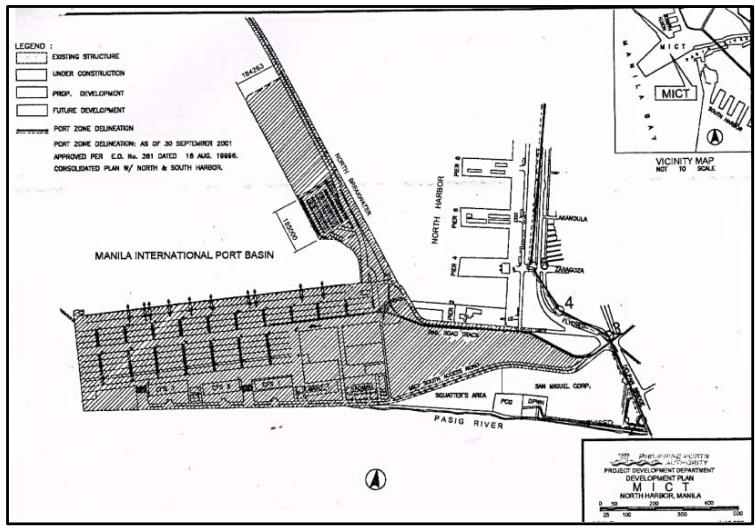
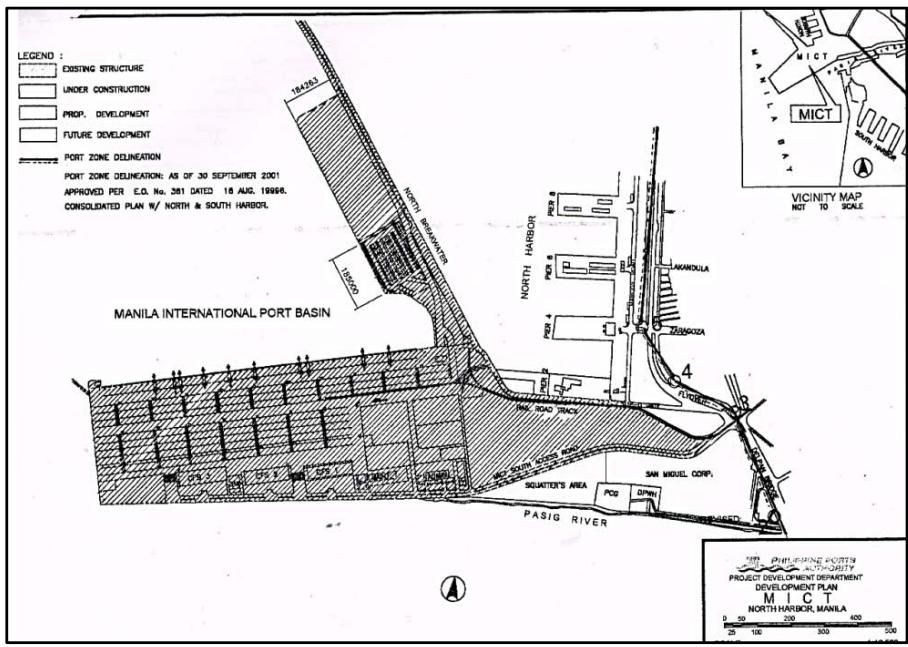 Figure 1: Manila International Container Terminal Layout. Profile of Philippine Ports Third Edition
The Manila International Container Terminal (MICT), operated by the International Container Terminal Services, Inc. (ICTSI), is located between the North and South Harbors in Manila and the westward of Manila. The southern end is the mouth of the Pasig River, a container-dedicated terminal, and is one of the three terminals in the Port of Manila.
These remaining two terminals, the North Harbor, were for domestic bulk, break bulk, passenger, and containerized cargo, and the South Harbor was for international bulk, break bulk passenger, and containerized cargo. The MICT has a total of 1,300 sq. in length and comprises six berths with the exact dimensions.
Table 2: The number of berths and their measurement. — profile of the Philippine Ports Third Edition
<table><tr><td>Berth</td><td>Length</td><td>Depth</td></tr><tr><td>1</td><td>250m</td><td>12.50m</td></tr><tr><td>2</td><td>250m</td><td>12.50m</td></tr><tr><td>3</td><td>250m</td><td>12.50m</td></tr><tr><td>4</td><td>250m</td><td>12.50m</td></tr><tr><td>5</td><td>300m</td><td>14.50m</td></tr></table>
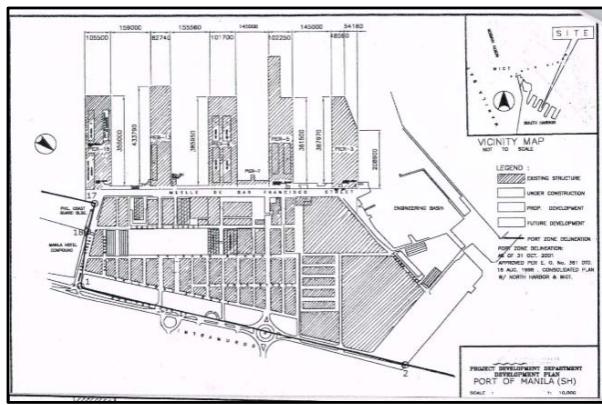 Figure 2: Port of Manila, South Harbor. Profile of Philippine Ports Third Edition
The PMO- South Harbor is one of the 123 government-owned ports the Philippine Ports Authority administers. It is a multi-cargo port with five-fingerpiers that handle all types of cargo, including container, bulk cargo, break-bulk, general cargo, and vehicles.
Bulk cargoes are handled at berth and their designated anchorages. The South Harbor handles at berth and its designated anchorage. South Harbor also handles much international shipping in the country, and its annual capacity was 820,000 more or less in its container vans. The South Harbor handles bulk cargo services.
In 2000, the total number of containers was 3,130,656 TEUs; the Cagayan de Oro and Davao had the highest container traffic in the base port, with 148,482 TEUs and 145,372 TEUs. The Manila South Harbor had the highest total of the base port, 576,592 TEUs; MICT, 951,289 TEUs; and Manila North Harbor, 763,823 TEUs.
There was no documented domestic total number of cargo throughput in MICT, but the international cargo has a total of 11,242 870 metric tons—a total of 10,621,321 metric tons of international cargo for at berth and 621,549 m.t.
Table 3: Shipping cargo and passenger statistics in Manila International Container Terminal. Philippine Ports Authority, 2000
<table><tr><td rowspan="2">Particulars</td><td colspan="3">M.I.C.T</td></tr><tr><td>AT BERTH</td><td>AT ANCH.</td><td>TOTAL</td></tr><tr><td>B. CARGO AND PASSENGER</td><td></td><td></td><td></td></tr><tr><td>1. Total Cargo Throughput (m.t.)</td><td>10,633,153</td><td>621,549</td><td>11,254,702</td></tr><tr><td>a. Domestic</td><td>0</td><td>0</td><td>0</td></tr><tr><td>Inbound</td><td>0</td><td>0</td><td>0</td></tr><tr><td>Breakbulk</td><td>0</td><td>0</td><td>0</td></tr><tr><td>Bulk</td><td>0</td><td>0</td><td>0</td></tr><tr><td>Containerized</td><td>0</td><td>0</td><td>0</td></tr><tr><td>Outbound</td><td>0</td><td>0</td><td>0</td></tr><tr><td>Breakbulk</td><td>0</td><td>0</td><td>0</td></tr><tr><td>Bulk</td><td>0</td><td>0</td><td>0</td></tr><tr><td>Containerized</td><td>0</td><td>0</td><td>0</td></tr><tr><td>b. Foreign</td><td>10,621,321</td><td>621,549</td><td>11,242,870</td></tr><tr><td>Import</td><td>6,527,425</td><td>621,549</td><td>7,148,374</td></tr><tr><td>Breakbulk</td><td>21,404</td><td>0</td><td>21,404</td></tr><tr><td>Bulk</td><td>0</td><td>621,549</td><td>621,549</td></tr><tr><td>Containerized</td><td>6,506,021</td><td>0</td><td>6,506,021</td></tr><tr><td>Export</td><td>4,093,896</td><td>0</td><td>4,093,896</td></tr><tr><td>Breakbulk</td><td>0</td><td>0</td><td>0</td></tr><tr><td>Bulk</td><td>0</td><td>0</td><td>0</td></tr><tr><td>Containerized</td><td>4,093,896</td><td>0</td><td>4,093,896</td></tr><tr><td>c. Transit Cargo</td><td>11,832</td><td>0</td><td>11,832</td></tr><tr><td>Domestic</td><td>5,335</td><td>0</td><td>5,335</td></tr><tr><td>Inward</td><td>6,437</td><td>0</td><td>6,437</td></tr><tr><td>Outward</td><td>0</td><td>0</td><td>0</td></tr><tr><td>Foreign</td><td>0</td><td>0</td><td>0</td></tr><tr><td>Inward</td><td>0</td><td>0</td><td>0</td></tr><tr><td>Outward</td><td>0</td><td>0</td><td>0</td></tr><tr><td>d. Foreign (Transhipment)</td><td>249,221</td><td>0</td><td>249,221</td></tr><tr><td>2. Total Passengers</td><td>0</td><td>0</td><td>0</td></tr><tr><td>Disembarking</td><td>0</td><td>0</td><td>0</td></tr><tr><td>Embarking</td><td>0</td><td>0</td><td>0</td></tr></table>
The Manila North Harbor had 6,394 shipping vessels for both berth and anchorage; the domestic vessels in the base port had 5,908, and 467 were private ports.
Table 4: Shipping cargo and passenger statistics in Manila North Harbor, 2000 Terminal. Philippine Ports Authority
<table><tr><td rowspan="2">PARTICULARS</td><td colspan="2">AT BERTH</td><td colspan="2">AT ANCHORAGE</td></tr><tr><td>Base Port</td><td>Private Ports</td><td>Base Port</td><td>TOTAL</td></tr><tr><td colspan="5">A. SHIPPING</td></tr><tr><td>1. Number of Vessels</td><td>5,308</td><td>467</td><td>19</td><td>6,394</td></tr><tr><td>Domestic</td><td>5,308</td><td>347</td><td>19</td><td>6,274</td></tr><tr><td>Foreign</td><td>0</td><td>120</td><td>0</td><td>120</td></tr><tr><td>2. Gross Registered Tonnage</td><td>30,998,941</td><td>1,404,961</td><td>28,473</td><td>32,432,375</td></tr><tr><td>Domestic</td><td>30,998,941</td><td>226,037</td><td>28,473</td><td>31,253,451</td></tr><tr><td>Foreign</td><td>0</td><td>1,178,924</td><td>0</td><td>1,178,924</td></tr><tr><td>3. Net Registered Tonnage</td><td>14,656,160</td><td>679,701</td><td>17,889</td><td>15,353,750</td></tr><tr><td>Domestic</td><td>14,656,160</td><td>166,016</td><td>17,889</td><td>14,840,065</td></tr><tr><td>Foreign</td><td>0</td><td>513,685</td><td>0</td><td>513,685</td></tr><tr><td>4. Deadweight Tonnage</td><td>20,642,793</td><td>2,180,506</td><td>53,480</td><td>22,876,779</td></tr><tr><td>Domestic</td><td>20,642,793</td><td>407,879</td><td>53,480</td><td>21,104,152</td></tr><tr><td>Foreign</td><td>0</td><td>1,772,627</td><td>0</td><td>1,772,627</td></tr><tr><td>5. Length of Vessels (m.)</td><td>604,442</td><td>34,455</td><td>1,386</td><td>640,283</td></tr><tr><td>Domestic</td><td>604,442</td><td>18,066</td><td>1,386</td><td>623,894</td></tr><tr><td>Foreign</td><td>0</td><td>16,389</td><td>0</td><td>16,389</td></tr><tr><td>6. Beam of Vessels (m.)</td><td>98,279</td><td>3,635</td><td>234</td><td>102,208</td></tr><tr><td>Domestic</td><td>98,279</td><td>3,635</td><td>234</td><td>102,208</td></tr><tr><td>Foreign</td><td>0</td><td>2,626</td><td>0</td><td>2,626</td></tr><tr><td>7. Draft of Vessels (m.)</td><td>29,405</td><td>2,121</td><td>84</td><td>31,610</td></tr><tr><td>Domestic</td><td>29,405</td><td>1,347</td><td>84</td><td>30,836</td></tr><tr><td>Foreign</td><td>0</td><td>774</td><td>0</td><td>774</td></tr><tr><td>8. Waiting Time (hrs.)</td><td>557</td><td>0</td><td>0</td><td>557</td></tr><tr><td>Domestic</td><td>557</td><td>0</td><td>0</td><td>557</td></tr><tr><td>Foreign</td><td>0</td><td>0</td><td>0</td><td>0</td></tr><tr><td>9. Service Time (hrs.)</td><td>239,033</td><td>61,928</td><td>1,264</td><td>362,285</td></tr><tr><td>Domestic</td><td>239,033</td><td>54,845</td><td>1,264</td><td>355,202</td></tr><tr><td>Foreign</td><td>0</td><td>7,083</td><td>0</td><td>7,083</td></tr></table>

The Manila North Harbor had a total of 17,267,863 m.t. as of the year 2000 of total cargo throughput, 15,599 033 m.t. for the base port at berth and 1,633,516 private ports at berth while 32,314 m.t. The base port at anchorage. The domestic cargo had a total of 15,257,591 m.t., higher than the international shipment of 1,318,437m.t. The total number of passengers was 3,801,58, the same for the number of passengers at base ports; moreover, no documented passengers were at individual ports.[7]
Table 5: Shipping cargo and passenger statistics in Manila North Harbor. Philippine Ports Authority.2000
<table><tr><td></td><td></td><td colspan="2">AT BERTH</td><td colspan="2">AT ANCHORAGE</td></tr><tr><td colspan="2">PARTICULARS</td><td>Base Port</td><td>Private Ports</td><td>Base Port</td><td>TOTAL</td></tr><tr><td colspan="2">B. CARGO AND PASSENGER</td><td></td><td></td><td></td><td></td></tr><tr><td></td><td>1. Total Cargo Throughput (m.t.)</td><td>15,599,033</td><td>1,633,516</td><td>32,314</td><td>17,264,863</td></tr><tr><td></td><td>a. Domestic</td><td>14,910,198</td><td>315,079</td><td>32,314</td><td>15,257,591</td></tr><tr><td></td><td>Inbound</td><td>6,630,749</td><td>209,034</td><td>31,034</td><td>6,870,817</td></tr><tr><td></td><td>Breakbulk</td><td>1,023,709</td><td>161,944</td><td>0</td><td>1,185,653</td></tr><tr><td></td><td>Bulk</td><td>161,418</td><td>46,172</td><td>31,034</td><td>238,624</td></tr><tr><td></td><td>Containerized</td><td>5,445,622</td><td>918</td><td>0</td><td>5,446,540</td></tr><tr><td></td><td>Outbound</td><td>8,279,449</td><td>106,045</td><td>1,280</td><td>8,386,774</td></tr><tr><td></td><td>Breakbulk</td><td>889,499</td><td>106,045</td><td>0</td><td>995,544</td></tr><tr><td></td><td>Bulk</td><td>89</td><td>0</td><td>1,280</td><td>1,369</td></tr><tr><td></td><td>Containerized</td><td>7,389,861</td><td>0</td><td>0</td><td>7,389,861</td></tr><tr><td></td><td>b. Foreign</td><td>0</td><td>1,318,437</td><td>0</td><td>1,318,437</td></tr><tr><td></td><td>Import</td><td>0</td><td>1,318,437</td><td>0</td><td>1,318,437</td></tr><tr><td></td><td>Breakbulk</td><td>0</td><td>0</td><td>0</td><td>0</td></tr><tr><td></td><td>Bulk</td><td>0</td><td>1,318,437</td><td>0</td><td>1,318,437</td></tr><tr><td></td><td>Containerized</td><td>0</td><td>0</td><td>0</td><td>0</td></tr><tr><td></td><td>Export</td><td>0</td><td>0</td><td>0</td><td>0</td></tr><tr><td></td><td>Breakbulk</td><td>0</td><td>0</td><td>0</td><td>0</td></tr><tr><td></td><td>Bulk</td><td>0</td><td>0</td><td>0</td><td>0</td></tr><tr><td></td><td>Containerized</td><td>0</td><td>0</td><td>0</td><td>0</td></tr><tr><td></td><td>c. Transit Cargo</td><td>688,835</td><td>0</td><td>0</td><td>688,835</td></tr><tr><td></td><td>Domestic</td><td>688,835</td><td>0</td><td>0</td><td>688,835</td></tr><tr><td></td><td>Inward</td><td>367,393</td><td>0</td><td>0</td><td>367,393</td></tr><tr><td></td><td>Outward</td><td>321,442</td><td>0</td><td>0</td><td>321,442</td></tr><tr><td></td><td>Foreign</td><td>0</td><td>0</td><td>0</td><td>0</td></tr><tr><td></td><td>Import</td><td>0</td><td>0</td><td>0</td><td>0</td></tr><tr><td></td><td>Export</td><td>0</td><td>0</td><td>0</td><td>0</td></tr><tr><td></td><td>d. Foreign (Transhipment)</td><td>0</td><td>0</td><td>0</td><td>0</td></tr><tr><td></td><td>2. Total Passengers</td><td>3,801,583</td><td>0</td><td>0</td><td>3,801,583</td></tr><tr><td></td><td>Disembarking</td><td>2,084,134</td><td>0</td><td>0</td><td>2,084,134</td></tr><tr><td></td><td>Embarking</td><td>1,717,449</td><td>0</td><td>0</td><td>1,717,449</td></tr></table>
The Manila International Container Terminal had a total number of 1,1991 vessels both for berth and anchorage. Specifically, domestic cargo had 30 vessels, and foreign cargoes had 1,961. A total of 10,041 hours was the accumulated time for berth and anchorage, while the service time from MICT had a total of 43,112.
The total cargo was 11,254,702 m.t. There were no documented domestic vessels for MICT, but the total number of foreign cargo was 11,242. In 2000, import values were much higher than the export value, with 7,148,974 m.t. cargo vessels and 4,093,896 export vessels.
Table 6: Shipping cargo and passenger statistics in Manila International Container Terminal. Philippine Ports Authority. 2000
<table><tr><td></td><td></td><td colspan="3">M.I.C.T</td></tr><tr><td colspan="2">PARTICULARS</td><td>AT BERTH</td><td>AT ANCH.</td><td>TOTAL</td></tr><tr><td></td><td></td><td></td><td></td><td></td></tr><tr><td colspan="2">A. SHIPPING</td><td></td><td></td><td></td></tr><tr><td></td><td></td><td></td><td></td><td></td></tr><tr><td></td><td></td><td></td><td></td><td></td></tr><tr><td colspan="2">1. Number of Vessels</td><td>1,941</td><td>50</td><td>1,991</td></tr><tr><td colspan="2">B. CARGO AND PASSENGER</td><td></td><td></td><td></td></tr><tr><td></td><td colspan="2">1. Total Cargo Throughput (m.t.)</td><td>10,633,153</td><td>621,549</td><td>11,254,702</td></tr><tr><td></td><td colspan="2">a. Domestic</td><td>0</td><td>0</td><td>0</td></tr>
In 2001, the Manila International Container Terminal had 1,938 vessels for berth and anchorage. The total number of domestic was 19; foreign, 1,919. The total number of domestic cargoes is 10,904,546 m.t. Moreover, there were 10,914,386, but no documented number of passengers was in MICT. The total service time of MICT for domestic was 52 hours; for foreign, 34,837 and 34,889 hours service time. The total waiting time of MICT for domestic was 65 hours; for foreign, 7,591 hours and a total of 7,656 hours waiting time[8].
The total domestic cargo commodity in 2001 for the Manila International Container Terminal was 9,840: 9840 for Containerized and no documented number of cargoes for breakbulk and bulk. The total foreign cargo commodity for the Manila International Container Terminal was 10,904,546, 28,730 for breakbulk, 695,486 for Bulk, and 10,180,330 for containerized. The total of cargo for the Manila International Container Terminal was 10,914,386. The highest number of cargos for the MICT was from the other general cargo, with a total of 10,421,340 cargoes. The inbound domestic cargo had a total of 3750; 3,750 for containerized and no documented number of cargoes for breakbulk and bulk. The inbound foreign cargo had 8,914,717, 28,730 for breakbulk, 695,486 for bulk, and 6,190,501 for containerized. The total of cargo was 6,918,467. Most cargo was from the other general cargo, comprising 6,425,421 cargoes. The outbound domestic cargo had a total of 6,090; 6,090 are containerized, and there is no documented number of cargo for breakbulk and bulk. The outbound foreign cargo had 3,989,829, 3,989,829 for containerization, and no documented number of
cargos for breakbulk and bulk. The total of cargo was 3,995,919. The highest amount of cargo was from other general sources, with a total of 3,995,919[9].
The PMO- Manila North Harbor had a total 6,226 number of vessels for berth and Anchorage; the total number of domestic was 6,115; foreign, 111. The total number of cargo passengers for domestic was 15,644,494 m.t; foreign, 1,540,943 m.t. Moreover, a total of 17,857,437 m.t. The total number of passengers in Manila North Harbor was 3,420,855. The total service time of Manila North Harbor for domestic was 316,473 hours; for foreign, 8,411 hours and 324,884 hours service time. The total waiting time at Manila North Harbor for domestics was 41 hours; there were no documented hours for foreigners, and there was a total of 41 hours waiting time[10].
The total domestic cargo commodity for the PMO- Manila North Harbor was 6,723,507, 1,630,632 for Breakbulk, 541,256 for Bulk, and 4,551,619 for Containerized. The total international cargo commodity for the Manila North Harbor was 1,540,943, 1,540,943 for Bulk, and no documented number of cargoes for Breakbulk and Containerized. The total of cargo for the Manila North Harbor was 8,264,450. The highest number of Cargo for the Manila North Harbor was from the other general Cargo, with a total of 2,912,219 cargoes, and the lowest number of cargoes was from Molasses, with a total of 44 cargoes. The inbound domestic cargo had a total of 3,179,692: 959,514 for Breakbulk, 496,593 for Bulk, and 1,723,585 for Containerized. The inbound foreign cargo had 1,540,943, 1,540,943 for Bulk, and no documented number of cargo for Breakbulk and Containerized. The total of cargo was 4,720,635. The highest number of cargoes was from Cement, with a total of 1,322,693 cargoes, and the lowest number of cargoes was from Molasses, with a total number of 18 cargoes. The outbound domestic cargo had a total 3,543,815: 671,118 for Breakbulk,44,663 for Bulk, and 2,828,034 for Containerized. The outbound foreign cargo had no documented number of cargo. The total of cargo was 3,543,815. The highest number of cargoes was from the other general cargo, with a total of 2,014,145, and the lowest number of cargoes was from Logs with no documented number of cargoes.[11]
The PMO- Manila South Harbor had a total 10.532 number of vessels for berth and Anchorage; the total number of domestic was 8,356; foreign, 2,176. The total number of cargo passengers for domestic was 6,267,698 m.t; foreign, 6,784,721 m.t. Moreover, a total of 13,090,784 m.t. Also, the total number of passengers for foreign in Manila South Harbor was 14,808. The total service time of Manila South Harbor for domestic was 591,553 hours; for foreign, 90,590, and a total of 682,143 service time. The total waiting time at Manila South Harbor for domestic workers was 30 hours; for foreign workers, it was 2,271 hours, and for foreigners, it was 2,301 hours $^{12}$.
The total domestic Cargo commodity for the PMO-Manila South Harbor was 6,267,698, 1,845,380 for Breakbulk, 4,422,318 for Bulk, and no documented number of cargoes for Containerized. The total foreign Cargo commodity was 6,823,086: 3,175,141 for Breakbulk, 676,259 for Bulk, and 2,971,686 for Containerized. The total of cargo for the Manila South Harbor was 13,090,784. The highest number of Cargo for the Manila South Harbor was from the Iron and Steel, with a total of 4,169,173 cargoes, and the lowest number of cargoes was from Abaca, with a total of 907 cargoes. The inbound domestic cargo had a total of 6,203,211, while for Breakbulk, 1,803,515; 4,399,696 for Bulk and no documented number of cargo for Containerized. The inbound foreign cargo had 6,348,106, 3,149,129 for Breakbulk, 650,017 for Bulk, and 2,548,960 for Containerized. The total of cargo was 12,551,317. The highest number of cargoes was from Iron and Steel, with a total of 4,156,115, and the lowest number of cargos was from the Abaca, with no documented number of cargos. The outbound domestic cargo had a total of 64,487, 41,865 for Breakbulk, 22,622 for Bulk, and no documented number of cargo for Containerized. The outbound foreign cargo had a total of 474,980: 26,012 for Breakbulk, 26,242 for Bulk, and 422,726 for Containerized. The total of cargo was 539,467. The highest number of cargoes was from the other general cargo, with a total of 271,43, and the lowest number of cargo was from the Copra, Logs, Live animals, and Molasses, which had no documented number of cargoes[13].
In 2002, the PMO – Manila Harbor had 6,381 vessels for a berth and no documented vessels for anchorage. The total number of cargo passengers for domestic is 16,887,607 m.t.; foreign is 791,262 m.t. Moreover, a total of 17,954,848 m.t. There was a total number of passengers in Manila North Harbor of 3,977,851[14].
Table 7: Summary of Shipping Statistics by Port Classification; PMO: North Harbor at Berth and Anchorage. Philippine Port Authority vol. 1, 2002
<table><tr><td colspan="2">2002</td><td></td><td></td><td></td></tr><tr><td rowspan="2" colspan="2">PARTICULARS</td><td colspan="2">AT BERTH</td><td rowspan="2">TOTAL</td></tr><tr><td>Base Port</td><td>Private Ports</td></tr><tr><td></td><td></td><td></td><td></td><td></td></tr><tr><td colspan="2">A. SHIPPING</td><td></td><td></td><td></td></tr><tr><td></td><td></td><td></td><td></td><td></td></tr><tr><td></td><td></td><td></td><td></td><td></td></tr><tr><td colspan="2">1. Number of Vessels</td><td>5,831</td><td>430</td><td>6,381</td></tr><tr><td></td><td>Domestic</td><td>5,831</td><td>421</td><td>6,312</td></tr><tr><td></td><td>Foreign</td><td>0</td><td>63</td><td>63</td></tr><tr><td></td><td></td><td></td><td></td><td></td></tr><tr><td colspan="2">2. Gross Registered Tonnage</td><td>26,314,683</td><td>1,202,215</td><td>26,116,304</td></tr><tr><td></td><td>Domestic</td><td>26,314,683</td><td>351,833</td><td>27,266,582</td></tr><tr><td></td><td>Foreign</td><td>0</td><td>850,322</td><td>850,322</td></tr><tr><td></td><td></td><td></td><td></td><td></td></tr><tr><td colspan="2">3. Net Registered Tonnage</td><td>14,443,243</td><td>716,737</td><td>15,153,380</td></tr><tr><td></td><td>Domestic</td><td>14,443,243</td><td>252,701</td><td>14,635,344</td></tr><tr><td></td><td>Foreign</td><td>0</td><td>464,036</td><td>464,036</td></tr><tr><td></td><td></td><td></td><td></td><td></td></tr><tr><td colspan="2">4. Deadweight Tonnage</td><td>18,720,740</td><td>1,418,938</td><td>20,139,738</td></tr><tr><td></td><td>Domestic</td><td>18,720,740</td><td>530,732</td><td>19,251,532</td></tr><tr><td></td><td>Foreign</td><td>0</td><td>888,206</td><td>888,206</td></tr><tr><td></td><td></td><td></td><td></td><td></td></tr><tr><td colspan="2">5. Length of Vessels (m.)</td><td>586,116</td><td>31,541</td><td>617,657</td></tr><tr><td></td><td>Domestic</td><td>586,116</td><td>22,627</td><td>608,743</td></tr><tr><td></td><td>Foreign</td><td>0</td><td>8,314</td><td>8,314</td></tr><tr><td></td><td></td><td></td><td></td><td></td></tr><tr><td colspan="2">6. Beam of Vessels (m.)</td><td>36,264</td><td>5,930</td><td>102,254</td></tr><tr><td></td><td>Domestic</td><td>36,264</td><td>4,487</td><td>100,751</td></tr><tr><td></td><td>Foreign</td><td>0</td><td>1,503</td><td>1,503</td></tr><tr><td></td><td></td><td></td><td></td><td></td></tr><tr><td colspan="2">7. Draft of Vessels (m.)</td><td>28,231</td><td>1,533</td><td>23,824</td></tr><tr><td></td><td>Domestic</td><td>28,231</td><td>1,203</td><td>23,434</td></tr><tr><td></td><td>Foreign</td><td>0</td><td>330</td><td>330</td></tr><tr><td></td><td></td><td></td><td></td><td></td></tr><tr><td colspan="2">8. Waiting Time (hrs.)</td><td>0</td><td>0</td><td>0</td></tr><tr><td></td><td>Domestic</td><td>0</td><td>0</td><td>0</td></tr><tr><td></td><td>Foreign</td><td>0</td><td>0</td><td>0</td></tr><tr><td></td><td></td><td></td><td></td><td></td></tr><tr><td colspan="2">9. Service Time (hrs.)</td><td>305,663</td><td>56,330</td><td>362,653</td></tr><tr><td></td><td>Domestic</td><td>305,663</td><td>43,530</td><td>355,253</td></tr><tr><td></td><td>Foreign</td><td>0</td><td>7,400</td><td>7,400</td></tr></table>
Table 8: Summary of Cargo Passenger by Port Classification; PMO: North Harbor at Berth and Anchorage. Philippine Port Authority vol. 1, 2002
<table><tr><td rowspan="2" colspan="2">PARTICULARS</td><td colspan="2">AT BERTH</td><td rowspan="2">TOTAL</td></tr><tr><td>Base Port</td><td>Private Ports</td></tr><tr><td colspan="2">B. CARGO AND PASSENGER</td><td></td><td></td><td></td></tr><tr><td></td><td>1. Total Cargo Throughput (m.t.)</td><td>16,775,690</td><td>1,179,158</td><td>17,954,848</td></tr><tr><td></td><td>a. Domestic</td><td>16,499,711</td><td>387,896</td><td>16,887,607</td></tr><tr><td></td><td>Inbound</td><td>7,265,007</td><td>172,324</td><td>7,437,331</td></tr><tr><td></td><td>Breakbulk</td><td>986,882</td><td>127,157</td><td>1,114,039</td></tr><tr><td></td><td>Bulk</td><td>297,730</td><td>2,244</td><td>299,974</td></tr><tr><td></td><td>Containerized</td><td>5,980,395</td><td>42,923</td><td>6,023,318</td></tr><tr><td></td><td>Outbound</td><td>9,234,704</td><td>215,572</td><td>9,450,276</td></tr><tr><td></td><td>Breakbulk</td><td>1,049,362</td><td>114,065</td><td>1,163,427</td></tr><tr><td></td><td>Bulk</td><td>8,901</td><td>54,667</td><td>63,568</td></tr><tr><td></td><td>Containerized</td><td>8,176,441</td><td>46,840</td><td>8,223,281</td></tr><tr><td></td><td>b. Foreign</td><td>0</td><td>791,262</td><td>791,262</td></tr><tr><td></td><td>Import</td><td>0</td><td>791,262</td><td>791,262</td></tr><tr><td></td><td>Breakbulk</td><td>0</td><td>72,515</td><td>72,515</td></tr><tr><td></td><td>Bulk</td><td>0</td><td>718,747</td><td>718,747</td></tr><tr><td></td><td>Containerized</td><td>0</td><td>0</td><td>0</td></tr><tr><td></td><td>Export</td><td>0</td><td>0</td><td>0</td></tr><tr><td></td><td>Breakbulk</td><td>0</td><td>0</td><td>0</td></tr><tr><td></td><td>Bulk</td><td>0</td><td>0</td><td>0</td></tr><tr><td></td><td>Containerized</td><td>0</td><td>0</td><td>0</td></tr><tr><td></td><td>c. Transit Cargo</td><td>275,979</td><td>0</td><td>275,979</td></tr><tr><td></td><td>Domestic (Cont.)</td><td>275,979</td><td>0</td><td>275,979</td></tr><tr><td></td><td>Inward</td><td>188,621</td><td>0</td><td>188,621</td></tr><tr><td></td><td>Outward</td><td>87,358</td><td>0</td><td>87,358</td></tr><tr><td></td><td>Foreign</td><td>0</td><td>0</td><td>0</td></tr><tr><td></td><td>Import</td><td>0</td><td>0</td><td>0</td></tr><tr><td></td><td>Export</td><td>0</td><td>0</td><td>0</td></tr><tr><td></td><td>d. Foreign (Transhipment)</td><td>0</td><td>0</td><td>0</td></tr><tr><td></td><td>2. Total Passengers</td><td>3,977,851</td><td>0</td><td>3,977,851</td></tr><tr><td></td><td>Disembarking</td><td>2,149,271</td><td>0</td><td>2,149,271</td></tr><tr><td></td><td>Embarking</td><td>1,828,580</td><td>0</td><td>1,828,580</td></tr></table>
The PMO- Manila South Harbor had a total of 10,880 vessels both for berth and anchorage. There was no number of passengers for domestic.; foreign, 3,016,510 m.t. Moreover, a total of 3,016,510 m.t. Moreover, there was no documented number of passengers for Manila South Harbor.[15]

Table 9: Summary of Shipping Statistics by Port Classification; PMO: South Harbor at Berth and Anchorage. Philippine Port Authority vol. 1, 2002
<table><tr><td colspan="2">2002</td><td></td><td></td><td></td><td></td><td></td></tr><tr><td></td><td></td><td colspan="3">AT BERTH</td><td>AT ANCHORAGE</td><td></td></tr><tr><td colspan="2">PARTICULARS</td><td>Base Port</td><td colspan="2">Terminal Port - Pasig</td><td>Base Port</td><td>TOTAL</td></tr><tr><td></td><td></td><td>South Harbor</td><td>Government</td><td>Private</td><td>South Harbor</td><td></td></tr><tr><td colspan="2">A. SHIPPING</td><td></td><td></td><td></td><td></td><td></td></tr><tr><td></td><td>1. Number of Vessels</td><td>1,774</td><td>2,777</td><td>5,885</td><td>444</td><td>10,880</td></tr><tr><td></td><td>Domestic</td><td>113</td><td>2,777</td><td>5,885</td><td>0</td><td>8,775</td></tr><tr><td></td><td>Foreign</td><td>1,661</td><td>0</td><td>0</td><td>444</td><td>2,105</td></tr><tr><td></td><td>2. Gross Registered Tonnage</td><td>20,666,123</td><td>1,279,984</td><td>2,635,376</td><td>5,713,707</td><td>30,295,190</td></tr><tr><td></td><td>Domestic</td><td>334,871</td><td>1,279,984</td><td>2,635,376</td><td>0</td><td>4,250,231</td></tr><tr><td></td><td>Foreign</td><td>20,331,252</td><td>0</td><td>0</td><td>5,713,707</td><td>26,044,959</td></tr><tr><td></td><td>3. Net Registered Tonnage</td><td>9,629,968</td><td>1,231,048</td><td>2,117,435</td><td>3,241,939</td><td>16,220,390</td></tr><tr><td></td><td>Domestic</td><td>133,843</td><td>1,231,048</td><td>2,117,435</td><td>0</td><td>3,482,326</td></tr><tr><td></td><td>Foreign</td><td>9,496,125</td><td>0</td><td>0</td><td>3,241,939</td><td>12,738,064</td></tr><tr><td></td><td>4. Deadweight Tonnage</td><td>24,926,090</td><td>2,385,036</td><td>5,022,501</td><td>9,553,190</td><td>41,886,817</td></tr><tr><td></td><td>Domestic</td><td>363,409</td><td>2,385,036</td><td>5,022,501</td><td>0</td><td>7,770,946</td></tr><tr><td></td><td>Foreign</td><td>24,562,681</td><td>0</td><td>0</td><td>9,553,190</td><td>34,115,871</td></tr><tr><td></td><td>5. Length of Vessels (m.)</td><td>254,953</td><td>105,509</td><td>278,833</td><td>60,917</td><td>700,212</td></tr><tr><td></td><td>Domestic</td><td>10,365</td><td>105,509</td><td>278,833</td><td>0</td><td>394,707</td></tr><tr><td></td><td>Foreign</td><td>244,588</td><td>0</td><td>0</td><td>60,917</td><td>305,505</td></tr><tr><td></td><td>6. Beam of Vessels (m.)</td><td>39,439</td><td>40,219</td><td>63,896</td><td>9,537</td><td>153,091</td></tr><tr><td></td><td>Domestic</td><td>1,672</td><td>40,219</td><td>63,896</td><td>0</td><td>105,787</td></tr><tr><td></td><td>Foreign</td><td>37,767</td><td>0</td><td>0</td><td>9,537</td><td>47,304</td></tr><tr><td></td><td>7. Draft of Vessels (m.)</td><td>12,465</td><td>5,777</td><td>12,514</td><td>3,095</td><td>33,851</td></tr><tr><td></td><td>Domestic</td><td>522</td><td>5,777</td><td>12,514</td><td>0</td><td>18,813</td></tr><tr><td></td><td>Foreign</td><td>11,943</td><td>0</td><td>0</td><td>3,095</td><td>15,038</td></tr><tr><td></td><td>8. Waiting Time (hrs.)</td><td>2,657</td><td>0</td><td>0</td><td>0</td><td>2,657</td></tr><tr><td></td><td>Domestic</td><td>45</td><td>0</td><td>0</td><td>0</td><td>45</td></tr><tr><td></td><td>Foreign</td><td>2,612</td><td>0</td><td>0</td><td>0</td><td>2,612</td></tr><tr><td></td><td>9. Service Time (hrs.)</td><td>49,839</td><td>195,413</td><td>456,681</td><td>42,514</td><td>744,447</td></tr><tr><td></td><td>Domestic</td><td>677</td><td>195,413</td><td>456,681</td><td>0</td><td>652,771</td></tr><tr><td></td><td>Foreign</td><td>49,162</td><td>0</td><td>0</td><td>42,514</td><td>91,676</td></tr></table>
Table 10: Summary of Cargo and Passenger by Port Classification; PMO: South Harbor at Berth and Anchorage. Philippine Port Authority vol. 1, 2002
<table><tr><td></td><td></td><td colspan="3">AT BERTH</td><td>AT ANCHORAGE</td><td rowspan="2">TOTAL</td></tr><tr><td colspan="2">PARTICULARS</td><td>Base Port</td><td colspan="2">Terminal Port - Pasig</td><td>Base Port</td></tr><tr><td></td><td></td><td>South Harbor</td><td>Government</td><td>Private</td><td>South Harbor</td><td></td></tr><tr><td colspan="2">B. CARGO AND PASSENGER</td><td></td><td></td><td></td><td></td><td></td></tr><tr><td></td><td></td><td></td><td></td><td></td><td></td><td></td></tr><tr><td colspan="2">1. Total Cargo Throughput (m.t.)</td><td>4,281,891</td><td>2,034,987</td><td>4,287,807</td><td>3,016,510</td><td>13,621,195</td></tr><tr><td></td><td></td><td></td><td></td><td></td><td></td><td></td></tr><tr><td></td><td>a. Domestic</td><td>0</td><td>2,034,987</td><td>4,287,807</td><td>0</td><td>6,322,794</td></tr><tr><td></td><td></td><td></td><td></td><td></td><td></td><td></td></tr><tr><td></td><td>Inbound</td><td>0</td><td>2,008,357</td><td>4,253,311</td><td>0</td><td>6,261,668</td></tr><tr><td></td><td>Breakbulk</td><td>0</td><td>1,711,949</td><td>42,191</td><td>0</td><td>1,754,140</td></tr><tr><td></td><td>Bulk</td><td>0</td><td>296,408</td><td>4,211,120</td><td>0</td><td>4,507,528</td></tr><tr><td></td><td>Containerized</td><td>0</td><td>0</td><td>0</td><td>0</td><td>0</td></tr><tr><td></td><td></td><td></td><td></td><td></td><td></td><td></td></tr><tr><td></td><td>Outbound</td><td>0</td><td>26,630</td><td>34,496</td><td>0</td><td>61,126</td></tr><tr><td></td><td>Breakbulk</td><td>0</td><td>26,630</td><td>2,064</td><td>0</td><td>28,694</td></tr><tr><td></td><td>Bulk</td><td>0</td><td>0</td><td>32,432</td><td>0</td><td>32,432</td></tr><tr><td></td><td>Containerized</td><td>0</td><td>0</td><td>0</td><td>0</td><td>0</td></tr><tr><td></td><td></td><td></td><td></td><td></td><td></td><td></td></tr><tr><td></td><td>b. Foreign</td><td>4,228,345</td><td>0</td><td>0</td><td>3,016,510</td><td>7,244,855</td></tr><tr><td></td><td></td><td></td><td></td><td></td><td></td><td></td></tr><tr><td></td><td>Import</td><td>3,757,841</td><td>0</td><td>0</td><td>3,016,510</td><td>6,774,351</td></tr><tr><td></td><td>Breakbulk</td><td>1,113,328</td><td>0</td><td>0</td><td>2,392,468</td><td>3,505,796</td></tr><tr><td></td><td>Bulk</td><td>26,449</td><td>0</td><td>0</td><td>624,042</td><td>650,491</td></tr><tr><td></td><td>Containerized</td><td>2,618,064</td><td>0</td><td>0</td><td>0</td><td>2,618,064</td></tr><tr><td></td><td></td><td></td><td></td><td></td><td></td><td></td></tr><tr><td></td><td>Export</td><td>470,504</td><td>0</td><td>0</td><td>0</td><td>470,504</td></tr><tr><td></td><td>Breakbulk</td><td>32,904</td><td>0</td><td>0</td><td>0</td><td>32,904</td></tr><tr><td></td><td>Bulk</td><td>0</td><td>0</td><td>0</td><td>0</td><td>0</td></tr><tr><td></td><td>Containerized</td><td>437,600</td><td>0</td><td>0</td><td>0</td><td>437,600</td></tr><tr><td></td><td></td><td></td><td></td><td></td><td></td><td></td></tr><tr><td></td><td>c. Transit Cargo</td><td>53,546</td><td>0</td><td>0</td><td>0</td><td>53,546</td></tr><tr><td></td><td>Domestic</td><td>0</td><td>0</td><td>0</td><td>0</td><td>0</td></tr><tr><td></td><td>Inward</td><td>0</td><td>0</td><td>0</td><td>0</td><td>0</td></tr><tr><td></td><td>Outward</td><td>0</td><td>0</td><td>0</td><td>0</td><td>0</td></tr><tr><td></td><td></td><td></td><td></td><td></td><td></td><td></td></tr><tr><td></td><td>Foreign (Cont.)</td><td>53,546</td><td>0</td><td>0</td><td>0</td><td>53,546</td></tr><tr><td></td><td>Import</td><td>35,117</td><td>0</td><td>0</td><td>0</td><td>35,117</td></tr><tr><td></td><td>Export</td><td>18,429</td><td>0</td><td>0</td><td>0</td><td>18,429</td></tr><tr><td></td><td></td><td></td><td></td><td></td><td></td><td></td></tr><tr><td></td><td>d. Foreign (Transhipment)</td><td>17,337</td><td>0</td><td>0</td><td>0</td><td>17,337</td></tr><tr><td></td><td></td><td></td><td></td><td></td><td></td><td></td></tr><tr><td></td><td>2. Total Passengers (Foreign)</td><td>8,646</td><td>0</td><td>0</td><td>0</td><td>8,646</td></tr><tr><td></td><td>Disembarking</td><td>4,323</td><td>0</td><td>0</td><td>0</td><td>4,323</td></tr><tr><td></td><td>Embarking</td><td>4,323</td><td>0</td><td>0</td><td>0</td><td>4,323</td></tr></table>
The Manila International Container Terminal had a total of 1,997 vessels both for berth and anchorage. There was no documented number of domestic and foreign cargo, 12,236,383 m.t., which had a total of 12,243,861 m.t. There was no documented number of passengers for MICT[16].

Table 11: Summary of Berth and Anchorage by Port Classification; Field Office. Philippine Port Authority vol. 1, 2002
<table><tr><td rowspan="2" colspan="2">PARTICULARS</td><td colspan="3">M.I.C.T</td></tr><tr><td>AT BERTH</td><td>AT ANCH.</td><td>TOTAL</td></tr><tr><td></td><td></td><td></td><td></td><td></td></tr><tr><td colspan="2">A. SHIPPING</td><td></td><td></td><td></td></tr><tr><td></td><td></td><td></td><td></td><td></td></tr><tr><td></td><td></td><td></td><td></td><td></td></tr><tr><td></td><td>1. Number of Vessels</td><td>1,962</td><td>35</td><td>1,997</td></tr><tr><td></td><td>Domestic</td><td>11</td><td>0</td><td>11</td></tr><tr><td></td><td>Foreign</td><td>1,951</td><td>35</td><td>1,986</td></tr><tr><td></td><td></td><td></td><td></td><td></td></tr><tr><td></td><td>2. Gross Registered Tonnage</td><td>28,006,484</td><td>562,536</td><td>28,569,020</td></tr><tr><td></td><td>Domestic</td><td>32,568</td><td>0</td><td>32,568</td></tr><tr><td></td><td>Foreign</td><td>27,973,916</td><td>562,536</td><td>28,536,452</td></tr><tr><td></td><td></td><td></td><td></td><td></td></tr><tr><td></td><td>3. Net Registered Tonnage</td><td>13,069,339</td><td>325,030</td><td>13,394,369</td></tr><tr><td></td><td>Domestic</td><td>13,561</td><td>0</td><td>13,561</td></tr><tr><td></td><td>Foreign</td><td>13,055,778</td><td>325,030</td><td>13,380,808</td></tr><tr><td></td><td></td><td></td><td></td><td></td></tr><tr><td></td><td>4. Deadweight Tonnage</td><td>34,177,447</td><td>955,390</td><td>35,132,837</td></tr><tr><td></td><td>Domestic</td><td>38,503</td><td>0</td><td>38,503</td></tr><tr><td></td><td>Foreign</td><td>34,138,944</td><td>955,390</td><td>35,094,334</td></tr><tr><td></td><td></td><td></td><td></td><td></td></tr><tr><td></td><td>5. Length of Vessels (m.)</td><td>317,773</td><td>5,475</td><td>323,248</td></tr><tr><td></td><td>Domestic</td><td>1,019</td><td>0</td><td>1,019</td></tr><tr><td></td><td>Foreign</td><td>316,754</td><td>5,475</td><td>322,229</td></tr><tr><td></td><td></td><td></td><td></td><td></td></tr><tr><td></td><td>6. Beam of Vessels (m.)</td><td>48,849</td><td>897</td><td>49,746</td></tr><tr><td></td><td>Domestic</td><td>161</td><td>0</td><td>161</td></tr><tr><td></td><td>Foreign</td><td>48,688</td><td>897</td><td>49,585</td></tr><tr><td></td><td></td><td></td><td></td><td></td></tr><tr><td></td><td>7. Draft of Vessels (m.)</td><td>16,628</td><td>322</td><td>16,950</td></tr><tr><td></td><td>Domestic</td><td>59</td><td>0</td><td>59</td></tr><tr><td></td><td>Foreign</td><td>16,569</td><td>322</td><td>16,891</td></tr><tr><td></td><td></td><td></td><td></td><td></td></tr><tr><td></td><td>8. Waiting Time (hrs.)</td><td>7,239</td><td>0</td><td>7,239</td></tr><tr><td></td><td>Domestic</td><td>33</td><td>0</td><td>33</td></tr><tr><td></td><td>Foreign</td><td>7,206</td><td>0</td><td>7,206</td></tr><tr><td></td><td></td><td></td><td></td><td></td></tr><tr><td></td><td>9. Service Time (hrs.)</td><td>22,240</td><td>8,714</td><td>30,954</td></tr><tr><td></td><td>Domestic</td><td>35</td><td>0</td><td>35</td></tr><tr><td></td><td>Foreign</td><td>22,205</td><td>8,714</td><td>30,919</td></tr></table>
Table 12: Summary of Cargo and Passenger by Port Classification; MICT Field Office. Philippine Port Authority vol. 1, 2002
<table><tr><td rowspan="2" colspan="2">PARTICULARS</td><td colspan="3">M.I.C.T</td></tr><tr><td>AT BERTH</td><td>AT ANCH.</td><td>TOTAL</td></tr><tr><td colspan="2">B. CARGO AND PASSENGER</td><td></td><td></td><td></td></tr><tr><td></td><td>1. Total Cargo Throughput (m.t)</td><td>11,723,988</td><td>519,873</td><td>12,243,861</td></tr><tr><td></td><td>a. Domestic</td><td>0</td><td>0</td><td>0</td></tr><tr><td></td><td>Inbound</td><td>0</td><td>0</td><td>0</td></tr><tr><td></td><td>Breakbulk</td><td>0</td><td>0</td><td>0</td></tr><tr><td></td><td>Bulk</td><td>0</td><td>0</td><td>0</td></tr><tr><td></td><td>Containerized</td><td>0</td><td>0</td><td>0</td></tr><tr><td></td><td>Outbound</td><td>0</td><td>0</td><td>0</td></tr><tr><td></td><td>Breakbulk</td><td>0</td><td>0</td><td>0</td></tr><tr><td></td><td>Bulk</td><td>0</td><td>0</td><td>0</td></tr><tr><td></td><td>Containerized</td><td>0</td><td>0</td><td>0</td></tr><tr><td></td><td>b. Foreign</td><td>11,716,510</td><td>519,873</td><td>12,236,383</td></tr><tr><td></td><td>Import</td><td>7,100,543</td><td>519,873</td><td>7,620,416</td></tr><tr><td></td><td>Breakbulk</td><td>16,520</td><td>0</td><td>16,520</td></tr><tr><td></td><td>Bulk</td><td>0</td><td>519,873</td><td>519,873</td></tr><tr><td></td><td>Containerized</td><td>7,084,023</td><td>0</td><td>7,084,023</td></tr><tr><td></td><td>Export</td><td>4,615,967</td><td>0</td><td>4,615,967</td></tr><tr><td></td><td>Breakbulk</td><td>0</td><td>0</td><td>0</td></tr><tr><td></td><td>Bulk</td><td>0</td><td>0</td><td>0</td></tr><tr><td></td><td>Containerized</td><td>4,615,967</td><td>0</td><td>4,615,967</td></tr><tr><td></td><td>c. Transit Cargo</td><td>7,478</td><td>0</td><td>7,478</td></tr><tr><td></td><td>Domestic (Cont.)</td><td>7,478</td><td>0</td><td>7,478</td></tr><tr><td></td><td>Inward</td><td>3,490</td><td>0</td><td>3,490</td></tr><tr><td></td><td>Outward</td><td>3,988</td><td>0</td><td>3,988</td></tr><tr><td></td><td>Foreign</td><td>0</td><td>0</td><td>0</td></tr><tr><td></td><td>Inward</td><td>0</td><td>0</td><td>0</td></tr><tr><td></td><td>Outward</td><td>0</td><td>0</td><td>0</td></tr><tr><td></td><td>d. Foreign (Transshipment)</td><td>475,676</td><td>0</td><td>475,676</td></tr><tr><td></td><td>2. Total Passengers</td><td>0</td><td>0</td><td>0</td></tr><tr><td></td><td>Disembarking</td><td>0</td><td>0</td><td>0</td></tr><tr><td></td><td>Embarking</td><td>0</td><td>0</td><td>0</td></tr></table>
In 2002, a total of 3,463,629 containers in 20-foot equivalent units (TEU) was collected by the Philippine Ports Authority; the domestic container traffic contained an amount of 1,672,118 and 1,791 511 different container traffic. As for the base port, a total of 3,270,796 TEU. The province of Cagayan de Oro had the highest accumulated total of 182,169 base port, and Surigao had the lowest total of 5,624 TEU; the Manila
South Harbor, 612,487 TEU; MICT, 1,040,910 TEU; Manila North Harbor, 808,772 TEU $^{17}$.
There were no documented Containerized Cargo in Metric tons as per the available data.
The total domestic cargo commodity in 2002 for PMO North Harbor was 7,612,919: 1,596,000 for breakbulk, 329,608 for bulk, and 4,896,049 for containerized cargo. The inbound had 3,862,954,
917,485 for breakbulk, 985,407 for Bulk, and 1,960,062 for containerized. The outbound had 3,749,965, 751,030 for breakbulk, 62,948 for Bulk, and 2,935,987 for containerized. $^{18}$
In 2002, PMO South Harbor was one of the country's gateways, especially to international shipping and trade; the management of the Port Management Office of the South Harbor or PMO- South Harbor, which is an organization part of and under the Port District of Manila/Northern Luzon or PDO Manila/Northern Luzon. The PMO South Harbor included some jurisdictions around the Terminal Management Office of Pasig or TMO-Pasig in Manila Bay.
The PMO South Harbor has five piers numbered 3,5,9,13, and 15; these are massive piers measuring from 83m to 103m wide by 380m to 614m long. Massive piers were used for international purposes, and as part of the development of the South Harbor is the continuous rehabilitation of the ports, especially the piers used for the number of operations, such as piers 3 and 5, generally used for container operations, which are being served to number container operations. At the same time, the Berth1 for Pier 15 is a passenger line for foreign military vessels. Asian Terminals Inc. (ATI) is one of the cargo handling services responsible for handling services such as truck scale, lighterage, trucking, brokerage, cargo checking, and import and export services $^{19}$.
Because of the increased number of services and passengers in port, Berths 1, 2 and 4 of Pier 15 were used as accommodation in cruise and tourist vessels. The accommodation for the passengers and parking areas were also established for vehicle use other vehicles such as visiting ships foreign and navy vessels.
Located at the shoreline of the Tondo District, which is regarded to be the leading domestic port, North Harbor can accommodate all inter-island vessels. Six central piers catered to coastwise cargo and passenger ships. North Harbor also includes Isla Putting Bato, Vitas, Pier 2, Terminal 16, and Marine Slipway. These are used for daily living, such as fishing boats,battles, and smaller ships. The total number of areas is 52.47 hectares; the quality length is about $5,200\mathrm{m}$, including Marine Slipway and Isla Putting Bato. North Harbor is identified as a catalyst, especially in Domestic Commerce.
The facilities used in North Harbor were extensively for passenger accommodation. The services of Manila North Harbor were not only in Metro Manila but also in the provinces of Bulacan, Tarlac, Nueva Ecija, and Nueva Vizcaya in the Northern part of the Philippines. Rizal, Cavite, Laguna, Batangas, and Quezon were also under the PMO- North Harbor of facilities used for handling coastwise general cargoes and passenger accommodation. Along the piers were 41 berths with water ranging from 4.5 to $6.0\mathrm{m}$. In 1978, it experienced several containers used for transporting goods within and outside Metro Manila. 1996 the port also underwent rehabilitation under the North Harbor Rehabilitation and Development of Domestic Port Project. This project was financed by the Asian Development Bank and Philippine Ports Authority Local Fund and cost PHP 879,750,08. It included marine works, pavement works, building facilities, utility works, and electrical works.[20]
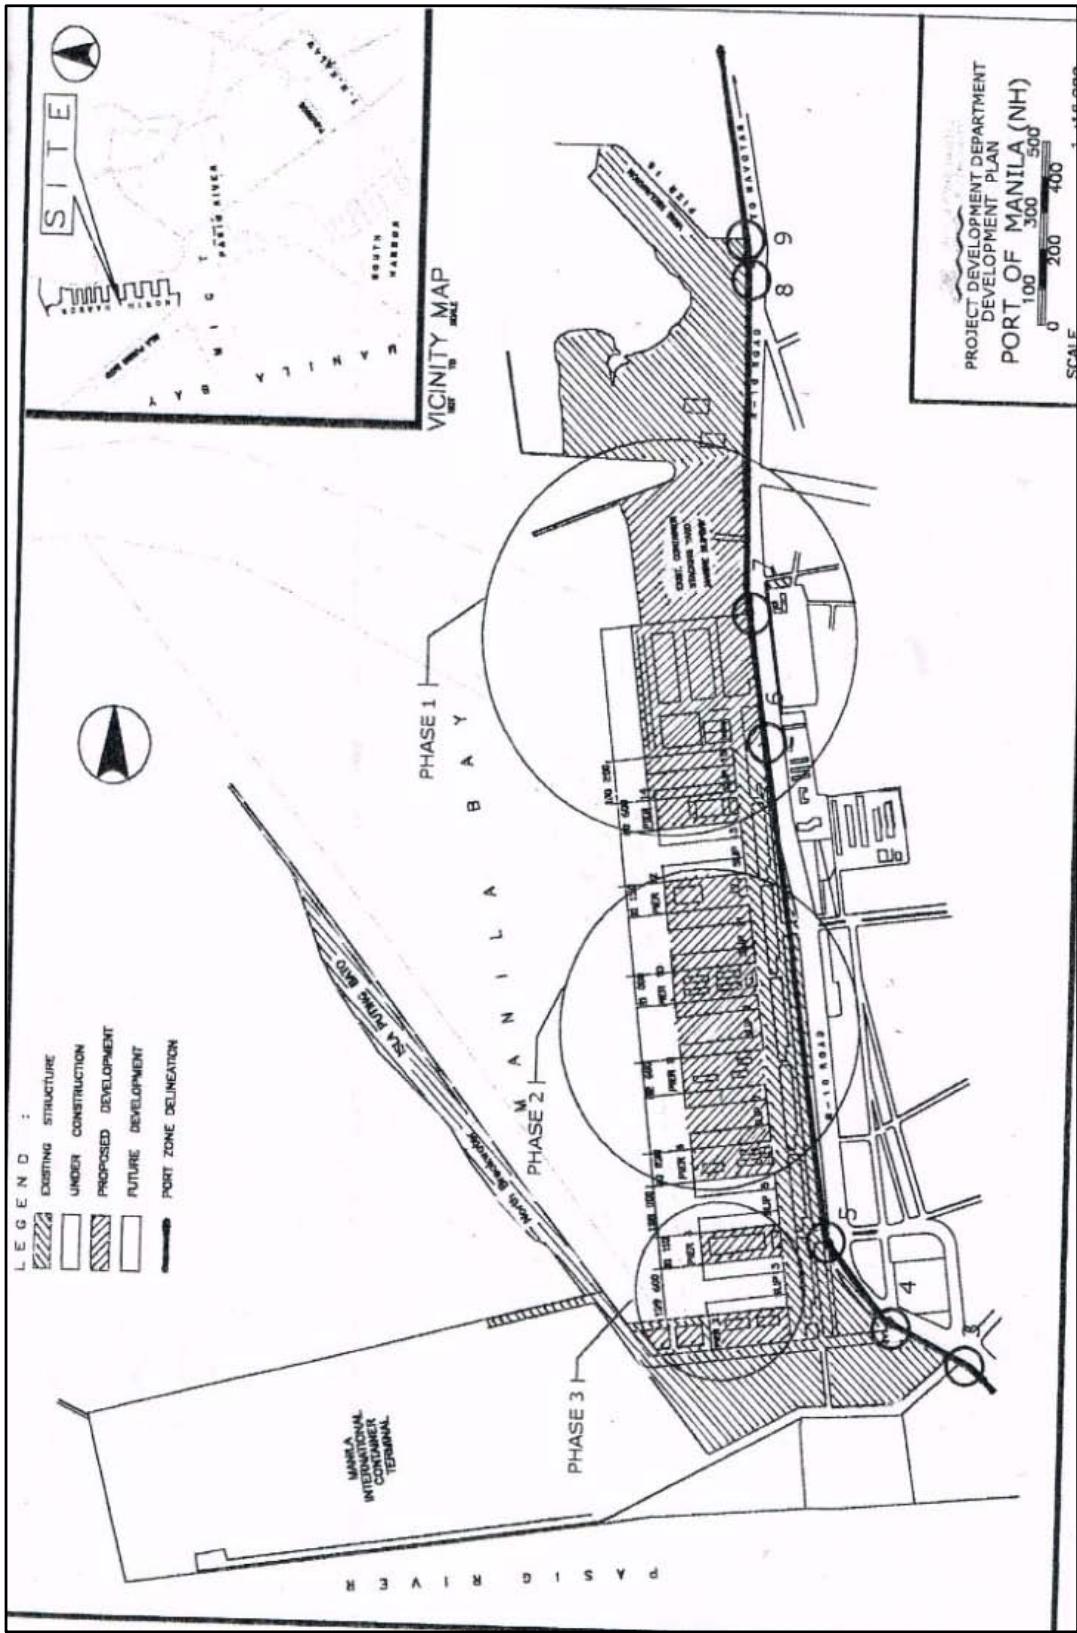 Figure 3: Port of Manila, North Harbor. Profile of Philippine Ports Third Edition
In 2003, the Manila International Container Terminal had a total of 1976 vessels for berth and anchorage, of which only two were domestic and 1,938 were foreign. The number of domestic waiting hours was 8 hours and 5,158 hours for foreign for a total of 5,166 for both berth and anchorage, while the domestic service time was 5 hours and 30,012 hours for foreign for a total of 30,017 hours for both berth and anchorage. There was no documented total number of domestic cargo, while there was 13,193,668 international cargo for
both berth and anchorage. Moreover, there was no documented total number of passengers for MICT $^{21}$.
In the year 2003, the North Manila Harbor had a total of 6,364 vessels, of which 6,266 vessels were domestic and 98 vessels were foreign; the service time for the domestic vessels was 379,916 hours, while the domestic service time was 11,412 hours. During the waiting time, there was no documented data about the said data. The cargo circulated within the North Manila Harbor had a total of 16,449,814. The domestic vessels had 15,683,819 cargo and 514,427 cargo for the foreign; the remaining cargo was for transit cargo. Moreover, 3,367,936 passengers went to the North Manila Harbor in 2003[22].
On the aspect of commodities in the North Manila Harbor, it was shown that the highest inbound commodity got a total of 4,196,948, and the other general cargo was the highest inbound commodity, which yielded 954,857, and its lowest inbound commodity was molasses, showed a total of 13. In the scene of outbound commodity, it was examined that the total commodity was 4,057,349 and that the highest outbound commodity was the other general cargos, which yielded 2,269,034. Moreover, the lowest outbound commodity was the copra. Moreover, the total cargo for the commodities was 8,254,297;the highest total commodity was the other general cargo, which displayed 3,223,891 cargos, and the lowest was the molasses, which had a total of only $86^{23}$.
At PMO-South Harbor Manila, there were a total of 9,617 number of vessels for both berth and anchorage. A total of 3,609 hours was for waiting time, where 15 hours was for domestic and 3,594 hours were foreign, while there were 582,356 hours for domestic and 69,991 hours for Foreign Service time for a total of 652,347 hours for both berth and anchorage. The total number of cargoes embarked at the South Harbor was 13,381,951, 6,292,847 domestic and 7,051,209 foreign. Also, 617,855 foreign passengers were documented for both embarking and disembarking[24].
In South Manila Harbor, the inbound commodity got a total of 12,020,175, and its highest commodity was iron and steel, which showed 4,035,161 cargos. In the aspect of its outbound commodity, it totaled 1,361,776 cargos, and the highest commodity of the outbound was the other general cargo, which showed 758,409 cargos. Moreover, the least outbound commodities were the logs and copra, which had no cargo. The total of the commodity of the South Manila Harbor was 13,381,951, and the total peak commodity was iron and steel, which displayed 4,069,334 cargos, and the smallest amount of commodity in the South Manila Harbor was the copra, which had a total of 1,793 cargos[25].
In 2004, the PMO- Manila North Harbor had 6,292 vessels for a berth and no documented vessels for anchorage. The total number of Cargo passengers for domestic was 14,777,296 m.t; foreign, 1,443,722 m.t., which yielded a total of 16,324,756 m.t. The total number of passengers in Manila North Harbor was $2,539,668^{26}$.
Table 13: Summary of Shipping Statistics by Port Classification; PMO: North Harbor at Berth and Anchorage. Philippine Port Authority vol. 1, 2004
<table><tr><th rowspan="2" colspan="2">PARTICULARS</th><th colspan="2">AT BERTH</th><th rowspan="2">TOTAL</th></tr><tr><th>Euro Part</th><th>Private Part</th></tr><tr><td></td><td></td><td></td><td></td><td></td></tr><tr><td colspan="2">A. SHIPPING</td><td></td><td></td><td></td></tr><tr><td></td><td></td><td></td><td></td><td></td></tr><tr><td></td><td></td><td></td><td></td><td></td></tr><tr><td colspan="2">1. Number of Vessels</td><td>5,398</td><td>834</td><td>6,292</td></tr><tr><td></td><td>Domestic</td><td>5,398</td><td>628</td><td>6,026</td></tr><tr><td></td><td>Foreign</td><td>0</td><td>266</td><td>266</td></tr><tr><td></td><td></td><td></td><td></td><td></td></tr><tr><td colspan="2">2. Gross Registered Tonnage</td><td>20,834,745</td><td>2,119,007</td><td>23,013,752</td></tr><tr><td></td><td>Domestic</td><td>20,834,745</td><td>331,434</td><td>21,286,233</td></tr><tr><td></td><td>Foreign</td><td>0</td><td>1,727,513</td><td>1,727,513</td></tr><tr><td></td><td></td><td></td><td></td><td></td></tr><tr><td colspan="2">3. Net Registered Tonnage</td><td>10,912,056</td><td>1,223,153</td><td>12,141,215</td></tr><tr><td></td><td>Domestic</td><td>10,912,056</td><td>235,360</td><td>11,207,416</td></tr><tr><td></td><td>Foreign</td><td>0</td><td>933,799</td><td>933,799</td></tr><tr><td></td><td></td><td></td><td></td><td></td></tr><tr><td colspan="2">4. Deadweight Tonnage</td><td>15,587,450</td><td>3,439,513</td><td>19,066,963</td></tr><tr><td></td><td>Domestic</td><td>15,587,450</td><td>757,363</td><td>16,344,833</td></tr><tr><td></td><td>Foreign</td><td>0</td><td>2,742,124</td><td>2,742,124</td></tr><tr><td></td><td></td><td></td><td></td><td></td></tr><tr><td colspan="2">5. Length of Vessels (m.)</td><td>502,260</td><td>57,238</td><td>559,558</td></tr><tr><td></td><td>Domestic</td><td>502,260</td><td>31,824</td><td>534,084</td></tr><tr><td></td><td>Foreign</td><td>0</td><td>25,474</td><td>25,474</td></tr><tr><td></td><td></td><td></td><td></td><td></td></tr><tr><td colspan="2">6. Beam of Vessels (m.)</td><td>84,336</td><td>11,332</td><td>95,668</td></tr><tr><td></td><td>Domestic</td><td>84,336</td><td>6,630</td><td>91,026</td></tr><tr><td></td><td>Foreign</td><td>0</td><td>4,642</td><td>4,642</td></tr><tr><td></td><td></td><td></td><td></td><td></td></tr><tr><td colspan="2">7. Draft of Vessels (m.)</td><td>24,059</td><td>3,218</td><td>27,277</td></tr><tr><td></td><td>Domestic</td><td>24,059</td><td>1,865</td><td>25,924</td></tr><tr><td></td><td>Foreign</td><td>0</td><td>1,353</td><td>1,353</td></tr><tr><td></td><td></td><td></td><td></td><td></td></tr><tr><td colspan="2">8. Waiting Time (hrs.)</td><td>0</td><td>0</td><td>0</td></tr><tr><td></td><td>Domestic</td><td>0</td><td>0</td><td>0</td></tr><tr><td></td><td>Foreign</td><td>0</td><td>0</td><td>0</td></tr><tr><td></td><td></td><td></td><td></td><td></td></tr><tr><td colspan="2">9. Service Time (hrs.)</td><td>306,376</td><td>77,448</td><td>383,824</td></tr><tr><td></td><td>Domestic</td><td>306,376</td><td>50,760</td><td>357,136</td></tr><tr><td></td><td>Foreign</td><td>0</td><td>26,688</td><td>26,688</td></tr></table>


The Manila International Container Terminal had a total of 2,061 vessels both for berth and anchorage. There is no documentation of the total number of domestic cargo.; foreign, 14,392,524 m.t. moreover, a total of 14,398,032 m.t., and no documented total number of passengers for MICT $^{27}$.
In 2004, the Philippine Ports Authority collected a total of 3,785,466 numbers of the container in twenty equivalent units (TEU); the domestic container traffic contained an amount of 1,761,967 and 2,023,499 different container traffic. As for the base port, there was a total of 3,602,668 TEU. Davao (Sasa) had the highest accumulates with a total of 226,018 base port, and Calapan with the lowest total of 72 TEU; the Manila
South Harbor, 827,754 TEU; MICT, 1,205,199 TEU; Manila North Harbor, 665,509 TEU $^{28}$.
The Containerized Cargo in metric tons accumulated a total of 45,083,340 and a scale of 25,474,430 for domestic and 19,608,910 for foreign containerized cargo. The base port in containerized cargo had a total of 42,430,941 metric tons. The province of Cagayan de Oro had the highest total number of containerized cargo of 12,480,911 M.T. and
Calapanhad the lowest total of 280 M.T.; Manila South Harbor, 6,611,418 M.T.; MICT, 13,763,883 M.T.; Manila North Harbor, 12,101,815 M.T. 29
The total domestic cargo commodity in 1999 for PMO North Harbor was 2,315,387: 630,876 for breakbulk, 172,770 for bulk, and 1,511,741 for containerized cargo. The inbound had a total 1,656,780; 597,406 for breakbulk, 476,928 for Bulk, and 616,094 for containerized. The outbound totaled 1,298,359, 353,505 for breakbulk, 15,505 for Bulk, and 929,349 for containerized.[30]
The total domestic cargo commodity in 1999 for PMO South Harbor was 8,082,175: 1,445,622 for breakbulk, 4,118,024 for bulk, and 2,518,529 for containerized cargo. The inbound had 12,514,069, 3,399,759 for breakbulk, 4,466,590 for Bulk, and 4,647,720 for containerized. The outbound totaled 2,041,412, 47,150 for breakbulk, 30,564 for bulk, and 1,963,698 for containerized.[31]
The generally enhanced business and economic climate characterized by the significant improvement in foreign trade and favorable ratings and a market assessment made by various international credit rating organizations generated an upbeat prognosis for the Philippine economy in 2006. The PPA policy that strongly advocated measures on financial discipline and prudent fund management enabled it to weather complex challenges and kept its overall financial performance relatively stable for 2006.
The relatively stable financial performance of the Revenue continued in 2006 when it generated gross revenues of PHP 6,018 million, up by $1.65\%$ or PHP 97.85 million from PHP 5,920 million posted in 2005. Port operations earned PHP 5,772 million, a $2.05\%$ rise from the previous year's earnings of P5,862 million.
The PPA generated a share amount of P2.10 billion, composed of these shares were the fixed and variable fees from its authorized port operators, the Manila International Container Terminals followed by revenues from wharfage atPhp 1.20 billion or $20\%$; government share on Arrastre and stevedoring atPhp 1.04 billion or $17\%$ port dues and dockage atPhp 811 million or $13\%$ and other income atphp 425 million.
The revenue by tariff items increased on the following foreign vessel charges: wharfage (foreign), share in Arrastre/ Stevedoring, and other income, including revenue from non-traditional income and individual take-over units.
Expenditures, on the other hand, were expense side; actual spending for 2006 stood at $\mathsf{Php}3,232$ million, which was $3.57\%$ higher than the previous year's expenditures of $\mathsf{Php}3,117$ million, notwithstanding austerity measures in place, due notably to higher actual spending on repair and maintenance of ports nationwide, which soared by $127\%$, because of the increasing number of ports and facilities maintain along with the rise in the cost of utilities and other services.
Table 18: Cargo Throughput in metric tons for berth and anchorage from the Port District/Port Management Office. Philippine Ports Authority, 2006 Annual Report p.26
<table><tr><td rowspan="2">PDO/PMO</td><td colspan="3">2006</td><td colspan="3">2005</td></tr><tr><td>Total</td><td>Domestic</td><td>Foreign</td><td>Total</td><td>Domestic</td><td>Foreign</td></tr><tr><td>PDO-Manila/Northern Luzon</td><td>65,261,422</td><td>26,975,428</td><td>8,2285,994</td><td>65,861,349</td><td>28224,922</td><td>37,636,427</td></tr><tr><td>North Harbor</td><td>16,731,148</td><td>13,766,511</td><td>2,956,637</td><td>16,192,794</td><td>13,191,003</td><td>3,001,791</td></tr><tr><td>South Harbor</td><td>12,940,052</td><td>6,885,423</td><td>6,054,629</td><td>13,696,464</td><td>7,931,814</td><td>5,764,650</td></tr><tr><td>MICT</td><td>14,489,198</td><td>924</td><td>14,488,274</td><td>14,851,220</td><td>2,894</td><td>14,848,326</td></tr></table>
Table 19: Number of Ship calls metric tons for berth and anchorage from Port District/Port Management Office. Philippine Ports Authority, 2006 Annual Report p.27
<table><tr><td rowspan="2">PDO/PMO</td><td colspan="3">2006</td><td colspan="3">2005</td></tr><tr><td>Total</td><td>Domestic</td><td>Foreign</td><td>Total</td><td>Domestic</td><td>Foreign</td></tr><tr><td>PDO-Manila/Northern Luzon</td><td>24,406</td><td>19,326</td><td>5,080</td><td>27,049</td><td>21,740</td><td>5,309</td></tr><tr><td>North Harbor</td><td>5,559</td><td>5,054</td><td>505</td><td>5,403</td><td>4,932</td><td>471</td></tr><tr><td>South Harbor</td><td>8,006</td><td>6,252</td><td>1,754</td><td>8,977</td><td>7,172</td><td>1,805</td></tr><tr><td>MICT</td><td>2,031</td><td>1</td><td>2,030</td><td>2,046</td><td>4</td><td>2,042</td></tr></table>
Table 20: Number of containers handled in the Twenty Foot Equivalent Unit or T.E.U. from Port District/Port Management Office. Philippine Ports Authority, 2006 Annual Report p.28
<table><tr><td rowspan="2">PDO/PMO</td><td colspan="3">2006</td><td colspan="3">2005</td></tr><tr><td>Total</td><td>Domestic</td><td>Foreign</td><td>Total</td><td>Domestic</td><td>Foreign</td></tr><tr><td>PDO-Manila/Northern Luzon</td><td>2,722,168</td><td>810,324</td><td>1,911,844</td><td>2,662,725</td><td>813,604</td><td>1,849,121</td></tr><tr><td>North Harbor</td><td>608,017</td><td>608,017</td><td>0</td><td>578,621</td><td>578,621</td><td>0</td></tr><tr><td>South Harbor</td><td>916,277</td><td>199,970</td><td>716,307</td><td>873,284</td><td>232,222</td><td>641,062</td></tr><tr><td>MICT</td><td>1,195,023</td><td>42</td><td>1,194,981</td><td>1,208,232</td><td>216</td><td>1,208,016</td></tr></table>
Table 21: As for Berth and Anchorage, the number of passenger traffic by Port District/ Port Management Office. Philippine Ports Authority, 2006 Annual Report p.29
<table><tr><td rowspan="2"></td><td rowspan="2">PDO/PMO</td><td colspan="3">2006</td><td colspan="3">2005</td></tr><tr><td>Total</td><td>Domestic</td><td>Foreign</td><td>Total</td><td>Domestic</td><td>Foreign</td></tr><tr><td></td><td>PDO-Manila/Northern Luzon</td><td>3,197,927</td><td>1,653,960</td><td>1,543,967</td><td>4,058,822</td><td>2,087,630</td><td>1,971,192</td></tr><tr><td></td><td>North Harbor</td><td>1,357,882</td><td>701,174</td><td>656,708</td><td>1,770,937,</td><td>941,758</td><td>829,179</td></tr><tr><td></td><td>South Harbor</td><td>1,776,429</td><td>919,868</td><td>856,561</td><td>1,988,593</td><td>996,532</td><td>992,061</td></tr><tr><td></td><td>MICT</td><td>0</td><td>0</td><td>0</td><td>0</td><td>0</td><td>0</td></tr></table>
In 2007, the Philippine Ports Authority's results with port operations saw moderate growth of $3.97\%$ in gross revenue at Php 6.246 billion 2007. Specifically, revenues from the port operations reached Php 6.094 billion, or a $5.59\%$ rise from the previous year's port earnings of Php 5.772 billion. The PDO Manila/Northern Luzon, PDO Southern Luzon, PDO Northern Mindanao, and PDO Visayas retained a top earner; meanwhile the PDO Visayas also retained the status of posting a higher percentage of revenue among the number of PDO[32].
The PPA's capital expenditures reached its highest level in 2007 at Php 6.003 billion. Some capital investment consisted of several projects for the priority gateways ports, entailing revenues from the wharfages accounted for the revenue sources, including Arrastre and Stevedoring, Vessels, Fees, Fund Management Income, and Other Income.
In 2007, total cargo rose to 157.44 MMT from 154.4 MMT in 2006, a modest growth of $2.01\%$ in general export cargo and foreign containerized cargo overload. The growth of containerized cargoprovided overall growth despite the performance in domestic traffic and the decline of the different import volumes. The total of foreign export cargo was 33..38 Million Metric Tons in 2007, while for the previous year, it was $15.38\%$. Total foreign conventional cargo increased only $1.66\%$ compared to domestic cargo, which was $2.40\%$ $^{33}$.
There was growth in exports; import cargo suffered and dropped to $5.51\%$. The top five ports in terms of foreign cargo are MICT with 15.60 Million Metric Tons; PMO Batangas, 13.12 Million Metric Tons; PMO Limay, 11.54 Million Metric Tons; PMO Surigao, 8.33 Million Metric Tons and South Harbor, 6.49 Million Metric Tons.[34]
The involvement of the container traffic had $5.6\%$ growth in 2007, and its growth was above the $10\%$ of the foreign containerized traffic. Moreover, exports were $13.08\%$, and imports rose $12.28\%$.
For 2007, 35 port operators were issued special permits to operate some ports nationwide. These private port operators handled bulk solid and liquid cargoes. The cargo handling service depends on the amount of cargo and its trading classification, whether foreign or domestic and containerized or non-containerized[35].
In 2007, the Philippine Ports Authority completed 60 locally-funded projects or LFP with a total cost of Php 2,675 billion and 78 ongoing projects, which would be completed in the next few years. A total of Php 5,795.38 million for the major gateways and the Super Region pier components composed of Strong Republic Nautical Highway (SRNH) and Ro-Ro ports[36].
The Philippine Ports Authority regularly sets aside several budgets for repair and maintenance. In 2007, PHP 492 million pesos were allocated to over a hundred ports nationwide. Some repair projects were also included in 200 programs; 50 of 68 projects were inaugurated this year, while 8 out of 10 were under the procurement stage.
In 2007, the PPA's gross revenue grew by $3.79\%$, higher than the previous year—a total of $\text{Php} 6,246$ billion from last year's $\text{Php} 6,018$ billion. The revenue from the port operations reached $\text{Php} 6,094$ billion from the previous total revenue of $\text{Php} 5,72$ billion. ICTSI still held the most significant contributor to Philippine Ports Authority revenue; it contributed $\text{Php} 2,164$ billion[37].
The second largest revenue source from the wharfage fees at P1,314 billion covered $21\%$ of the total revenue in the said year. It was followed by arrastre and stevedoring at P1,106 billion, while other sources also led to the increase of the revenue of PPA in 2007: vessel charges at P881 million, other income at P427 million, Storage Fees at P196 million, Fund Management Income at P151 million and lastly Pilotage Fees at P3 million.[38]
The following contributors to the Philippine Ports Authority are public and private ports under the PDO Manila/North Luzon with about P2,036 billion (excluding ICTSI) and PDO South Luzon, a total of P622.01 million, PDO Northern Mindanao with P489.46 million, PDO Southern Mindanao with P450. Moreover, PDO Visayas with P354.07 million.[39]
Table 22: Cargo Throughput by Port District/ Port Management Office at Berth and Anchorage, In Metric Tons. Philippine Ports Authority, 2007 Annual Report p.28
<table><tr><td rowspan="2">PDO/PMO</td><td colspan="3">2007</td><td colspan="3">2006</td></tr><tr><td>Total</td><td>Domestic</td><td>Foreign</td><td>Total</td><td>Domestic</td><td>Foreign</td></tr><tr><td>PDO-Manila/Northern Luzon</td><td>66,914,078</td><td>27,975,751</td><td>38,938,327</td><td>65,261,442</td><td>26,975,428</td><td>38,285,994</td></tr><tr><td>North Harbor</td><td>18,291,789</td><td>15,543,183</td><td>2,748,601</td><td>16,723,148</td><td>13,766,511</td><td>2,956,637</td></tr><tr><td>South Harbor</td><td>12,094,491</td><td>5,603,583</td><td>6,490,908</td><td>12,940,052</td><td>6,885,423</td><td>6,054,629</td></tr><tr><td>MICT</td><td>15,761,302</td><td>155,498</td><td>15,605,804</td><td>14,489,198</td><td>924</td><td>14,488,274</td></tr></table>
Table 23: Number of Ship calls by Port District/Port Manager Office at Berth and Anchorage. Philippine Ports Authority, 2007 Annual Report p.29
<table><tr><td rowspan="2">PDO/PMO</td><td colspan="3">2007</td><td colspan="3">2006</td></tr><tr><td>Total</td><td>Domestic</td><td>Foreign</td><td>Total</td><td>Domestic</td><td>Foreign</td></tr><tr><td>PDO-Manila/Northern Luzon</td><td>24,210</td><td>18,918</td><td>5,292</td><td>24,406</td><td>19,326</td><td>5,080</td></tr><tr><td>North Harbor</td><td>5,368</td><td>4,899</td><td>469</td><td>5,559</td><td>5,054</td><td>505</td></tr><tr><td>South Harbor</td><td>8,177</td><td>6,272</td><td>1,905</td><td>8,006</td><td>6,252</td><td>1,754</td></tr><tr><td>MICT</td><td>2,168</td><td>27</td><td>2,141</td><td>2.031</td><td>1</td><td>2,030</td></tr></table>
Table 24: Number of containers handled in T.E.U. By Port District/Port Management Office. Philippine Ports Authority, 2007 Annual Report p.30
<table><tr><td rowspan="2">PDO/PMO</td><td colspan="3">2007</td><td colspan="3">2006</td></tr><tr><td>Total</td><td>Domestic</td><td>Foreign</td><td>Total</td><td>Domestic</td><td>Foreign</td></tr><tr><td>PDO-Manila/Northern Luzon</td><td>2,945,828</td><td>819,097</td><td>2,126,731</td><td>2,722,168</td><td>810,324</td><td>1,911,844</td></tr><tr><td>North Harbor</td><td>690,531</td><td>690,531</td><td>0</td><td>608,017</td><td>608,017</td><td>0</td></tr><tr><td>South Harbor</td><td>880,789</td><td>112,157</td><td>768,632</td><td>916,277</td><td>199,970</td><td>716,307</td></tr><tr><td>MICT</td><td>1,371,731</td><td>14,291</td><td>1,357,440</td><td>1,195,023</td><td>42</td><td>1,194,981</td></tr></table>
<table><tr><td rowspan="2">PDO/PMO</td><td colspan="3">2007</td><td colspan="3">2006</td></tr><tr><td>Total</td><td>Domestic</td><td>Foreign</td><td>Total</td><td>Domestic</td><td>Foreign</td></tr><tr><td>PDO-Manila/Northern Luzon</td><td>2,793,341</td><td>1,460,576</td><td>1,322,765</td><td>,197,9227</td><td>1,653,460</td><td>1,543,467</td></tr><tr><td>North Harbor</td><td>1,381,584</td><td>734,225</td><td>647,359</td><td>1,357,882</td><td>701,174</td><td>656,708</td></tr><tr><td>South Harbor</td><td>1,401,648</td><td>721,435</td><td>680,21</td><td>1,776,429</td><td>919,868</td><td>856,561</td></tr><tr><td>MICT</td><td>0</td><td>0</td><td>0</td><td>0</td><td>0</td><td>0</td></tr></table>
The Philippine Ports Authority managed to sustain a healthy pace in revenue, especially in 2006, with Php 6,626 billion earnings. Top revenue sources came from ICTSI fees, wharfages, and arrastre/ stevedoring alone, contributing nearly $75\%$ to its gross revenue. Other revenue sources such as Dockage Fees, Port Dues, Storage Fees, Port Usage Fees, Terminal Fees, Other Income, and Fund Management Income were the remaining $25\%$ of the PPA revenues.
The global recession in the Philippine economy was profoundly affected by the cargo volume, especially in port businesses. The accumulated total number of cargo in 2008 was 11.53 Million Metric Tons; Domestic Cargoes accumulate a total of 2.58 Million Metric Tons, and Foreign Cargo was 8.95 Million Metric Tons while products such as mineral ores, lime cold rolled coils, and coconut oils were an evident product which declines into the market and also led to the decline of foreign cargoes in the following Port Management Offices namely: Cagayan de Oro-4..03 MMT; Surigao - 4.14 MMT; Dumaguete - 0.18 MMT; Nasipit 0.61 MMT; and Tagbilaran - 0..046 MMT. Meanwhile, Domestic Cargoes were also affected by the global turnover: Cagayan de Oro - 0.96 MMT, Batangas - 0.7 MMT, and Davao - 0.40 MMT $^{40}$.
The Manila International Container Terminal Services Inc., or MICT, recorded its value of 1.49 MMT. Containerized cargo reached a total of 4.09 MMT while domestic cargo reached a total of 4.09 MMT. Foreign cargoes that passed through the Philippine Ports and passed in MICT and South Harbor consisted of 2.37 MMT. Other Port Management Offices also showed growth: Puerto Princesa, Batangas Tagbilaran, Davao, General Santos, Iloilo, Nasipit, Zamboanga, and Pulupandan.
An increase in transport competition between airline carriers and shipping companies also happened in 2008. Airline carriers used to offer to reduce domestic fairs and passenger traffic, while in major ports, it became visible. General Santos had the highest passenger traffic, followed by North Harbor, Surigao, and Nasipit. Another factor that led to constant competition in transportation is the improvement of the North Luzon Expressway and the opening of the Subic-Clark-Tarlac Expressway. On the other hand, Puerto Princesa increased its passengers because of the increased demand for its tourist destination.
Philippine Ports Authority offered services in 2008 that had a total of 311,834 vessels compared to 2007.
Table 25: Cargo Throughput, Container, Passenger and Ship Calls, 2008 Philippine Ports Authority, 2008 Annual Report p. 6
<table><tr><td></td><td>2008</td><td>Volume</td><td>% Inc/Dec from 2007</td></tr><tr><td>Cargo M.T.</td><td>145,898,911</td><td>(11,58,809)</td><td>(7.33)</td></tr><tr><td>Domestic</td><td>72,001,421</td><td>(2,589,857)</td><td>(3.47)</td></tr><tr><td>Foreign</td><td>73,897,490</td><td>(8,948,952)</td><td>(10.80)</td></tr><tr><td>Import</td><td>47,409,937</td><td>(2,049,930)</td><td>(4.14)</td></tr><tr><td>Export</td><td>26,487,553</td><td>(6,899,022)</td><td>(20.66)</td></tr><tr><td>Container (in TEUs)</td><td>4,091,925</td><td>93,506</td><td>2.34</td></tr><tr><td>Domestic</td><td>1,567,370</td><td>(46,061)</td><td>(2.85)</td></tr><tr><td>Foreign</td><td>2,524,555</td><td>139,567</td><td>5.85</td></tr><tr><td>Import</td><td>1,253,272</td><td>43,825</td><td>3.62</td></tr><tr><td>Export</td><td>1,271,283</td><td>95,742</td><td>8.14</td></tr><tr><td>Passenger</td><td>43,866,270</td><td>(602,657)</td><td>(1.36)</td></tr><tr><td>Disembarked</td><td>43,819,359</td><td>(608,961)</td><td>(1.37)</td></tr><tr><td>Embarked</td><td>46,911</td><td>6,304</td><td>15.52</td></tr><tr><td>Ship calls</td><td>311,834</td><td>(2,667)</td><td>(0.85)</td></tr><tr><td>Domestic</td><td>302,102</td><td>(2,117)</td><td>(0.70)</td></tr><tr><td>Foreign</td><td>9,732</td><td>(550)</td><td>(5.32)</td></tr></table>
As observed in the table above, Domestic ship calls are profoundly affected by the alien ship; thus, the economic activity of the Philippines experienced a decline due to the passengers as well, especially during the transportation competition between the airline and shipping companies.
The Philippine Ports Authority also developed its application, which covered the Wireless Area Network of WAN services of the Philippine Ports Authority. The Oracle Software replaced the old Portrade Solution, which deployed staff training and technical support personnel. Following the application, the system was completed, which covered the Accounting and Financial Management System (AFMS), Front End Invoicing and Receipting System (FIRST), Port Engineering Management System (PEMS), and e-Procurement System (e-PROC). Mentioned activities that prepared started to set the remaining works for 2009, including application development, user's acceptance testing, end-user training, pilot implementation, and nationwide roll-out.
The Philippine Ports Authority also developed its port operation and facilities. Construction of private ports in different parts of the country: four permits in PDO Manila/Northern Luzon, one in PDO Southern Luzon, and four in PDO Visayas. These physical infrastructure development and maintenance, which the Philippine Ports Authority Capital Expenditures for 2008 supports and continued the National Government's priorities, especially the fast-tracking of projects for the development of the Super Regions (SONA Ports), port links especially to the Strong Republic Nautical Highway (SRNH) and ports under the President's Accelerated Hunger Mitigation Program (AHMP $^{41}$ ).
A total of PHP 3.16 billion was utilized to implement port projects, including utilization for completion/implementation of the port project identified and determined by the Philippine Ports Authority, together with government offices and local government units or LGUs.
The dredging maintenance operation for the year covered 22 ports nationwide, completed during the dredging project involving a combined number of volumes of 2.68 cubic meters removed from the port area. The bulk volume dredged from the channels, berths, basin, and anchorage of North Harbor, South Harbor, and MICT varied from 6.10 meters to 12.00 meters.
Repair and maintenance programs with PHP 404.85 to repair and maintain existing port facilities nationwide were done to keep the ports functional. Repair projects amount to PHP 294.63 million, while PHP 109.13 million are provided for maintenance works. Somepost offices that underwent development, such as PDO Southern Luzon, had the most significant budget for repair and maintenance at PHP 169.09 million pesos, followed by PDO Manila/Northern Luzon, PHP 95.14 million; PDO Northern Mindanao, PHP 52.57 million; PDO Visayas, PHP 47.18 million; and PDO Southern Mindanao, PHP 39.81 million.
The Philippines, as one of the member states of the International Maritime Organization or IMO, had integrated its maritime and port administrator policies with its compliance with safety and security requirements under the International Ship and Port Facility Security or ISPS Code, which started in 2002 $^{42}$.


The government-run port policy has been regularly formulating new and updated Port Security Assessment and Port Facility Security Plan or SCPF through the Office of Transportation or PST and the Department of Transportation and Communication or DOTC, which approve the port security plan.
Maritime security and safety are one of the targets of the Philippine Ports Authority in protecting the marine environment and facilitating law enforcement against piracy and other crimes. The Vessel Traffic Management System of VTMS managed and operated by the Vessel Traffic Services Division of the PDO Manila/Northern Luzon, monitors vessel traffic within the designated areas of Philippine Waters and aid ships. Control Centers provide continuous operating systems that provide continuous assistance to vessels. In the overall assessment, the VTMS monitored a total of 10,751 vessels in 2008, with the foreign ships having 4,138 vessels.
The Philippine Ports Authority's financial performance affected the improvement of the Philippine economy in the latter part of 2008. A PPA gross revenue of $\mathsf{Php}6.626$ billion was recorded that year versus the projected target revenue ofPhp 6.511 billion. Thus, that year's revenue improved because the following Port District Offices also had a high total revenue for this year. The ICTSI contributed a total port revenue ofPhp 2.412 billion, while the wharfage fees generated the second most significant contribution: the PPA reserves a total ofPhp 1.357 billion. Contribution from Arrastre/Stevedoring fees of P 1.169 billion and other revenues from other sources such as other Income -Php 339.46 million; Dockage fees -Php 326.43 million; Port Dues-Php 285.56 million; Storage Fees -Php 231.01 million; Port Usage Fees -Php 202.72 million; Terminal Fees -Php 173.76 million and Fund Management Income -Php 99.91 million. Port District Offices' combined revenues werePhp 6.535 billion in 2008. PDO Manila/Northern Luzon was the traditional performer and host of the county's essential ports of North Harbor, South Harbor, and MICT, which posted a total of P 4.544 billion percent of gross revenue for this year. While, PDO- Southern Luzon -Php 676.22 million; Southern Mindanao -Php 527.92 million; Northern Mindanao -Php 400.40 million; and the Visayas -Php 375.75 million.[43]
Table 26: Cargo Throughout in Metric Tons. By Port District/Port Management Office at Berth and Anchorage. Philippine Ports Authority, 2008 Annual Report p. 28
<table><tr><td rowspan="2">PDO/PMO</td><td colspan="3">2008</td><td colspan="3">2007</td></tr><tr><td>Total</td><td>Domestic</td><td>Foreign</td><td>Total</td><td>Domestic</td><td>Foreign</td></tr><tr><td>PDO-Manila</td><td>66,066,668</td><td>27,166,612</td><td>38,900,056</td><td>66,914,078</td><td>27,975,751</td><td>38,938,327</td></tr><tr><td>North Harbor</td><td>16,741,867</td><td>14,592,375</td><td>2,149,492</td><td>18,291,789</td><td>15,543,188</td><td>2,748,601</td></tr><tr><td>South Harbor</td><td>11,235,172</td><td>5,432,490</td><td>5,802,682</td><td>12,094,491</td><td>5,603,583</td><td>6,490,908</td></tr><tr><td>MICT</td><td>17,252,345</td><td>685,929</td><td>16,566,426</td><td>15,761,302</td><td>155,498</td><td>15,605,804</td></tr></table>
<table><tr><td rowspan="2">PDO/PMO</td><td colspan="3">2008</td><td colspan="3">2007</td></tr><tr><td>Total</td><td>Domestic</td><td>Foreign</td><td>Total</td><td>Domestic</td><td>Foreign</td></tr><tr><td>PDO-Manila</td><td>2,316,941</td><td>1,219,792</td><td>1,097,149</td><td>2,793,341</td><td>1,460,576</td><td>1,332,765</td></tr><tr><td>North Harbor</td><td>1,045,502</td><td>561,933</td><td>483,569</td><td>1,381,584</td><td>734,225</td><td>647,359</td></tr><tr><td>South Harbor</td><td>1,270,950</td><td>657,592</td><td>613,358</td><td>1,401,648</td><td>721,435</td><td>680,213</td></tr><tr><td>MICT</td><td>0</td><td>0</td><td>0</td><td>0</td><td>0</td><td>0</td></tr></table>
Table 27: Number of containers handled by Port District/Port Management Office Philippine Ports Authority, 2008 Annual Report p. 30
<table><tr><td rowspan="2">PDO/PMO</td><td colspan="3">2008</td><td colspan="3">2007</td></tr><tr><td>Total</td><td>Domestic</td><td>Foreign</td><td>Total</td><td>Domestic</td><td>Foreign</td></tr><tr><td>PDO-Manila</td><td>2,999,314</td><td>802,660</td><td>2,196,654</td><td>2,945,828</td><td>819,097</td><td>2,126,731</td></tr><tr><td>North Harbor</td><td>631,467</td><td>631,467</td><td>0</td><td>690,531</td><td>690,531</td><td>0</td></tr><tr><td>South Harbor</td><td>846,478</td><td>103,494</td><td>742,984</td><td>880,789</td><td>112,157</td><td>768,632</td></tr><tr><td>MICT</td><td>1,519,077</td><td>65,792</td><td>1,453,285</td><td>1,371,731</td><td>14,291</td><td>1,357,440</td></tr></table>
Table 28: Passenger Traffic by Port District/Port Management at Berth and Anchorage. Office Philippine Ports Authority, 2008 Annual Report p. 31
<table><tr><td rowspan="2">PDO/PMO</td><td colspan="3">2008</td><td colspan="3">2007</td></tr><tr><td>Total</td><td>Domestic</td><td>Foreign</td><td>Total</td><td>Domestic</td><td>Foreign</td></tr><tr><td>PDO-Manila</td><td>2,316,941</td><td>2,295,769</td><td>21,172</td><td>2,793,341</td><td>2,772,499</td><td>20,842</td></tr><tr><td>North Harbor</td><td>1,045,502</td><td>1,045,502</td><td>0</td><td>1,381,584</td><td>1,381,584</td><td>0</td></tr><tr><td>South Harbor</td><td>1,270,950</td><td>1,249,778</td><td>21,172</td><td>1,401,648</td><td>1,380,806</td><td>20,842</td></tr><tr><td>MICT</td><td>0</td><td>0</td><td>0</td><td>0</td><td>0</td><td>0</td></tr></table>
The Philippine Ports Authority experienced a change in the economic climate devastation scenario in 2009, especially when typhoons "Ondoy" and "Pepeng" hit the country. Some ship calls, passenger traffic barely moved, and domestic and foreign containerized cargo volumes declined, directly affecting the port's economic stability. However, the Philippine Ports Authority still managed the condition, especially in the total cargo value handled at ports. There were 149.90 million metric tons in 2009 compared to 145.90 million tons[44].
The growth of the passengers using the port as a source of transportation, as compared to the previous year, showed an increase of 0.01 percent. A total of 44.31 million passenger traffic was noticed, and only eight PMOs posted a passenger growth, namely: Calapan - $13.30\%$; Zamboanga - $3.79\%$; Ozamis- $5.32\%$; Dumaguete- $3.83\%$; Tagbilaran - $2.56\%$; Legazpi- $1.96\%$; Ormoc - $1.85\%$ and Dapitan - $4.39\%$.
As a result of the volume of cargo and passengers, the volume of ship calls also increased in 2009 compared to the previous year, which rose from 312,094 to 313,430 for domestic and foreign ship calls.
Table 29: 2009 TOP 10 PMOs, Traffic Volumes Philippine Ports Authority, 2009 Annual Report p. 7
<table><tr><td></td><td>Cargo</td><td></td><td>Container</td><td></td><td>Passenger</td><td></td><td>Ship call</td></tr><tr><td>1</td><td>Batangas</td><td>1</td><td>MICT</td><td>1</td><td>Batangas</td><td>1</td><td>Batangas</td></tr><tr><td>2</td><td>North Harbor</td><td>2</td><td>South Harbor</td><td>2</td><td>Calapan</td><td>2</td><td>Dumaguete</td></tr><tr><td>3</td><td>MICT</td><td>3</td><td>North Harbor</td><td>3</td><td>Zamboanga</td><td>3</td><td>Pulupandan</td></tr><tr><td>4</td><td>Limay</td><td>4</td><td>Davao</td><td>4</td><td>Tagbilaran</td><td>4</td><td>Davao</td></tr><tr><td>5</td><td>Surigao</td><td>5</td><td>Cagayan de Oro</td><td>5</td><td>Pulupandan</td><td>5</td><td>Calapan</td></tr><tr><td>6</td><td>South Harbor</td><td>6</td><td>Gen. Santos</td><td>6</td><td>Dumaguete</td><td>6</td><td>Legazpi</td></tr><tr><td>7</td><td>Davao</td><td>7</td><td>Pulupandan</td><td>7</td><td>Legazpi</td><td>7</td><td>Iloilo</td></tr><tr><td>8</td><td>Pulupandan</td><td>8</td><td>Iloilo</td><td>8</td><td>Ozamis</td><td>8</td><td>Tagbilaran</td></tr><tr><td>9</td><td>Iloilo</td><td>9</td><td>Zamboanga</td><td>9</td><td>Iloilo</td><td>9</td><td>Iligan</td></tr><tr><td>10</td><td>Cagayan de Oro</td><td>10</td><td>Nasipit</td><td>10</td><td>Iligan</td><td>10</td><td>Ozamis</td></tr></table>
In 2009, the Philippine Ports Authority's revenue reached P7,129 billion, higher than the previous year. The generated income for 2009 amounted to P6,987 billion compared to 2008. Likewise, the Philippine Ports Authority delivers its port revenue from some port services; of this amount, a total of P2.53 billion was contributed by Manila
International Container Terminal, whose operator was the ICTSI, and the ATI contributed P840.25 million in South Harbor[45].
Table 30: PPA Comparative Port Revenue in 2009 and 2008, Philippine Ports Authority, 2009 Annual Report p. 18
<table><tr><td colspan="5">Comparative Port Revenue
2009 vs. 2008</td></tr><tr><td>Account</td><td>2009</td><td>2008</td><td>Increase/(Decrease)</td><td></td></tr><tr><td>Port Dues</td><td>347.51</td><td>285.56</td><td>21.69%</td><td>4.9%</td></tr><tr><td>Dockage (Berthing)</td><td>292.25</td><td>253.15</td><td>15.45%</td><td>4.18%</td></tr><tr><td>Dockage (Anchorage)</td><td>151.09</td><td>73.27</td><td>106.21%</td><td>2.16%</td></tr><tr><td>Usage Fees</td><td>239.81</td><td>202.73</td><td>18.29%</td><td>3.43%</td></tr><tr><td>Lay-up Fees</td><td>1.90</td><td>0.75</td><td>153.33%</td><td>0.03%</td></tr><tr><td>Wharfage Dues</td><td>1,349.00</td><td>1,357.00</td><td>2.73%</td><td>19.95%</td></tr><tr><td>Storage</td><td>200.50</td><td>231.01</td><td>-13.21%</td><td>2.87%</td></tr><tr><td>Arrastre/Stevedoring</td><td>1,230.97</td><td>1,169.75</td><td>5.23%</td><td>17.62%</td></tr><tr><td>Terminal Fees</td><td>211.17</td><td>173.76</td><td>21.53%</td><td>3.02%</td></tr><tr><td>VTMS Fees</td><td>15.13</td><td>10.48</td><td>44.37%</td><td>0.22%</td></tr><tr><td>Other Income</td><td>352.20</td><td>354.55</td><td>-0.66%</td><td>5.04%</td></tr><tr><td>Pilotage</td><td>23.34</td><td>1.97</td><td>1084.77%</td><td>0.33%</td></tr><tr><td>ICTSI Fees</td><td>2,526.89</td><td>2,411.85</td><td>4.77%</td><td>36.1%</td></tr><tr><td>Total</td><td>6,986.76</td><td>6,525.84</td><td>7.06%</td><td>100%</td></tr></table>
Table 31: Cargo Throughput in Metric Tons in 2009 and 2008 By Port District/Port Management Office at Berth/Anchorage, Philippine Ports Authority, 2009 Annual Report p. 40
<table><tr><td rowspan="2">PDO/PMO</td><td rowspan="2">Grand Total</td><td colspan="2">2009</td><td rowspan="2">Grand Total</td><td colspan="2">2008</td></tr><tr><td>Domestic</td><td>Foreign</td><td>Domestic</td><td>Foreign</td></tr><tr><td>PDO MNL.
NORTHERN LUZON</td><td>61, 687, 825</td><td>26, 667,432</td><td>35,020,393</td><td>66, 066, 668</td><td>27, 166, 612</td><td>38, 900, 056</td></tr><tr><td>Manila – North Harbor</td><td>17, 406, 085</td><td>14, 183, 402</td><td>3, 222,683</td><td>16, 741, 867</td><td>14, 592, 375</td><td>2, 149, 492</td></tr><tr><td>Manila- South Harbor</td><td>10, 734, 949</td><td>5,385, 457</td><td>5,349,492</td><td>11, 235, 172</td><td>5,432, 490</td><td>5, 802, 682</td></tr><tr><td>MICT</td><td>15, 639, 479</td><td>822, 314</td><td>14, 817, 165</td><td>17,252,345</td><td>685,929</td><td>16, 566,416</td></tr></table>
Table 32: Passenger Traffic in 2009 and 2008 By Port District/Port Management Office at Berth/Anchorage, Philippine Ports Authority, 2009 Annual Report p. 41
<table><tr><td rowspan="2">PDO/PMO</td><td rowspan="2">Grand Total</td><td colspan="2">2009</td><td rowspan="2">Grand Total</td><td colspan="2">2008</td></tr><tr><td>Disemb.</td><td>Embarked</td><td>Disemb.</td><td>Embarked</td></tr><tr><td>PDO MNL.
NORTHERN LUZON</td><td>1,938,251</td><td>1,003,890</td><td>934,361</td><td>2,316,941</td><td>1,219,792</td><td>1,097,149</td></tr><tr><td>Manila – North Harbor</td><td>821,565</td><td>420,222</td><td>401,343</td><td>1,045,502</td><td>561,933</td><td>483,569</td></tr><tr><td>Manila- South Harbor</td><td>1,116,662</td><td>583,644</td><td>533,018</td><td>1,270,950</td><td>657,592</td><td>613,358</td></tr><tr><td>MICT</td><td>0</td><td>0</td><td>0</td><td>0</td><td>0</td><td>0</td></tr></table>
Table 33: Number of Ship calls in 2009 and 2008 By Port District/Port Management Office at Berth/Anchorage,Philippine Ports Authority, 2009 Annual Report p. 42
<table><tr><td rowspan="2">PDO/PMO</td><td rowspan="2">Grand Total</td><td colspan="2">2009</td><td rowspan="2">Grand Total</td><td colspan="2">2008</td></tr><tr><td>Domestic</td><td>Foreign</td><td>Domestic</td><td>Foreign</td></tr><tr><td>PDO MNL. NORTHERN LUZON</td><td>22,341</td><td>17,368</td><td>4,973</td><td>22,797</td><td>17,685</td><td>5,112</td></tr><tr><td>Manila – North Harbor</td><td>5,043</td><td>4,602</td><td>441</td><td>5,068</td><td>4,690</td><td>398</td></tr><tr><td>Manila- South Harbor</td><td>7,650</td><td>5,822</td><td>1,828</td><td>7,889</td><td>6,034</td><td>1,855</td></tr><tr><td>MICT</td><td>2,042</td><td>105</td><td>1,937</td><td>2,148</td><td>87</td><td>2,061</td></tr></table>
Table 34: Number of Containers handled in Twenty Equivalent Units in 2009 and 2008 By Port District/Port Management Office at Berth/Anchorage, Philippine Ports Authority, 2009 Annual Report p. 43
<table><tr><td rowspan="2">PDO/PMO</td><td rowspan="2">Grand Total</td><td colspan="2">2009</td><td rowspan="2">Grand Total</td><td colspan="2">2008</td></tr><tr><td>Domestic</td><td>Foreign</td><td>Domestic</td><td>Foreign</td></tr><tr><td>PDO MNL. NORTHERN LUZON</td><td>2,877,638</td><td>810,118</td><td>2,067,520</td><td>2,999,314</td><td>802,660</td><td>2,196,654</td></tr><tr><td>Manila – North Harbor</td><td>638,263</td><td>638,263</td><td>0</td><td>631,467</td><td>631,467</td><td>0</td></tr><tr><td>Manila- South Harbor</td><td>838,950</td><td>86,608</td><td>754,342</td><td>846,478</td><td>103,494</td><td>742,984</td></tr><tr><td>MICT</td><td>1,397,597</td><td>82,932</td><td>1,314,662</td><td>1,519,077</td><td>65,792</td><td>1,453,285</td></tr></table>
PPA stands for the benefit of the technology-based system, which would facilitate data entry for ports, storage, and passengers—implementing a Passenger Boarding Monitoring and Control System or E-Ticketing System, especially in ports with a high volume of passengers. Implementing the E-Ticketing System would address the number of passengers and provide travel safety at every destination.
The ship and cargo performance for 2010, the volume of cargo handled in ports nationwide, increased by 11.01 percent.
Table 35: Trade performance of Cargo, Passenger and Ship Traffic in 2010, Philippine Ports Authority Annual Report 2010 p. 9
<table><tr><td></td><td>2010</td><td>2009</td><td>Volume</td><td>%</td></tr><tr><td>Cargo m.t.</td><td>166,395,680</td><td>146,895,054</td><td>16,500,626</td><td>11.01</td></tr><tr><td>Domestic</td><td>69,796,900</td><td>71,936,419</td><td>(2,139,519)</td><td>(2.97)</td></tr><tr><td>Foreign</td><td>96,598,780</td><td>77,958,635</td><td>18,640,145</td><td>23.91</td></tr><tr><td>Import</td><td>55,131,588</td><td>47,593,576</td><td>7,548,012</td><td>15.86</td></tr><tr><td>Export</td><td>41,467,192</td><td>30,375,059</td><td>11,092,133</td><td>36.52</td></tr><tr><td>Container (in
TEUs)</td><td>4,497,634</td><td>4,011,531</td><td>486,103</td><td>12.12</td></tr><tr><td>Domestic</td><td>1,639,859</td><td>1,593,039</td><td>46,820</td><td>2.94</td></tr><tr><td>Foreign</td><td>2,857,775</td><td>2,418,492</td><td>439,283</td><td>18.16</td></tr><tr><td>Import</td><td>1,443,501</td><td>1,221,914</td><td>221,581</td><td>18.13</td></tr><tr><td>Export</td><td>1,414,274</td><td>1,196,578</td><td>217,696</td><td>18.19</td></tr><tr><td>Passenger</td><td>52,701,645</td><td>43,872,565</td><td>8,829,080</td><td>20.12</td></tr><tr><td>Domestic</td><td>52,638,664</td><td>43,820,426</td><td>8,818,238</td><td>20.12</td></tr><tr><td>Foreign</td><td>62,981</td><td>52,139</td><td>10,842</td><td>20.79</td></tr><tr><td>Ship calls</td><td>346,000</td><td>314,421</td><td>31,579</td><td>10.04</td></tr><tr><td>Domestic</td><td>333,202</td><td>304,643</td><td>30,559</td><td>10.03</td></tr><tr><td>Foreign</td><td>10,798</td><td>9,778</td><td>1,020</td><td>10.43</td></tr></table>

In 2010, the number of cargoes, especially foreign cargo, increased compared to the previous year because of the technology-based system that enhanced the services of the trade industry in Manila's port. Thus, the number of passengers also increased in 2010 compared to the previous years because of the lower air travel price, though the number of maritime disasters happened in Manila's port.
The total cargo throughout 2010 was 16.5 million metric tons (MMT), signifying the number of goods that passed through the country's port. Foreign cargo also increased by 18.64 MMT and domestic cargo decreased to 2.97 percent or 2.14 MMT $^{46}$.
The services of the port of Manila in 2010 had a total of 346.000 vessels for 2010, and the increase in the domestic and foreign ships grew by 10.03 percent and 10.43 percent, an excellent indication of the improvement in the global and domestic economy.
The ongoing projects are projected to be completed in 2010; 40 locally funded projects amounted to P1.74 billion pesos and were invested by the Philippine Ports Authority. Furthermore, a total of P3.42 billion for 74 Locally-funded projects in PDO Manila/Northern Luzon, 31 in PDO Southern Luzon, 14 in PDO Visayas, 9 in PDO Northern Mindanao, and 10 in PDO Southern Mindanao. As of the end of the year, a total of 34 projects with an amount ofPhp 1.68 billion. From the previous year, the PDO Southern Luzon captured a total number of shares ofPhp 1.20 billion, followed by PDO Visayas-Php 1.17 billion; PDO Manila/Northern Luzon-Php 446.10 million; PDO-Northern Mindanao and PDO Southern Mindanao-5.68%47.
PPA allotted PHP 546.64 million for the 2010 Dredging program in line with the port projects. A total of 1.84 million cubic meters of silts from 9 ports nationwide were privatized with a private contractor, F.F. Cruz and Company. Areas which is covered by 2010 Dredging are the following: North Harbor Entrance Channel; South Harbor Fairway Channel leading to Piers
9 and 13; South Harbor Fairway Channel leading to Piers 3 and 5; South Harbor Anchorage; Batangas Base port Phase II, Brooke's Point; Puerto Princesa; Cajidocan Romblon; Matnog Sorsogon; Iloilo River (Phase 1), Base port, Iloilo; MICT (carry-over, completed in 2010) and Dumaguete (carry-over, completed in $2010^{48}$ )
Port maintenance and services in the existing port in PPA also allocated PHP 1 billion for its repair and maintenance program for 2010. A total of PHP 795.58 million was allotted for repair projects, PHP 189.66 million for the maintenance projects in the port, PHP 3.50 million for Head Office engineering projects, PHP 10.00 million for GAD-related projects, and lastly, P1.26 million for the unprogrammed projects. PDO South Luzon received the highest budget for repair and maintenance with a total of P383.11 million, followed by PDO Visayas, which had a budget of PHP 207.34 million, while PDO Manila/Northern Luzon had P129.03 million, and lastly, PDO Southern Mindanao had PHP 88.32 million.
The continuous development of the port also increased the revenue of the PPA for 2010, a total of P8,295.62 million, higher than the previous total revenue. ICTSI was still the highest contributor to the Philippine Ports Authority revenue, amounting toPhp 2,760.14 million;Php 1,671.02 million for wharfage fees; and vessel charges at P1,190.93 million, Asian Terminal Inc. Fees, which has a total ofPhp 923.57 million, Arrastre/Stevedoring income has a total ofPhp 678.07 million; other sources of income ofPhp 423.50 million, pilotage and storage fees atPhp 320.49 million and VTMS and Terminal Fees atPhp 226.30 million.
The growth of port performances, especially in revenue generation for 2010, was spearheaded by Manila/Northern Luzon, followed by Southern Luzon and Southern Mindanao. The PPA is also included in the total port revenue from wharfage, dockages, port dues, usage fees, storage, pilotage, terminal fees, rental, share in arrastre/stevedoring, management fees, and other ancillary services.
Table 36: Overall improvement of the 5 PPA ports between 2009 and 2010 reflected the economic activity during this year. Philippine Ports Authority 2010. P. 2
<table><tr><td colspan="4">Port by PDO
CY 2010, in Million Pesos</td></tr><tr><td>PDO</td><td>2010</td><td>2009</td><td>DEVIATION</td></tr><tr><td>Manila/Southern Luzon</td><td>5,455.28</td><td>4,711.11</td><td>15.80%</td></tr><tr><td>Southern Luzon</td><td>904.00</td><td>769.66</td><td>17.56%</td></tr><tr><td>Visayas</td><td>499.75</td><td>437.29</td><td>14.28%</td></tr><tr><td>Northern Mindanao</td><td>534.08</td><td>466.61</td><td>14.46%</td></tr><tr><td>Southern Mindanao</td><td>724.17</td><td>597.31</td><td>21.24%</td></tr><tr><td>TOTAL</td><td>8,117.28</td><td>6,981.98</td><td>16.26%</td></tr></table>
Table 37: Port Revenue by Source, 2010 in Million Pesos
<table><tr><td colspan="5">Comparative Port Revenue 2010 vs. 2009</td></tr><tr><td>Account</td><td>2010</td><td>% of Total income</td><td>2009</td><td>Increase/ (Decrease)</td></tr><tr><td>Port Dues</td><td>383.87</td><td>4.73%</td><td>347.51</td><td>10.46%</td></tr><tr><td>Dockages</td><td>521.29</td><td>6.42%</td><td>443.3s4</td><td>17.58%</td></tr><tr><td>Usage Fees</td><td>273.47</td><td>3.37%</td><td>239.81</td><td>14.04%</td></tr><tr><td>Lay-up Fees</td><td>12.30</td><td>0.15%</td><td>1.91</td><td>543.98%</td></tr><tr><td>Wharfage Dues</td><td>1,671.02</td><td>20.05%</td><td>1,394.00</td><td>19.87%</td></tr><tr><td>Storage</td><td>289.42</td><td>3.56%</td><td>200.05</td><td>44.25%</td></tr><tr><td>Arrastre/Stevedoring</td><td>678.07</td><td>8.35%</td><td>461.21</td><td>47.02%</td></tr><tr><td>Other Income</td><td>423.50</td><td>5.21%</td><td>352.19</td><td>20.25%</td></tr><tr><td>Pilotage</td><td>31.07</td><td>0.38%</td><td>23.34</td><td>33.12%</td></tr><tr><td>ICTSI Fees</td><td>2,760.14</td><td>33.98%</td><td>2,526.89</td><td>9.23%</td></tr><tr><td>ATI Fees</td><td>923.57</td><td>11.37%</td><td>769.76</td><td>19.98%</td></tr><tr><td>VTMS Fees</td><td>16.23</td><td>0.20%</td><td>15.13</td><td>7.27%</td></tr><tr><td>Terminal Fees</td><td>139.94</td><td>1.72%</td><td>211.17</td><td>-34.02%</td></tr><tr><td>TOTAL</td><td>8,123.29</td><td>100.00%</td><td>6,986.77</td><td>16.27%</td></tr></table>
The accumulated total expenses of the PPA for 2010 reached its total amount of Php 6,327.22 million, which was higher than the previous year based on port expenditures. An increase in Repairs and Maintenance, Personal Services from the implementation of the Salary Standardization, and Dredging costs in ports increased the port's Operating Expenses because of the port revenue and port development from the different PMO, PPA Net Income to P1,968 billion, which is lower than the previous income.
In 2010, PPA officials attended 12 meetings/conferences in Thailand, Malaysia, and the Philippines East Asia Growing Association (BIMP-EAGA) participated in other policies related to port facility standards/ benchmarking, anti-terrorism, and Anti- human trafficking, environmental protection, port security, and safety. In 2010, the PPA also conducted conferences in Thailand, Malaysia, Vietnam, Cambodia, Singapore, Japan, and London that dealt with global maritime trends and developments $^{49}$.
The total performance of PPA for 2010 increased to the previous year; Cargo throughout had a total of 166.40 million metric tons, which was higher than the previous year. The increase in cargo for that year was reflected in the container traffic, in which the PPA had a total of 4.50 million TEUs for passengers, an increase of 52.70 million more than the previous year. There was also an increase in gross income by PHP 8.295 billion, while expenses totaled PHP 6.33 billion, and net income was PHP 1.491 billion $^{50}$.
Table 38: Cargo Throughput in Metric Tons by Port District/Port Management Office at Berth/Anchorage
<table><tr><td rowspan="2">PDO/PMO</td><td rowspan="2">Grand Total</td><td colspan="2">2010</td><td rowspan="2">Grand Total</td><td colspan="2">2009</td></tr><tr><td>Domestic</td><td>Foreign</td><td>Domestic</td><td>Foreign</td></tr><tr><td>PDO MNL/NORTHERN LUZON</td><td>70,316,061</td><td>24,861,197</td><td>45,454,864</td><td>61,687,825</td><td>26,667,432</td><td>35,020,393</td></tr><tr><td>Manila-N. Harbor</td><td>16,146,329</td><td>11,929,164</td><td>4,217,165</td><td>17,406,085</td><td>14,183,402</td><td>3,222,683</td></tr><tr><td>Manila-S. Harbor</td><td>12,958,525</td><td>5,374,364</td><td>7,584,161</td><td>10,734,949</td><td>5,385,457</td><td>5,349,492</td></tr><tr><td>MICT</td><td>18,266,554</td><td>913,378</td><td>17,353,176</td><td>15,639,479</td><td>822,314</td><td>14,817,165</td></tr></table>
Table 39: Passenger Traffic by Port District/Port Management Office at Berth/Anchorage
<table><tr><td rowspan="2">PDO/PMO</td><td rowspan="2">Grand Total</td><td colspan="2">2010</td><td rowspan="2">Grand Total</td><td colspan="2">2009</td></tr><tr><td>Domestic</td><td>Foreign</td><td>Domestic</td><td>Foreign</td></tr><tr><td>PDO MNL/NORTHERN LUZON</td><td>1,863,037</td><td>913,921</td><td>949,116</td><td>1,938,251</td><td>1,003,890</td><td>934,361</td></tr><tr><td>Manila-N. Harbor</td><td>821,983</td><td>375,750</td><td>446,233</td><td>821,565</td><td>420,222</td><td>401,343</td></tr><tr><td>Manila-S. Harbor</td><td>1,004,780</td><td>522,028</td><td>482,752</td><td>1,116,662</td><td>583,644</td><td>533,018</td></tr><tr><td>MICT</td><td>0</td><td>0</td><td>0</td><td>0</td><td>0</td><td>0</td></tr></table>
Table 40: Number of Ship calls by Port District/Port Management Office at Berth/Anchorage
<table><tr><td rowspan="2">PDO/PMO</td><td rowspan="2">Grand Total</td><td colspan="2">2010</td><td rowspan="2">Grand Total</td><td colspan="2">2009</td></tr><tr><td>Domestic</td><td>Foreign</td><td>Domestic</td><td>Foreign</td></tr><tr><td>PDO MNL/NORTHERN LUZON</td><td>23,093</td><td>17,645</td><td>5,448</td><td>22,341</td><td>17,368</td><td>4,973</td></tr><tr><td>Manila-N. Harbor</td><td>4,967</td><td>4,436</td><td>531</td><td>5,043</td><td>4,602</td><td>441</td></tr><tr><td>Manila-S. Harbor</td><td>7,810</td><td>5,709</td><td>2,101</td><td>7,650</td><td>5,822</td><td>1,828</td></tr><tr><td>MICT</td><td>1,942</td><td>103</td><td>1,839</td><td>2,042</td><td>105</td><td>1,937</td></tr></table>
Table 41: Number of Containers Handled in TEUs by Port District/Port Management Office at Berth/Anchorage
<table><tr><td rowspan="2">PDO/PMO</td><td rowspan="2">Grand Total</td><td colspan="2">2010</td><td rowspan="2">Grand Total</td><td colspan="2">2009</td></tr><tr><td>Domestic</td><td>Foreign</td><td>Domestic</td><td>Foreign</td></tr><tr><td>PDO MNL/NORTHERN LUZON</td><td>3,158,023</td><td>747,649</td><td>2,410,374</td><td>2,877,638</td><td>810,118</td><td>2,067,520</td></tr><tr><td>Manila-N. Harbor</td><td>553,548</td><td>553,348</td><td>0</td><td>638,263</td><td>638,263</td><td>0</td></tr><tr><td>Manila-S. Harbor</td><td>988,268</td><td>101,764</td><td>886,504</td><td>838,950</td><td>86,608</td><td>752,342</td></tr><tr><td>MICT</td><td>1,612,886</td><td>89,542</td><td>1,523,344</td><td>1,397,549</td><td>82,932</td><td>1,314,662</td></tr></table>
## II. CHARGES ON VESSELS
The Philippine Ports Authority also engaged in the following trade that included charges, especially on its vessels. The vessels engaged in foreign trade include those engaged in barter trade that berths at any point of the port would charge dockage at berth per gross registered tonnage (GRT), a total of US $0.081.
Vessels that now engage in foreign trade include dockage at berth at any point of port of call, would be charged at gross registered tonnage per calendar day, and have a maximum computation of 50,000 gross registered tonnage. It would be used in the following government port worth US(0.039/GRT and at
Private Por Gross Registered Tonnage (GRT), officially registered at PPA with US $0.20/GRT.
Vessels occupied with a remote exchange that did not compartment at either an administration or privileged port, regardless of whether worked only or financially, were likewise charged dockage at the anchorage of one-portion of the relating dockage at billet at an administration port, subject to a similar most extreme 50,000 GRT as follows a US(20.[51] From 2007 to 2009, vessels that occupied with a household exchange that tied up at any administration port would be charged a domestic dockage fee (usage fees) as in the following:
Table 42: Domestic Dockage Fee
<table><tr><td></td><td>January 1, 2007</td><td>January 1, 2008</td><td>January 1, 2009</td></tr><tr><td>6 to 100 GRT per calendar day or fraction thereof</td><td>Php 61.00</td><td>Php 72.00</td><td>Php 82.00</td></tr><tr><td>Over 100 GRT per GRT per calendar day or fraction thereof</td><td>Php 0.60</td><td>Php 0.70</td><td>Php 0.80</td></tr></table>
The registered bay and trade vessels shall also be charged one-half of the required Domestic Dockage Fee at a given government port at the following charges on a given day.[52]
Table 43: Bay and river trade vessels,
<table><tr><td></td><td>January 1, 2007</td><td>January 1, 2008</td><td>January 1, 2009</td></tr><tr><td>Not less than</td><td>Php 61.00</td><td>Php 72.00</td><td>Php 82.00</td></tr><tr><td>Not more than</td><td>Php 308.00</td><td>Php 360.00</td><td>Php 413.00</td></tr></table>
Idle vessels occupy side berths associated with government ports despite a shifting order from the port manager or approved representative to administer operations to an incoming operative vessel. It was assessed a charge of three-hundredth of the applicable dockage fee for foreign vessels and five-hundredths of the applicable domestic dockage fee (Usage Fee) for domestic vessels, provided that the house owners created the payment of such assessed fees, agents or representatives before actual departure from the berth.
## III. CHARGES ON CARGOES
Charges on cargoes, especially in non- containerized foreign cargoes imported, exported and transshipped through-owned, were charged a wharfage fee for the use of the port facilities based on the total metric or revenue tonnage.
Domestic cargo containerized or not discharged at anchor without government registration, especially in private ports, would be charged half the usual Domestic Wharfage fee.
The containerized foreign and domestic cargoes were loaded with more than one shipper/consignee (LCL); the wharfage, which was non-containerized cargo, would apply. The wharfage for all the containerized foreign and domestic cargoes that were not loaded for a discharge without using any government would be officially registered for the single port and equally pay a one-half government-owned port. 53
### a) Managerial and Operational expansion in Port of Manila
The Philippine Port Authority dominated several ports, becoming the country's leading developer, operator, and regulator of ports. It has four categories: (1) the PPA port system consisting of public and private ports; (2) ports under the jurisdiction of independent port authorities (IPA); (3) municipal ports developed for the local government units (LGU) and the Road RORO terminal system (RRTS).
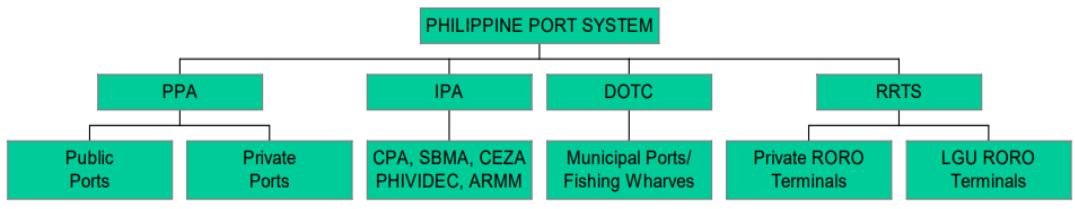 Figure 4: The Philippine Port System, Basilio, E. et al. (2005)
The Philippine Ports Authority is the premier authority in the Philippines, which develops, maintains, and operates public and private ports. The implementation of rates or changes in cargo handling tariffs is affected because of the privatization program of the government that handles the Terminal Operations in the International Container Terminal Services for Manila International Container Terminal and Asia Terminal Incorporation for South Harbor; Cargo Handling services for each port.
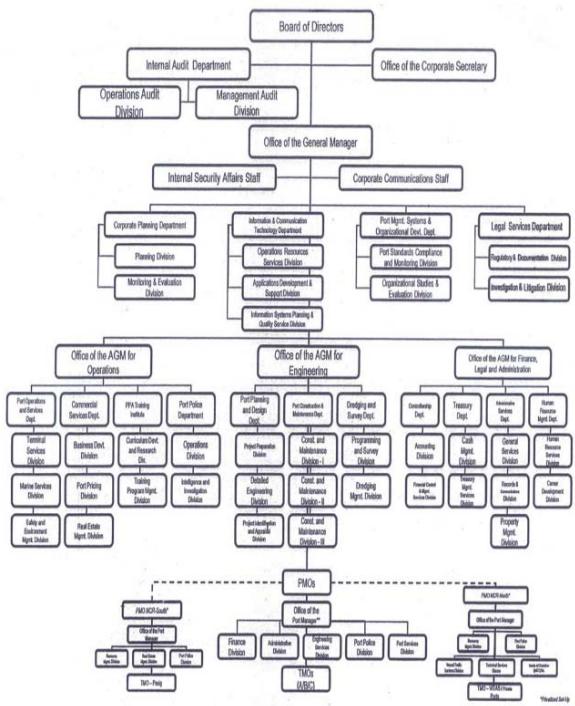
 Figure 5: The present organization of the Philippine Ports Authority $^{54}$ Figure 6: Manila International Container Terminal Layout. Profile of Philippine Ports Third Edition
The Manila International Container Terminal (MICT), operated by the International Container Terminal Services, Inc. (ICTSI), is located between the North and South Harbors in Manila and the westward of Manila. The southern end is the mouth of the Pasig River, a container-dedicated terminal, and is one of the three terminals in the Port of Manila.
These remaining two terminals, the North Harbor, were for domestic bulk, breakbulk, passenger, and containerized cargo, and the South Harbor was for international bulk, breakbulk passenger, and containerized cargo. The MICT has a total of 1,300 sq. in length and comprises six berths with the exact dimensions.
Number of berths and their measurement. — profile of the Philippine Ports Third Edition
<table><tr><td>Berth</td><td>Length</td><td>Depth</td></tr><tr><td>1</td><td>250m</td><td>12.50m</td></tr><tr><td>2</td><td>250m</td><td>12.50m</td></tr><tr><td>3</td><td>250m</td><td>12.50m</td></tr><tr><td>4</td><td>250m</td><td>12.50m</td></tr><tr><td>5</td><td>300m</td><td>14.50m</td></tr></table>
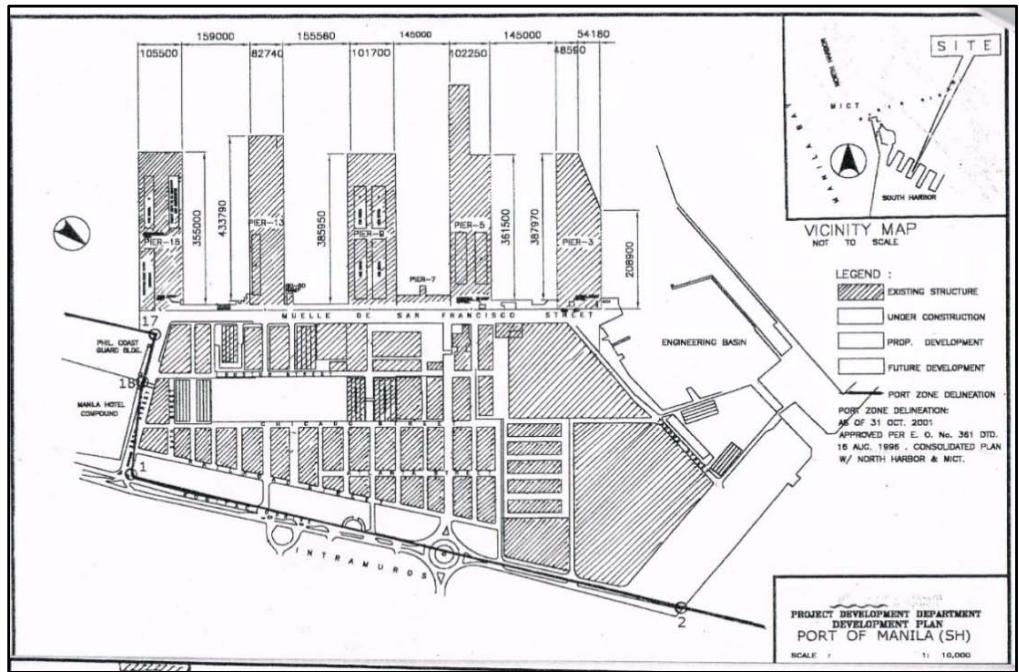 Figure 7: Port of Manila, South Harbor. Profile of Philippine Ports Third Edition
The PMO- South Harbor is one of the 123 government-owned ports the Philippine Ports Authority administers. It is a multi-cargo port with five-fingerpiers that handle all types of cargo, including container, bulk cargo, break-bulk, general cargo, and vehicles.
Bulk cargoes are handled at berth and their designated anchorages. The South Harbor handles at berth and its designated anchorage. South Harbor also handles much international shipping in the country; its annual capacity was 820,000 more or less in its container vans. The South Harbor handles bulk cargo services.
### b) Port of Manila towards advancement
The government provides some development and operation of public works with mixed results: competition, privatization, transparency, and greater private ports, which match the government's policy objectives.
## IV. PRIVATIZATION OF MICT AND SOUTH HARBOR
The privatization of the terminal operation of the MICT in 1987, a 25-year contract awarded to the International Container Terminal Services or ICTSI $^{55}$, a private terminal operator. In 1988, MICT was awarded to a private firm as part of the PPA's pilot project in privatizing ports. Another is implementing the "landlord" port model, in which the publicly governed port authority acts as a regulatory body and as a landlord while private companies carry out port operations, mainly cargo-handling activities. In this model, the port authority maintains the ownership of the port while its infrastructures are in lease to provide firms with maintain their structure and install their equipment to handle cargoes; in return, the landlord gets a share of the revenue from the private entity $^{56}$.
In 1992, the government's Memorandum Order No. 415 directed the National Housing Authority or NHA to implement the "Smokey Mountain Development Plan" and reclaim the area across Road 10. The Philippine Ports Authority addressed the issue in the said reclaimed area. However, in 1993, Memorandum Circular No. 45 directed all concerned government agencies to provide an environmental agency to manage the support service sector, particularly in land, air, sea transportation, communication, energy, insurance, and port services.
In 1996, the Philippine Ports Authority constructed a 15-hectare private port facility in the reclaimed area in the Smokey Mountain Development Plan, which turned into a port facility, namely Harbor Center Port Terminal or HCPT, which is a private commercial port and directly with the port of Manila.[57]
Under Executive Order No. 212, which is "accelerating the demonopolization and privatization program for government ports in the country," it was a good action for the port of Manila to privatize the different sectors in the port to maintain its development not only in facilities but as well as the services. However, the labor unions opposed the implementation because of the displacement of port workers in the process and argued that port privatization would result in the inability of some cargo handling companies, especially to the benefit of the port workers.
In 1997, the government issued Executive Order 410, "Repealing the EO 212 series of 1994," which recognized the Power of the Philippine Ports Authority under Presidential Decree No. 857, stating the implementation of the policy accelerating the Demonopolization and Privatization of Government Ports in the Country.
## V. CHANGE IN POLICY
In 1998, the government issued Executive Order No. 59, which directed the Philippine Ports Authority to adopt and implement a program for further rationalization, modernization, and improvement of port services and facilities in government ports.[58] Thus, EO 59 was issued to promote and encourage the private sector by requiring all existing facility operators and service providers, such as cargo handling operators, shipping companies, and port workers, to unify into one corporation. The objective of port modernization is the following: First is the creation of the private monopoly, in line with the association composed of terminal operators, cargo handling companies, and some big shipping lines. Second, port services using all port services include ancillary services, and the private port monopolist would manage them.
Third, a negotiated contract that develops the port operations which are awarded to port monopolist but without the benefit of the public bidding as contrary to the principle of transparency and competition which the government governs and lastly, nationwide coverage, which is the monopoly of one port will affect the entire ports system.
## VI. GREATER PRIVATE SECTOR
The Memorandum Order, No. 47 series of 2001 directed the Philippine Ports Authority or PA to assist in the technical evaluation of the port-related land use, which permits the private and commercial ports.[59] The PPA would have a permanent commercial permit to operate and handle the following: (a) all domestic vessels and the locators will rent cargo, and (b) foreign vessels and cargo at the Harbor Centre.
However, in 2003, the PPA expanded the permit to handle international break-bulk traffic. The RO-RO Ferry Terminal System (RRTS) would also promote a Private Sector Investment with the private sectors and the LGU's for the establishment of the RO-RO links as part of the national highway network.
## VII. PORT INNOVATION IN TERMS OF SAFETY MEASURES
To continue the reliable and reputable services the Philippine Ports Authority provides its community, PPA has a specific mandate under PD857 that ensures smooth, safe, and secure water flow as commerce passes through the country's port. The PPA is guided by the International Ship and Port Facility Security Code or ISPS and other members of the International Maritime Organization or IMO, which also provides a commitment to keep the country's gateway for the safety of the ports in the rest of the world especially in terrorism, human trafficking, and other similar illegal activities in the ports. The ISPS becomes the PPA's defining guidelines, parameters, and protocol, especially in port security and safety.
## VIII. SAFETY IMPROVEMENTS
Another development that the PPA puts forward for the continuity of its vision is to establish technologically advanced monitoring of vessels for safer navigation when entering the Philippine waters. The PPA started the Vessel Traffic Management or VTMS, installed in Manila North Harbor and Corregidor Island in Bataan and Batangas and are now in full swing. This is supervised by the Vessel Traffic Services Division or VTSD of PDO Manila/Northern Luzon and the Port Services Division or PSD of PMO Batangas. The VTMS would regularly track the vessels, especially in emergencies, piracy, typhoons, and other calamities.
The VTMS operations were generally adequate in 2007; VTMS monitored 10,965 total vessels; 6,787 were domestic, and 3,908 were foreign ships. Other government agencies involved marine vessels through the VTMS. The coordination between the PPA and Philippine Coast Guard or PCG Action Center and other concerned agencies provided prompt assistance and responses to emergency incidents occurring during the year.
Lastly, to ensure the efficiency of port personnel and the security forces, performance evaluation and inspection of contracted agencies were done. Seventeen base ports, including the major gateways such as South Harbor, North Harbor, Cagayan de Oro, General Santos, and Iloilo, undertake a review of the proposed guidelines with the supervision of the private security agencies that also operate within the area under the PPA jurisdiction started. Training for security and anti-terrorism, port police officials and personnel, attended different local and international meetings, conferences, and training provided for the port personnel.
Port safety, Security, and Environmental Protection form part of the development of the Philippine Ports Authority. Five PPA ports issued a Statement of Compliance Issue to a Port Facility from the Office of Transportation Security in 2010: Balanacan Marinduque, Cagayan de Oro, Iloilo, Lamao, and Lucena.
Philippine Ports Authority released its memorandum order in 2007, which implemented an initiative project at the South Harbor and MICT for the detection and prevention of trafficking of Nuclear and other Radioactive Materials, which safeguard and strengthen the security vessels, cargoes, port facilities, and general public transacting businesses in the ports; identify the illegal trafficking through the ports of unique nuclear materials and the radioactive materials and lastly, and protect the health and safety of the public against the accidental or intentional exposure, especially to radiation.
The system would screen containers and cargoes for nuclear and radiological weapons. Together with the Megaports Initiative Projects, radiations, detection monitors, and related equipment and devices are necessary to operate the alarm and detection system effectively in South Harbour and Manila International container terminals.
## IX. MODERNIZATION EFFORT
Facility management and operation systems were also being developed this year. The Vessel Traffic Management System (VTMS) Control Center, which is a state-of-the-art vessel monitoring facility, is managed and operated by the PPA to focus on the round-the-clock assistance as well as the different information that comes from the government agencies primarily in the cases of vessels distress and piracy and other incidents in port. The VTMS was installed at North Harbor, Corregidor, in Bataan, and the port of Batangas. In 2010, 33,980 vessels were monitored from the VTMS Control Center in Bataan with 8,533 and 25,447 foreign and domestic ships.
The PPA MIS Computerization Projects are also continuing to resolve the problems encountered, especially in the Accounting and Financial Management System or AFMS, an application developed for the PPA that was implemented at the end of 2010.
Another development from the PPA conceptual master plan for Phase 1 of Terminal 1 of North Harbor Modernization from Manila North Harbor Modernization Project (MNHMP) was expected to be completed by April 2011. Upon the changes' approval, engineering design, especially in the container terminal, followed by Phase 1, covered Pier 14 until the Marine Slipway.
The Port Management Office of Batangas was chosen as the pilot port for implementing the Quality Management System or QMS to secure the issuance of ISO Certification for the entrance and exit of vessels and clearance in the Port of Batangas. The PPA mandates to institutionalize structures, mechanisms, and standards of the Government Quality Management Program. The PPA Quality Policy was crafted to consistently provide port operation quality and services, mainly in employment procedure entrance and clearance, to satisfy the needs of its clients and comply with international and national constitutional and regulatory requirements. Batangas Port also conducted a second Internal Audit last December 13-16, 2010 leading to the improvement of the Batangas Port which also paved the way for the issuance of the ISO-QMS by early 2011. Meanwhile, the same activities were done to the other ports, such as Cagayan de Oro, Davao, Gen. Santos, Iloilo, Ozamis, and Zamboanga.
The PPA developed the Port Safety Health Environment Management System or PSHEMS; this code was developed by a collaboration between the Global Environment Facility (GEF), the United Nations Development Program (UNDP), and the International Maritime Organizations (IMO). Regional Program of Partnership in Environmental Management for the Seas of East Asia and various International non-governmental organizations were used to represent the port industry. The voluntary standards measure the port performance, especially the quality management, safety and health of port workers and the environment.
The PSHEM Code requires the Port Safety, Health, and Environmental Management System (SHEMS) to enable an organization to develop and implement policies and objectives, especially in hazardous activities that may impact safety, health, and the environment. Because of the advocacy forenvironmental safety, the PPA adapted the system for maritime safety, protection of the marine environment, and sustainable development of the country.
The DOTC spearheaded ticketing systems in the port as an Inter-Agency Committee, while the PPA, PCG, MARINA, the Shipping Lines, and other stakeholders in the port also participated in another development in the port system. The E-Ticketing system provides accurate data or information as well as statistics on the passengers and the limit of each vessel for the capacity of the passengers. It has been implemented at the Passenger Terminal Building 2 of Batangas port since 2008, and for the following year, testing was done at the port of Calapan.
The continuous practice of the PPA along with other various international maritime associations such as the International Maritime Organization (IMO), Asia-Pacific Economic Cooperation (APEC), ASEAN Port Authorities (APA), and (Brunei-Indonesia-Malaysia-Philippines East Asia Growth Association (BIMP-EAGA) is actively participating in the policy-making capacity and dialogues on the universal port facilities standards, anti-terrorism, anti-human trafficking, environmental protection, port security and safety.
During the Presidency of Gloria Macapagal Arroyo, the RO-RO policy focused on the enhancements to the expansion of the Strong Republic Nautical Highway or SRNH, the number of recommendations raised last April 4, 2008.
First was the enhancement in the policy, which included the chassis-RORO or CHA-RO operation as part of the RO-RO service. This intervention was designed for the domestic operations' transshipment of export and import cargo. It also provided some discounts, especially on the wharfage and scanning fees, that would increase exports and the port's competitiveness in the market.
Second, the Department of Trade and Commerce (DOTC) and the Philippine Ports Authority (PPA) upgraded the RO-RO ports and terminals, especially east-west connections. The participation of the Department of Public Works and Highways would provide inter-modal connectivity, and finally, DOTC and PPA would work together for the effectiveness and immediate privatization of the RO-RO ports and terminals.
The Philippine Ports Authority and Cebu Port Authority mandated a privatized RO-RO port to the private sectors of the local government units. In 2009, USAID, The Asia Foundation, and the implementing partner, The REID Foundation, began a three-year project called Economic Growth Hubs to improve air, land, and sea. The project sought to decentralize trade flows and lower transport costs by expanding the Ro-Ro network for maritime transportation in the Philippines. The then President Aquino's agenda was to continue the former President Arroyo's agenda, especially in the maritime industry. Two significant policies were the adaptation of regional Ro-Ro as one of the 15 flagship projects approved at the October 2010 ASEAN Leaders Summit and regional Ro-Ro.
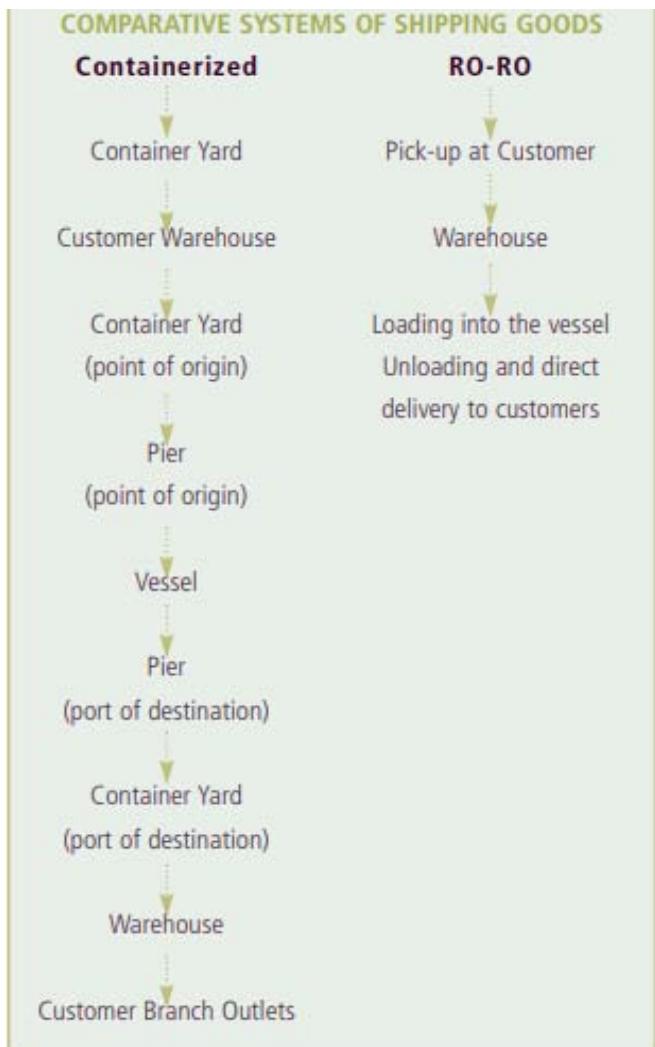 Figure 8: Comparative System of Shipping Goods
The help of Ro-Ro commodities from the provinces would easily transport commodities and passengers, especially those on the interisland route. Thus, the problem of port congestion night decreased following the operational plan of Ro-Ro that directs the goods into the warehouse after the customer picks them up, loads the vessels, and unloads them directly to the customers.
President Arroyo was the first ASEAN leader to introduce the regional Ro-Ro concept, building on the success of the Ro-Ro in the Philippines. During the ASEAN Leader Summit in February 2009, the former President proposed establishing an ASEAN Ro-Ro system and during the sixth Summit of Brunei-Indonesia-Malaysia-Philippines East ASEAN Growth Area (BIMP-EAGA). She called for the implementation of a roll-on roll-off transportation system. In October 2009, an ASEAN High-Level Task Force was established to develop an ASEAN Master Plan on regional connectivity, and in March 2010, the first High-Level Task Force on ASEAN Connectivity. In May 2010, during the presidency of Benigni Aquino, he continued to influence the ASEAN process to incorporate Ro-Ro; during the first meeting, Ambassador Bautista invited the REID team headed by Enrico Basilio provided a briefing on the regional Ro-Ro initiative.
In October 2010, ASEAN leaders adopted a new Master Plan on ASEAN Connectivity that includes Ro-Ro as the flagship project called "Study on the Roll-on/Roll-off (RORO) Network and Short-Sea Shipping." Moreover, the REID RO-RO Team supported the Asia Foundation and United States Agency for International Development or USAID the following years, which would conduct a proposed Ro-Ro study to enhance the commercial, financial, policy, and regulatory steps, especially in establishing a Ro-Ro network.
## X. INTERNATIONAL CONTAINER TERMINAL SERVICES, INC.
The International Container Terminal Services, Inc. is identified as a pioneering innovator in container ports' acquisition, development, management, and operation. The ICTSI vision is to provide long-term shareholder value in the Port Industry with Manila International Container Terminal or MICT. MICT strengthened the specific port management that focused on the quality of the services in specific areas in which global potentials were recognized. Today, the ICTSI is involved in developing its operation and managing the number of ports and terminals in Asia-Pacific, the Americas, Europe, the Middle East, and Africa.
Established in 1987 and with headquarters in the Philippines, the ICSI established a solid local and international portfolio of the continuous and successful privatization in partnership with the government.
Thus, the ICTSI continues to seek port privatization and opportunities and port assets around the globe, particularly with the government. Because of the demand for aggressive technological investments and overall modernization, the National Government continues to finance developments and projects. Regardless of the privatization model employed, ICTSI's operation continues to flourish where the government ensures a conducive environment, privatization plans, and activating monitoring of private entities.
The continuous privatization across all industries and sectors, such as transportation and port sectors, is done as the ICTSI is considered one of the early adopters of port privatization and the formalization between the Philippine Ports Authority and ICTSI for the Manila International Container Terminal.
An expansion program in 1994 gained experience in developing, managing, and operating several container terminals in the Philippines, Asia, and other global markets. Its corporate headquarters is in Manila, with regional representatives in Dubai for Europe, the Middle East, Africa, and Panama City for America. The Manila International Container Terminal was the enterprise and remains a flagship operation, continuing to benchmark in other countries. Thus, Manila and other Philippine ports are preparing for expansion through a continuous benchmark that enriches the best practices in the port system and procedures that can be adapted and developed in port locations.
The management has proven successful in port development and management in several ports worldwide. State-of-the-art information technology consist of leading hardware and software that provide continuous market monitoring and deployment into the strategic area for operations. Enhancement was done from communication to maintaining its monitoring from the control to billing, automated operations (gates and yard), and technologies in the port area.
The International Container Terminal Service (ICTSI) had also bought controlling stakes in the two terminal ports, one in India's Tamil Nadu and one in Croatia. In June of the following year, the ICTSI began to offer $69\%$ of the shares in a Singaporean port manager, namely Portek International, which has concessions in Jakarta and West Java, Algeria, Gabon, and Malta.
In 2010, the volume at Port of Manila, which is ICTSI's flagship, increased its TEUs with a total of 1.6 million, far below the Shanghai International, considered the busiest port in the world, containing 29.1 million TEUs. However, ICTSI also manages other container ports in the Philippines, considered the leading competitor, Asian-Terminals bought by DP World of Dubai, which handles only 820,000 TEUs.
Concessionaires like ICTSI are usually into long contracts that handle shipments, services for inspection and storage, and modern equipment. The headquarters office was adjacent to Manila cranes in the Tondo area. According to Razon, it is considered the port that has emerged as a growth market in the industry. The privatization in the Philippines that started in the 1990s revived the business. ICTSI came to Argentina in 1994, followed by other ports in Mexico, Tanzania, Thailand, and Pakistan; this investment of joint ventures later became unprofitable, especially in the financial crisis the Philippines encountered and the company's debt to $320 million. Razon disposed of overseas port assets, which he sold to giant port manager Hutchison, who is owned by a Hong Kong tycoon, Li Ka-Shing.
## XI. MANILA INTERNATIONAL CONTAINER TERMINAL
Manila has been the center of interregional and international commerce since the start of trade between Manila-Acapulco Galleon trade. Now, the port remains a
vital part of the vibrant activity in Manila and is also the central hub of Philippine trade.
The MICT is one of the three terminals in the Port of Manila in the Philippine Port system. The MICT is between the two prominent harbors, namely The North and the South Harbor, located westward of Manila Bay and the mouth of Pasig River; both bodies of water are the city's major waterways.
In 1988, ICTSI continued to operate the MICT in an international tender. This privatization was the Philippine government's first port to undergo a privatization effort with seven local and international institutions. The ICTSI increased the annual terminal capacity, expanding the cargo handling fleet, which is considered the largest and most modern in the country today. For the MICT, the flagship operation had a strategic development program that provides for continuing growth, especially in international, regional, and domestic trade.
It was in operation starting June 12, 1988, and today, the MICT is the Philippines' largest and busiest international container terminal and the $25^{\text{th}}$ largest nontransshipment port in the world. The MICT can handle an annual capacity of 2.75 million twenty-foot equivalent units of containerized, bulk, and non-containerized cargo. Identified as the most modern terminal, the MICT offers extensive facilities, including the country's first and most massive cranes, rubbing tired gantry cranes deployed in container yard operations.
The MICT is the flagship of ICTSI, which operates the strategic development program that provides continuing growth on international, regional, and domestic trade demands. Port operations enhanced the Terminal Operations Management system, security systems primarily in the installation of security cameras that automatically capture the container and track data as well as the boxes transported to the vessels or trucks.
For the customers to secure and update the status of containers, the MICT launched an online search called Tracks & Trace (T&T), which contains an SMS notification option. Another development was that it was compatible with Android and Apple mobiles; the MICT Mobile App gave customers a personalized account with Track & Trace functionality, billing transactions, and other matters.
Someprivate and public agencies, such as the Philippine Ports Authority, Bureau of Internal Revenues, Bureau of Customs, and several ICTSI partner banks, fully support the port industry's and customers' convenience. Lastly, the Bureau of Customs secures the overall process from electronic to mobile.
There is a $70\%$ market share in the Port of Manila, and it was awarded ISO certification in 2004 and 2008.
## XII. CONTAINER HANDLING
Under its charter, the PPA, as administrator of all ports, is vested with police powers and authorized to exact fines for specific violations of its rules and regulations. Subsequently, by advantage of Executive Order (EO) 159, the PPA can now undertake all port development projects, relieving the Department of Public Works and Highways (DPWH) of this responsibility. As the phase of its regulatory function, the PPA issued new regulations and reviewed and updated some of its existing insurance policies to preserve its operation aligned with the thrusts and priorities of the country-wide authorities and cutting-edge business developments and first-ratepractices in the water transport industry. It also issued a range of circulars and interior guidelines to better organizational and financial management.
On port services, the PPA also pursued streamlining and reducing documentary requirements to ease the value of doing business, consistent with the government's security thrust. It also facilitated the privatization of four premier ports, which now boast world-class capabilities and amenities — Manila International Container Port, Manila South Harbor, Manila North Harbor, and Batangas Port.
The PPA adopted software for non-stop sustained and considerable development, starting with the country's predominant gateways, and poured investments into secondary ports and roll-on, roll-off (RORO) facilities. Since 2010, the Philippine Ports Authority has completed 498 repairs and maintenance projects amounting to PHP 6.57 billion for port facilities and has been identified as the top operating condition, ensuring an unhampered port operation.[60]
## XIII. ROLL ON/ROLL OFF SYSTEM
In 2003, a policy was made to improve connectivity, especially on a small island in the Philippines, called the Ro-Ro or Roll-on/Roll-off port system, which ensures the needs of the trade and tourism sectors. It established an inter-island connectivity between Luzon, Visayas, and Mindanao. The concept of the RoRo system is that load-on and load-off shipping goods are delivered from the point of origin, unloaded, then loaded onto ships, carried to the next port, unloaded once more, and then loaded into other trucks for another journey. Moreover, as a result, load-on and load-off economic activity favors small and regional markets. The establishment of the RRTS links together the country through the Ro-Ro ships, and it also borrows links from the pre-existing Maharlika or
Pan-Philippine Highway, which is also designed to reduce the cost of the inter-island transfer of a country and serves as an alternative option for the Load-on/Load-off or Lo-Lo system. Before 2003, the Lo-Lo system was dominant in the mode of shipping. However, the small-scale shippers involved some shippers which are involved in cargo handling and wharfage.
The Ro-Ro policy was the government's attempt to expand the country's transport system with minimal investment. Thus, the island-to-island cargo shipment was called the Ro-Ro ferry terminal system or RRTS to other port infrastructures; the authorities allowed the conversion of the existing ports into R0-Ro and the private sector participation.
The collaboration between the PA and Manila Sports Car Club of MSCC, the Western Nautical Highway composed of the ports of Batangas, Mindoro, Caticlan Iloilo, Bacolod Dumaguete, and Dapitan in Zamboanga which sustains the growth of the Ro-Ro network. It also covers the Central and Eastern Seaboard Highways. The Central Nautical Highways comprises Pilar, Sorsogon, and Balingoan in Cagayan de Oro, while the Eastern Nautical Highways links the province of Biliran in Western Leyte to Surigao City.
Moreover, the foundation to its local partners affects sea transport: The Department of Agriculture, the Development Bank of the Philippines, the National Economic Development Authority, the Mindanao Business Council, the Philippine Chamber of Commerce and Industry, and the Supply Chain Management Association of the Philippines. Other agencies that directly assist the Philippine government are the Research, Educational, and Institutional Development Foundation (REID), the Asia Foundation, and USAID. (November 2010 Roll-on Roll-off Transport. (n.d.).
The pattern of development in the port of Manila was identified from the biographical location of the port that lies in the bodies of the Pasig River, which leads to local and international trade opportunities that highlight the Philippine products from raw to processed. The tool of exchanging goods also increased the port productivity from its establishment until the contemporary period and the economic productivity of each port and the Philippines.
Natural forces bring about the rise and fall of the port of Manila, which is the longer durée the long-term human factors such as the government and administrations, and finally, the decision and policy of the government of officials, which is the short term—the commensurate after the growth of the country as an engine of economic growth. Millions of pesos were generated by the use of ports and the value of goods and services as well as the passengers, and they are affected by human and natural factors.
The Port of Manila is strategic. During colonization, it was also an asset that served as collateral for 20 million pesos between Spain and the
American government for the Philippines' independence. During World War II, it became a strategic value for the Japanese to conquer Manila and different provinces.
In the modern period, the Port of Manila is an asset to the Philippine economy; millions of pesos come in and out, which signifies vast earnings for the government, the crown jewel of the Philippines, which is a key for economic growth.
The opening of other ports in the Philippines contributes to the development of the Philippine economy, especially in the import and export of commodities. However, the expansion led to additional services and equipment and increased port productivity.
The increase in productivity also leads to changes in the port industry, such as location, piers, machinery used, and policies. The expansion of the port area led to some ships/piers that cater to dock at the area; the number of piers that load and unload their goods, passengers who used ships instead of air travel, Ro-Ro buses also become the mode of passenger and goods transportation from island to island. Improvements in port machinery become the concern of the port industries, especially to the number of products that need to be shipped from island to island, the demand of the passengers both locally and internationally, and lastly, the competition from the ports in the Philippines and the world.
The port of Manila's geographical location provides excellent wealth to the Philippine economy. The location of Manila Bay, which is close to other neighboring Asian countries, the Pasig River continued even after the end of the galleon trade until the Americans came and expanded the port. It also directly involves establishments, shipping, mining, food, and supplies. At present, it contributes billions of pesos and is connected to other businesses, but it is also a victim of its success because it is a space subject to expansion and problems such as smuggling and maritime disasters.
Generating HTML Viewer...
References
35 Cites in Article
(1990). Unknown Title.
(1991). Tennessee Valley Authority annual report 1982. Volume II - appendixes for the fiscal year ending September 30, 1982.
W Wolff (1993). OTEC thermal resource report for Manila, Philippine Islands.
statistics" -Cebu Port Authority.
(2024). Acknowledgments.
Encarnacion Alzona (1971). Galicano Apacible: Profile of a Filipino Patriot.
Dominador Aytona (1761). Fiscal and Monetary Policies and Foreign Trade.
Tek Lim Sian The Fookien Times Yearbook.
Manila (1761). Unknown Title.
W Wolff (2008). OTEC thermal resource report for Manila, Philippine Islands.
(2005). Afghan-American Chamber of Commerce : activities and achievements for 2003-04 / Afghan-American Chamber of Commerce..
Donna Banuelos,P Christine,Ma Rosario,Tamayo (2016). Implementation of the Marketing Strategies Employed at Philippine Ports Authority in Batangas City, Philippines.
Manuel Buenafe (1955). Multilateral Trade Negotiations: Business View.
M Dachyar (2012). Simulation and Optimization of Services at Port in Indonesia.
Esteban De Ocampo (1994). First Filipino Diplomat: Felipe Aconcillo (1859-1941.
Rikki Lauren N. Aquino,Paulene J. Coronado,Margaret Ann M. Felarca,Christine Victoria M. Novilla,Ma Rebecca Fatima P. Ramirez,Arielle Nicole F. Serrano,Renee Anonna T. Vergara,Eleanor Marie Bahrami-Hessari,M M.S.Ed (2008). EMOTION, REACTION, PERMISSION: A CASE STUDY ON HOW CHILDREN RESOLVE TURN-TAKING DILEMMAS.
Eva-Lotta Hedman,John Sidel (2000). Philippine Politics and Society in the Twentieth Century.
Lakshmi Iyer,Noel Maurer Colonial Rule, Property Rights and Economic Development in the Philippines.
Arsenio Lacson (1961). The Manila Reclamation Program.
Tek Lim Sian (1961). The Fookien Times.
Benito Legarda,Jr (1999). After the galleons: foreign trade, economic change & entrepreneurship in the nineteenth century Philippines.
John Lerkin (1984). The International Face of the Philippine Sugar Industry, 1836-1920.
Gerard Lico,Rey (2012). The Allied Arts.
Manila (2014). a Tradition in Trade.
Apolinario Mabini The Philippine Revolution by Apolinario Mabini (Translated from the Original Spanish).
Hilde Meersman,Eddy Van De Voorde,Thierry Vanelslander (2012). Port Congestion and Implications to Maritime Logistics.
John Mcandrew (1994). Urban Usurpation: from Friar Estate to Industrial Estate in a Philippine Hinterland.
Mary Palma,Ann (2009). Maintaining good order at sea: maritime challenges and priorities in the Philippines.
Profile of Philippine Ports: Third Edition.
Gerardo Sicat (2003). The Philippine Economy During the Japanese Occupation.
No ethics committee approval was required for this article type.
Data Availability
Not applicable for this article.
How to Cite This Article
Ivan Kaye Bantigue. 2026. \u201cBeyond Inevitability: Manila as a Capital and Maritime Hub in the Contemporary Period\u201d. Global Journal of Science Frontier Research - E: Marine Science GJSFR-E Volume 24 (GJSFR Volume 24 Issue E1).
Explore published articles in an immersive Augmented Reality environment. Our platform converts research papers into interactive 3D books, allowing readers to view and interact with content using AR and VR compatible devices.
Your published article is automatically converted into a realistic 3D book. Flip through pages and read research papers in a more engaging and interactive format.
Our website is actively being updated, and changes may occur frequently. Please clear your browser cache if needed. For feedback or error reporting, please email [email protected]
Thank you for connecting with us. We will respond to you shortly.