I. INTRODUCTION
The most important natural resource on Earth is groundwater. Groundwater makes up more than of the available freshwater (Fetter, 2001). It serves more than two billion populations as a drinking water source worldwide (Carrard et al., 2019). Therefore, to achieve Sustainable Development Goal 6, which seeks to ensure that everyone has access to clean and safe drinking water, sustainable exploitation of groundwater must be actively pursued. Approximately of Ghana's populace relies on groundwater due to its generally suitable quality, cost effectiveness, and lower susceptibility to pollution (Akurugu et al., 2020). This is the primary source of water for domestic, agricultural, and industrial activities. In these arid zones of Ghana, which have less rainfall with extreme temperatures, there is a heavy reliance on groundwater due to urbanization and intensive agricultural activities.
While groundwater quality is generally considered to be safe, it is essential to conduct thorough hydrogeochemical and hydrogeological assessments of aquifer characteristics in these regions (Acheampong et al., 2024). This ensures the water is of the desired quality for domestic use, irrigation, and industrial purposes. Several factors in literature, such as the extent of chemical decomposition, geology, replenishment of water quality, and rock-water interaction, have been identified as influencing groundwater quality (Abanyie et al., 2023).
The current study evaluates the quality of groundwater in the Kassena Nankana, Bawku West, and Garu-Tempane districts of Ghana, specifically for domestic and irrigation use. Access to safe water is crucial for minimizing health risks and increasing agricultural productivity, which, in turn, contributes to economic empowerment. The study findings provide a valuable resource for exploring groundwater resources in these three districts for domestic and irrigation purposes.
II. METHODOLOGY
a) Study Area Description
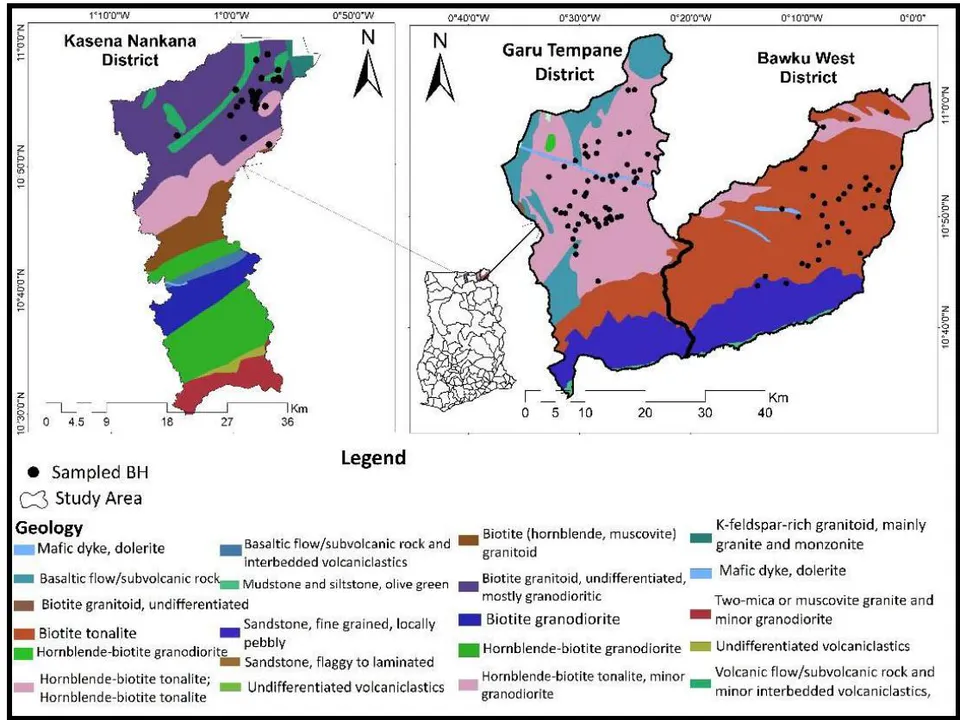
Bawku West, Garu Tempane, and Kassena Nankana districts in Ghana's Upper East region were the sites of the study (Figure 1). The "Sudan Savannah climate region," in which these districts are situated, is distinguished by high temperatures and evapotranspiration (Yiran et al., 2016).


The research region experiences a long dry season that lasts for six to eight months every year, along with an unimodal rainfall pattern that lasts for four to six months (Ghana Meteorological Agency, 2020): May – June to September–October respectively. On average each year, the rainfall amount varies from 800 to . The Ghana Meteorological Agency (2020) reports that March through April recorded (the monthly maximum mean temperature), while December through January had (the minimum average temperature). The interior savannah according to the Ghana Meteorological Agency (2020) records the minimum rainfall amount. Groundwater is the most practically and economically viable source of clean drinking water for the remote and rural communities in these areas because of the dry climate conditions in the study area (Zakaria et al., 2020; Dapaah-Siakwan and Gyau-Boakye, 2000). The study area's primary livelihood is centred around agriculture, with the local population relying heavily on groundwater for irrigation and domestic needs daily.
According to the Geological Survey of Ghana (2009), (granitoid of the "Tamnean" Plutonic Suite) igneous rocks underlie the study area. This includes minor granodiorite, quartz diorite and tonalite. Hardpan: lateritic sandy gravels in a fully cemented clay matrix, make up the majority of the topsoil. There is a micaceous layer underneath this regolith, a mixture of quartz gravels and sand with silt. Granitoids make up the bedrock, claims Acheampong et al. (2024). With a few exceptions, the study area's groundwater depth is comparatively shallow, ranging from 12 to 25 meters below the surface of the earth (Acheampong, 2017). Three layers of the district profile - topsoil, regolith, and bedrock have been confirmed by previously drilled logs, which have been drilled down to a depth of up to 50 meters.
b) Water Sampling and Quality Testing
Results of water quality tests were gathered and examined for groundwater samples drawn from 121 boreholes in the research area. The non-governmental organizations and public institutions ran these water quality tests from 2014 to 2021. The groundwater sampling and water quality testing followed the standard protocols proposed by Appelo and Postma (2005) and APHA (1995). The portable HQ40d18 series meter was used to take field readings of electrical conductivity (EC), total dissolved solids (TDS), and pH.
The dominant cations , and ) and dominant anions , and were analyzed at the laboratory of the Water Research Institute (WRI), Accra. The Flame Photometer was used to take the concentrations of and , while Atomic Absorption Spectrometry (AAS) was used to determine the concentrations of and . Cl and concentrations were measured using titrimetry, was determined using an Ultraviolet Spectrometer, and concentrations were estimated using the Brucine reagent.
c) Data Analyses
Using the anion-cation balanced technique, the water quality results accuracy was checked. This technique postulates that quality water ought to have a neutral charge. Using Equation 1, the charge balance error (CBE) was calculated:
Where:
is the cations summation, and
is the anions summation.
Sixty per cent of the computed CBE figures were within the acceptable limit of to . Based on this, the results were deemed suitable for use in the study. The water quality data was spatially analysed with the ArcGIS 10.3.1. The ArcGIS software allows for the interpolation of various derived water quality indices and groundwater quality parameters specific to the study area. Kriging, a commonly used interpolation technique in similar research (Asare et al., 2021; Kawo and Karupppannan, 2018), was employed.
i. Groundwater Quality Appraisal for Domestic use
The data was analyzed statistically using the Statistical Package for the Social Sciences (SPSS). The MS Excel® spreadsheet was used to prepare the data for analysis, and then it was transferred to SPSS to determine the descriptive statistics. The water samples' quality was assessed by calculating their Water Quality Index (Horton, 1965). The Water Quality Index (WQI) is generally employed to evaluate groundwater quality (Boateng et al., 2016; Patel et al., 2023; Zotou et al., 2018; Zhang et al., 2020; Chegbeleh et al., 2020).
This technique assesses the effect of comparative physicochemical parameters on groundwater with its overall health hazard. The goal is to simplify complex water quality results and make them more easily understood and applicable to everyone. After reviewing the literature and considering each parameter's significance in the quality of groundwater, weights were given, with higher weights given to the most significant parameters. Bicarbonate, which has minimal influence on quality evaluation, was assigned the least weight of one (1). A weight of two (2) was assigned to calcium and magnesium because they have a low impact on water quality. EC, pH, Cl−, and SO4− were given weights of four (4) due to their moderate influence on drinking water quality assessment (Tiwari et al., 2014).
Nitrate was assigned the highest weight of 5 because it is the most significant factor in water quality evaluation (Boateng et al., 2016; Srinivasamoorthy et al., 2008). The WHO (2017) guideline values, along with the assigned weights (Wi), are presented in Table 1. Equation (2) was utilized to calculate the relative weight (Wr):
Where:
Wr (relative weight), wi (every physicochemical parameter weight), and n (number of parameters used).
| Parameter | pH | EC | Ca2+ | Mg2+ | NO3- | HCO3- | SO42- | Cl- |
| WHO GV | 6.5-8.5 | 750 | 75 | 50 | 50 | 200 | 250 | 250 |
| Weight (Wi) | 4 | 4 | 2 | 2 | 5 | 1 | 4 | 4 |
Every parameter quality rating (Qr) was computed per the guidelines of WHO (2017) using Equation (3):
where (quality rating), (concentration of the ith chemical parameter in mg/L), and (WHO 2017 guideline value for the ith chemical parameter). Every groundwater sample WQI was subsequently calculated using Equation (4) and classified using Table 3.
ii. Groundwater Quality Assessment for Irrigation
The water irrigation water quality was evaluated through three irrigation indices - Sodium Adsorption Ratio (SAR), Permeability Index (PI), and Soluble Sodium Percentage (Na%). SAR and soluble sodium percentage (Na%) are commonly employed in determining groundwater appropriateness for sustaining plant growth and crop yields (Asare et al., 2021). SAR measures the ratio of sodium ion to calcium ion and magnesium ion in the water extracted, making it a crucial index for evaluating groundwater for irrigation purposes (Asare et al., 2021). SAR values were calculated for all the samples using Equation (5):
With all ion concentrations in meq/L.
Irrigation water with a higher sodium ion content can displace and in soils, resulting in soil formation loss. This, in turn, reduces the potential of the soil in stable aggregate formation (Anim-Gyampo et al., 2018). Moreover, it can also decrease the soil's infiltration and permeability capacities, negatively impacting crop yield. In this study, this relationship was evaluated using the following assessment:
In the literature, several studies have shown that long-term use of certain groundwater, particularly groundwater high in minerals, can gradually change the soil permeability over time (Khalid, 2018; Doneen, 1975). This alteration in soil permeability is a result of extensive irrigation with large quantities of water containing calcium (Ca), bicarbonate , sodium (Na), and magnesium (Mg), which leads to waterlogging, increased alkalinity, and salinity. The groundwater permeability index (PI) assessment in this study was conducted using Equation (7) as described by Doneen (1975).
Concentrations of ions in meq/L.
III. RESULTS AND DISCUSSION
a) Physicochemical Parameters
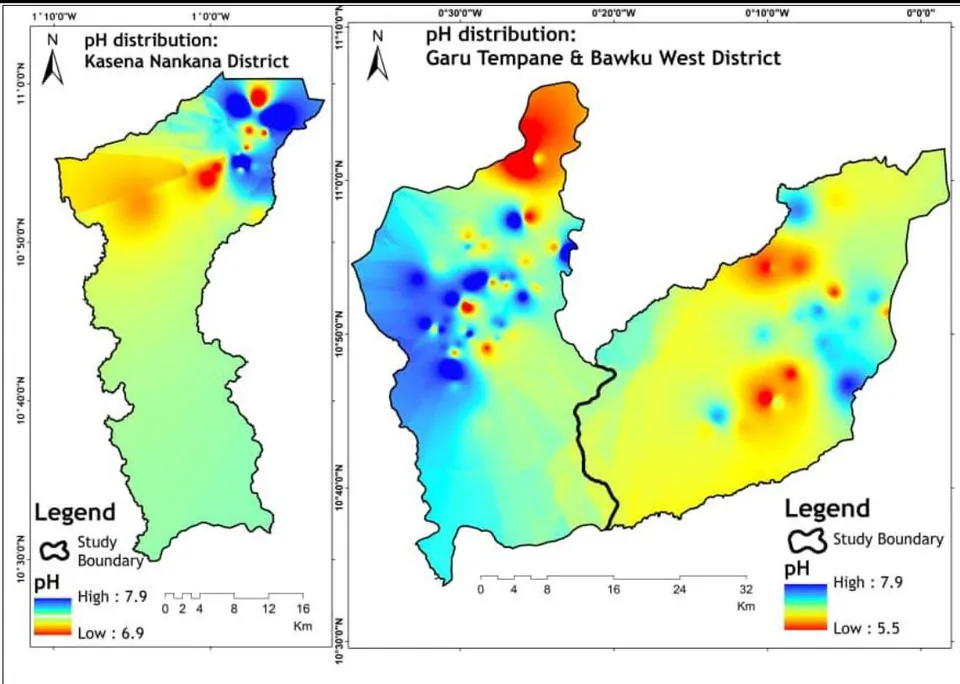
The chemical analysis results reported in Table 2 show that the pH ranges from 5.5 to 7.9, and a mean of 7.0. Approximately of the sampled water has a pH below 7.5, indicating that the water samples are slightly acidic, as shown in Figure 2. The recorded minimum pH values in the samples may be attributed to the granitoid geologic formation found in the study area, which mainly produces acidic groundwater. Specifically, Tempeligo and Yelwoko Agbaribeugo, both in the Bawku West District, recorded pH values of 5.5 and 5.6, respectively. Overall, the study area's pH in the groundwater is deemed appropriate for domestic use. However, for the two outliers with very low pH levels, neutralizing filters containing calcium carbonate or magnesium oxide can be used to make the water safe for consumption.
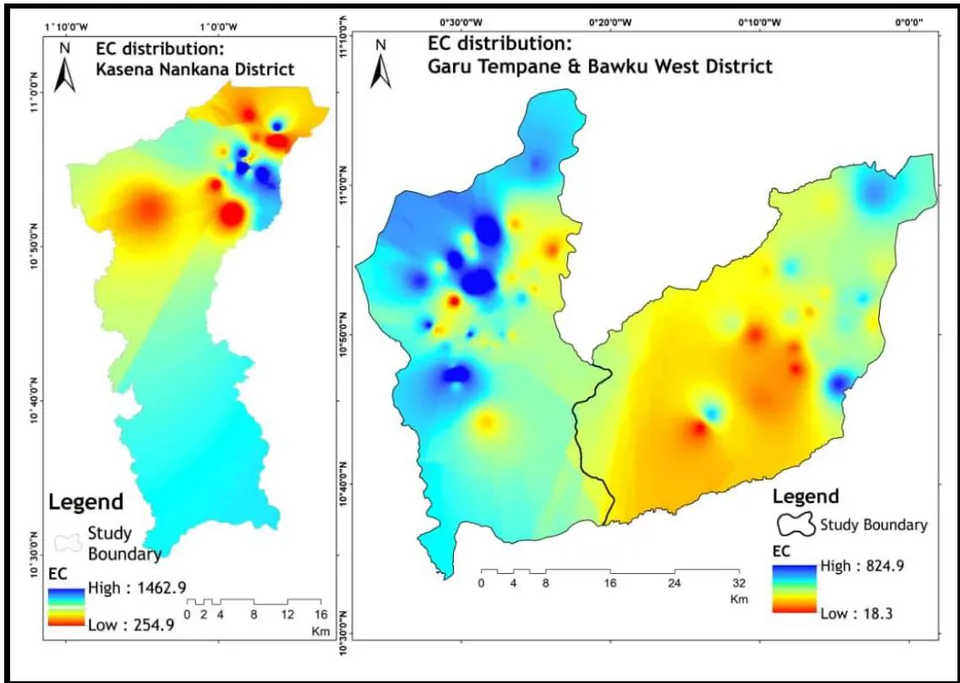
The water samples in-situ electrical conductivity (EC) varied from a low value of (at Kameaga, Bawku West District) to a high value of 1,503.64 (in Atibabisi, Kassena Nankana East District), and a mean of 326.08 . Approximately of the sampled groundwater (Figure 3 and Table 2) falls in the acceptable WHO (2017) drinking water guideline values in terms of EC. Ramesh and Elango (2011) reported that the EC value changes could be dependent on factors such as man-made activities, rock-water interaction, evaporation, silicate decomposition, and ionic exchange. About of the EC values recorded in Bawku West and Kassena Nankana East Districts (Figure 2) exceeded the allowable limits set by the WHO (2017) guidelines, which can be rockwater interaction or silicate weathering.
| Parameter | Min | Max | Mean | SD | WHO Guideline Values (GV) | % above WHO GV |
| pH | 5.53 | 7.92 | 6.99 | 0.43 | 6.5 - 8.5 | 9.92 |
| EC (μS/cm) | 12.73 | 1503.64 | 326.08 | 198.33 | 750 | 4.96 |
| Cl-(mg/L) | 0.04 | 11.27 | 0.31 | 1.04 | 250 | 0.83 |
| SO42-(mg/L) | 0.00 | 7.26 | 0.27 | 0.73 | 250 | 0.83 |
| HCO3-(mg/L) | 0.11 | 4.83 | 1.64 | 0.92 | 200 | 5.79 |
| NO3-(mg/L) | 0.00 | 1.13 | 0.10 | 0.18 | 50 | 0.85 |
| Na+(mg/L) | 0.02 | 5.27 | 0.88 | 0.84 | 200 | 0 |
| K+(mg/L) | 0.00 | 0.51 | 0.05 | 0.06 | 100 | 0 |
| Ca2+(mg/L) | 0.00 | 5.47 | 0.75 | 0.98 | 75 | 1.65 |
| Mg2+(mg/L) | 0.01 | 3.81 | 0.71 | 0.70 | 50 | 0 |
All the dominant ions measured were generally within the allowable limits for potable water according to the guidelines of WHO (2017). The major cation was
, while was the major anion (Table 4.2). Based on the mean values computed, the order of ions occurrence in the analyzed samples is
for cations, and . Na+for anions. Na+is commonly found in water, plants, foods, and soils, and it is the most abundant cation within this area.
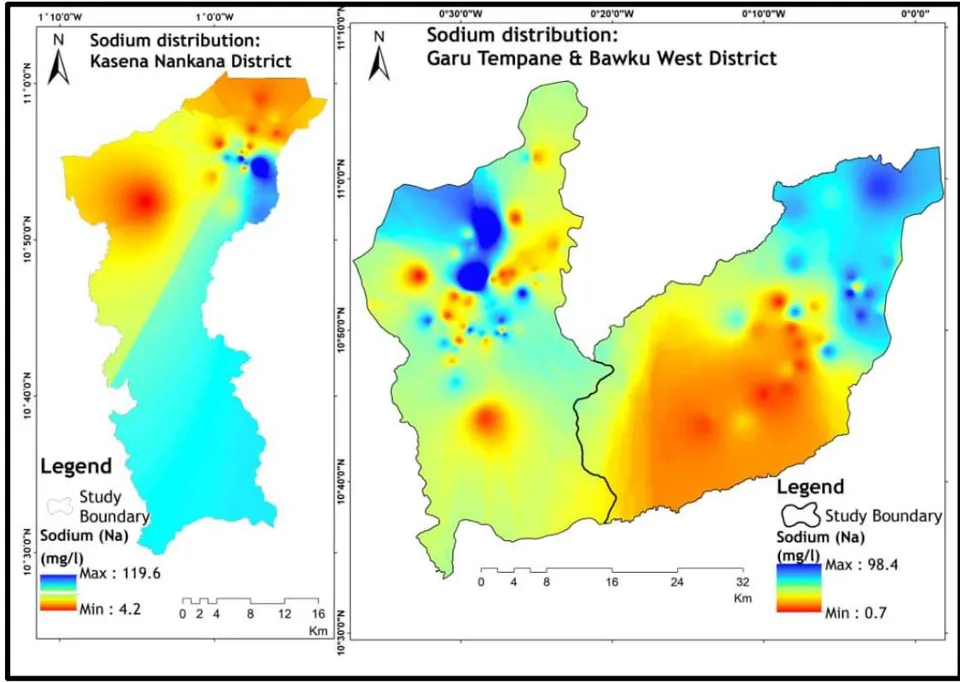
The study area's sodium ion distribution is shown in Figure 4. The presence of maximum levels of sodium ionsindicates the existence of young or recharging waters. Sodium ions can naturally occur through the weathering of albite (plagioclase feldspar), the dissolution of halite and clay, as well as from sources such as seawater intrusion, and municipal and agricultural waste (Srinivasamoorthy et al., 2008). The study area's prevalent minerals are Na-rich feldspars, specifically albite, due to the underlying geology (Anim-Gyampo et al., 2018). Therefore, the decomposition of albite could result in the release of sodium ions into the soil, which can then enter the groundwater. This study area is located away from the ocean, waste sites, and halite deposits, and is underlain by granitoids. Thus, the decomposition of the albite (silicate mineral) is likely the primary origin of sodium within this area. Equation 8 illustrates the chemical reaction involved in the decomposition of albite and the generation of sodium ions.
(Albite) (Kaolinite) (Silicic acid)
According to the WHO (2017) guideline values, all of the groundwater studied has permissible concentrations of for potable water consumption.
Therefore, it is desirable for human use, as sodium is an essential nutrient for good health when present in sufficient amounts in water.
The Calcium ion concentration in the groundwater ranges from 0.00 to , and a mean concentration of . Calcium ion is the second most prevalent cation within the area studied. Approximately of Calcium ion concentrations fall outside the acceptable range set by the WHO (2017) guidelines. Silicate mineral (anorthite) decomposition, as well as the dissolution of gypsum, calcite, and dolomite, can naturally release into groundwater. Prolonged agricultural activities can also influence release to groundwater systems (Bohlke, 2002). The study area is characterized by granitoid bedrock and is located at a distance from municipal waste sites. The decomposition of the silicate mineral anorthite appears to be the groundwater's main supply of calcium. Adequate levels of calcium in drinking water are beneficial to human health as they promote bone mass, help prevent certain types of cancer, and can hinder the process of heavy metals being taken in by humans (Bohlke, 2002). However, excessive levels of calcium can have negative


effects on the health of humans, by interfering with the intake of other equally important minerals. The decomposition of the anorthite silicate mineral is depicted in Equation 9:
(Anorthite) (Silicic acid)
The analysis of magnesium ion concentration indicates a range of 0.01 to and an average value of . All magnesium ion concentrations were within permissible limits, according to the WHO (2017) guideline figure of . The least abundant cation was potassium ion , with a mean concentration of and a range of 0.00 to 0.51 mg/L. The groundwater sampled had potassium ion concentrations within acceptable levels, according to the 2017 (WHO) guideline figure of . It is worth noting that high drinking water with potassium concentrations has been linked to increased blood pressure in several studies (Filippini et al., 2016; Cappuccio and MacGregor, 1991; Reddy et al., 2015). All the groundwater samples met the desired quality standards for . For anions, the most dominant one is the bicarbonate ion, while nitrate is the least dominant.
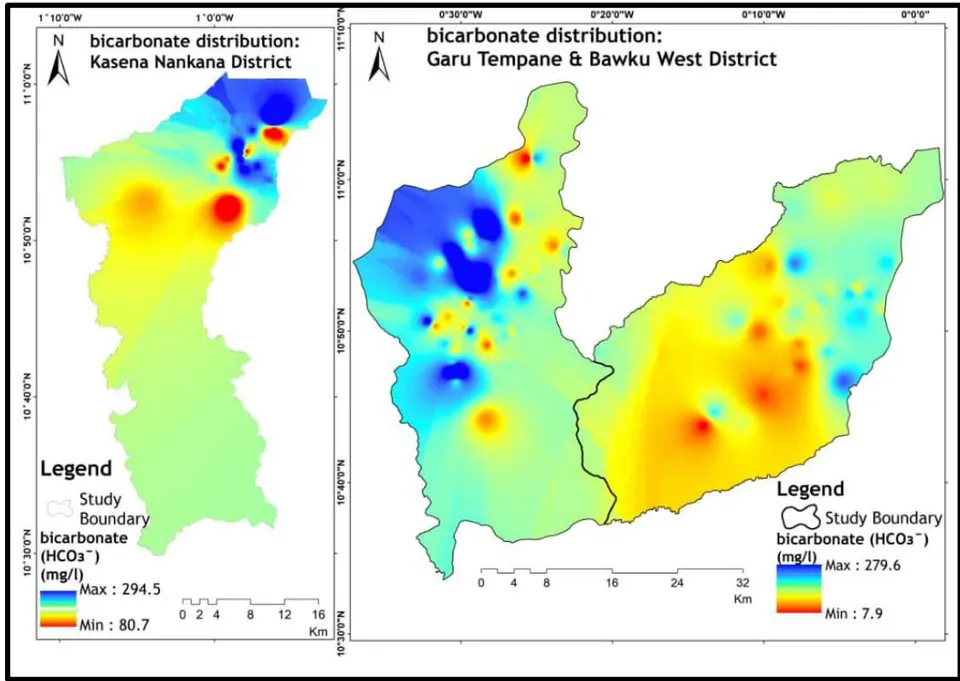
Both groundwater and soil organic matter (James, 1984) generate bicarbonate through the oxidation reaction of carbon dioxide (CO2). Approximately of the groundwater samples had which exceeded the 2017 (WHO) acceptable range for portable water (200 mg/L) (Figure 5). The high bicarbonate ion concentrations could be a result of the soil organic matter abundance and high oxidation resulting from the metabolic activities of microorganisms. Consequently, the origin of within the study area's groundwater can be attributed to the interaction of silicate minerals with atmospheric CO2. Nitrate concentrations in approximately of the sampled groundwater exceed the 2017 (WHO) guideline figure of 50 mg/L. This low recorded nitrate concentration may be due to reduced use or the absence of nitrogen fertilizers within the area studied.
The concentrations of chloride range from 0.04 to , and an average concentration of 0.31 mg/L. Approximately of the sampled water had Cl concentrations falling short of the WHO (2017) guideline value. This falls in the desirable portable water range and makes the groundwater suitable for consumption. Excess chloride in water does not pose significant health risks to humans. However, maximum chloride concentrations could adversely affect the taste of water and potentially make it corrosive. It
may also have a detrimental impact on how permeable and porous a soil would be (Anim-Gyampo et al., 2019). The low correlation between Cl and suggests that the source of chloride is unlikely to be halite but probably comes from precipitation. The concentrations of sulfate in the study area have an average value of and range from 0.00 to . Approximately of the sampled water exceeded the 2017 (WHO) allowable range of for sulfate in portable water.
b) Water Quality Index Assessment
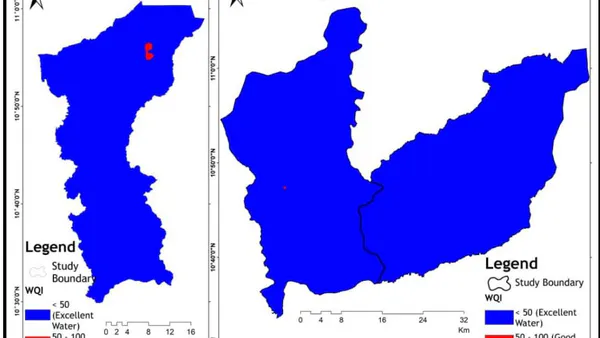
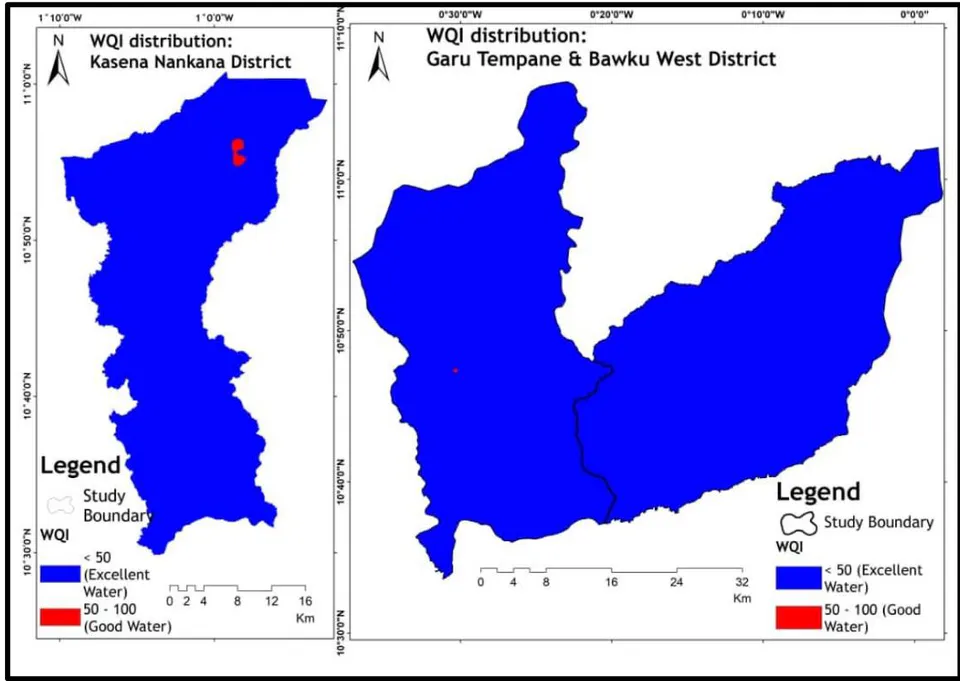
The analysis, based on the Water Quality Index, reveals that approximately of the study area's groundwater has excellent water quality (WQI ) for domestic consumption (Table 3). Figure 6 indicates the study area's WQI distribution.
| WQI Range | Water Type |
| < 50 | Excellent |
| 50 – 100 | Good |
| 100 – 200 | Poor |
| 200 – 300 | Very poor |
| > 300 | Unsuitable drinking purposes |
Groundwater Water Types
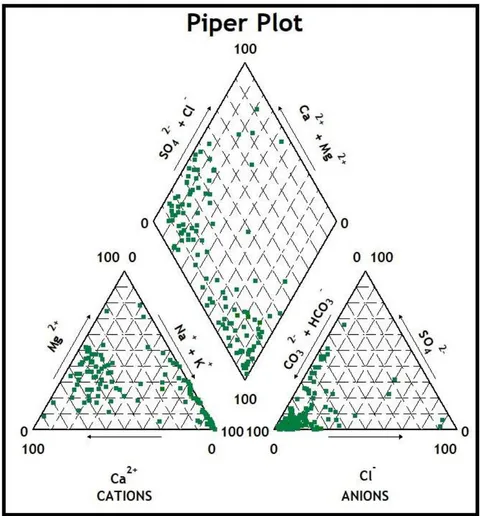
Three prominent distinct classes of water types were found within this area, and as indicated on the Piper plot (Figure 7): NaHCO3 , which is typical of deep groundwater influenced by ion exchange; CaHCO3 , which is typically from a shallow fresh groundwater source; and CaSO4 (6%), which is typical of gypsum and Acid Mine Drainage. Because of the study area's igneous plutonic origin and generally shallow groundwater table, the dominance of the NaHCO3 and CaHCO3 water types was predicted. Additionally, because there is no mining activity within

the area and granitoid is the main underlying formation, the breakdown of silicate minerals (albite and anorthite) can be the only origin of calcium and sodium in the groundwater. There was only one type of NaCl water detected in the samples; this could be because deep, ancient groundwaters and marine/ocean environments are absent from the region.
c) Groundwater Suitability for Irrigation
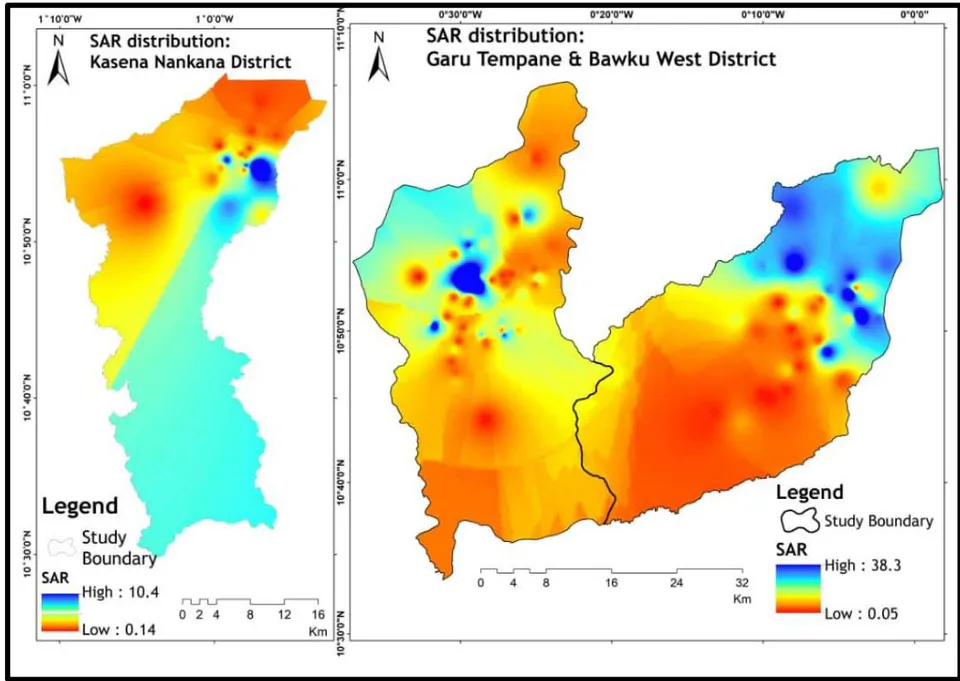
The composition of minerals in groundwater influences plants and soils and determines their suitability for irrigation. High saline water can physically damage plant growth, limiting its ability to absorb water. It is thus important for irrigation purposes, to evaluate groundwater to determine its potential to harm crop growth and the living things that consume these crops (Rhoades et al., 1992). The irrigation suitability of the groundwater was evaluated using the sodium absorption ratio (SAR), , permeability index (PI), and other classification charts. The study area's spatial distribution of SAR (Figure 8) revealed that approximately (water sampled) had a SAR value of less than 10, categorizing it as excellent for irrigation water use (Shah and Mistry, 2013; Egbi et al., 2018).
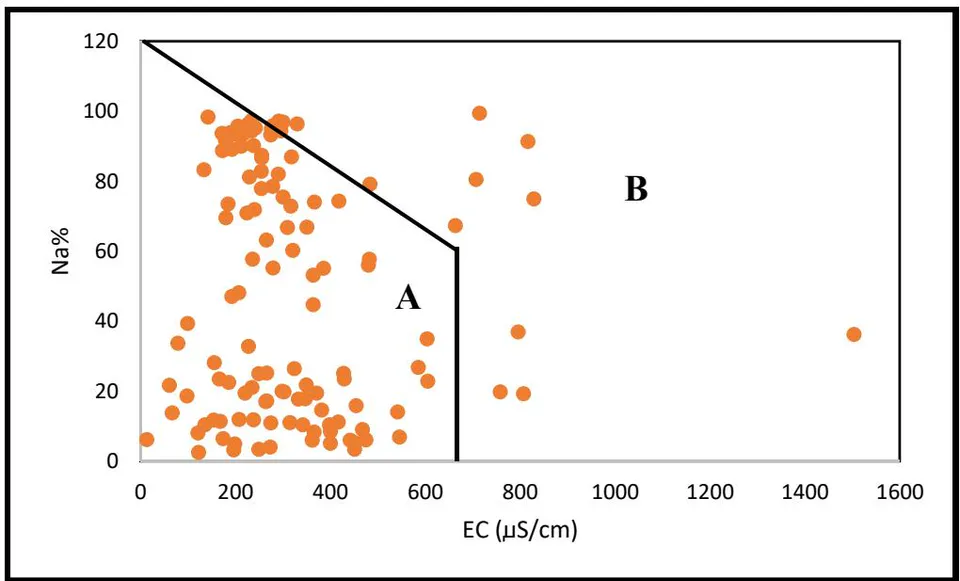
Using Doneen's (1975) classification chart, the analyzed groundwater permeability index (PI) values had about above 75, indicating their suitability for irrigation purposes. About of the samples recorded PI values ranging from 25 to 75 and were classified as moderately fit for purposes of irrigation. Furthermore, the irrigation water classification was performed using the Wilcox (1955) chart. This chart categorizes water into five different classifications according to and the corresponding EC measurement. Hard water indicates a low soluble sodium percentage, while soft water indicates the opposite. In the study area (Figure 10), two classes of irrigation water quality were observed: Class A and Class B. Class A, which accounts for of the samples, represents excellent to good irrigation water quality. Class B, on the other hand, represents of total samples and indicates good to allowable irrigation water quality, as shown in Table 4 and Figure 10. Therefore, the area generally has groundwater of suitable quality for irrigation purposes.
| Class | % Samples | Suitability |
| A | 91 | Excellent to good |
| B | 9 | Good to permissible |
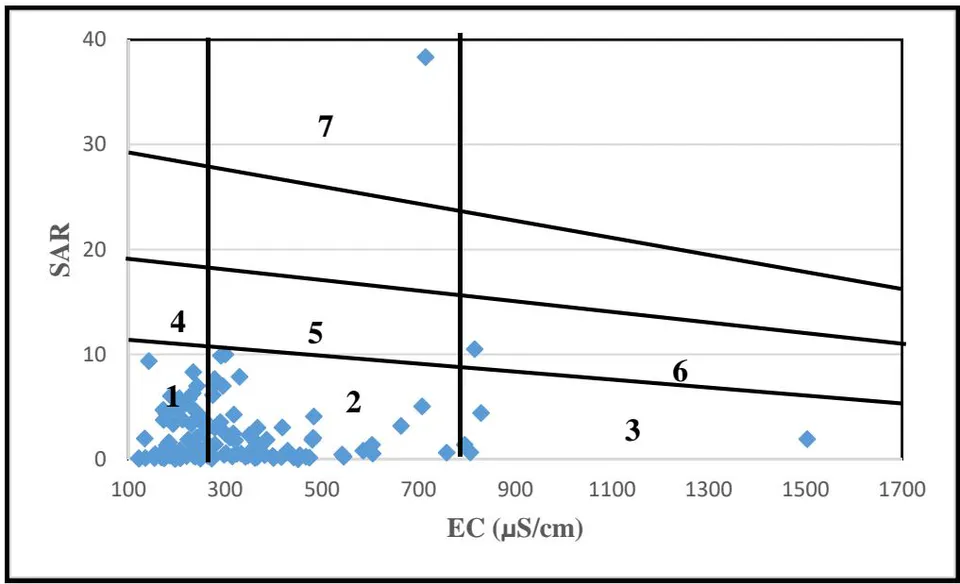
Overall, approximately of the total area exhibits minimal to medium salinity, and minimal sodium hazard water (Table 5 and Figure 10). This indicates that generally, the area's groundwater has the potential for irrigation use in all soils, without causing significant harm (Wilcox, 1948).
| Zone | % Samples | Classification |
| 1 | 62 | Minimal Salinity with Minimal Sodium hazard (C1-S1) |
| 2 | 30 | Moderate Salinity with minimal Sodium hazard (C2-S1) |
| 3 | 3 | High Salinity with minimal Sodium hazard (C3-S1) |
| 4 | 1 | High Salinity with moderate Sodium hazard (C1-S2) |
| 5 | 2 | Moderate Salinity with moderate Sodium hazard (C2-S2) 6 |
| 6 | 1 | High Salinity with moderate Sodium hazard (C3-S2) |
| 7 | 1 | Moderate Salinity with very high Sodium hazard (C2-S4) |


IV. CONCLUSION
The current research has evaluated the groundwater quality in the districts of Kassena Nankana, Bawku West, and Garu Tempane in Ghana for domestic use and irrigation activities. The geochemistry of the groundwater reveals that it is appropriate for human consumption and irrigation. According to the study area's integrated findings of the WHO (2017) guidelines and the Water Quality Index (WQI), the groundwater is excellent for human consumption. The results of the analysis, based on the irrigation suitability indices (SAR, Na%, PI, and EC versus Na%), demonstrate that about of water studied falls within acceptable limits for irrigation. This suggests that for irrigation activities within the area, the groundwater is generally wholesome.
Sodium, calcium, magnesium ions, chloride, bicarbonate, and sulfate all play crucial roles in the geochemical processes and have a significant influence on the quality of groundwater within the area. Sodium ion is the most abundant cation, while bicarbonate is the prevailing anion. However, bicarbonate is the dominant ion within the area studied. The groundwater quality is primarily influenced by geological factors, with a lesser anthropogenic effect. The information provided in this study guide serves as an exploration guide for water resources within the area, specifically for irrigation and domestic use. However, it is important to note that this study approach has certain limitations. Moving forward, it will be necessary to conduct an assessment of the groundwater quantity and enhance the data collection process to support future studies within the area. These findings will greatly help in the effective, sustained development and management of the study area's groundwater resources.
ACKNOWLEDGEMENT
The public institutions and non-governmental organizations in WASH are much appreciated for providing us with the data to undertake this research.
Declarations
Conflict of Interest: In both content, financial and non-financial, the writers disclose no competing interests.