## I. INTRODUCTION
Saurida undosquamis is the most commercially important fish dominating the other species from the bottom trawl fishery in the North West Red Sea. Landings of S. undosquamis represent the first catch category from the trawl fishery. The landings of the lizard fishes constitute about $30\%$ of the total trawl catch in the Gulf of Suez. Economically, S. undosquamis comes in the second order after the large shrimps. Due to lack of scientific management, occasionally open access, unselective fishing methods and fishing in the spawning areas and nursery grounds, fisheries of the Gulf of Suez may experience all types of overfishing, as growth and recruitment overfishing. Seasonal fishing landings from bottom trawl, purse seine and artisanal fisheries of the Gulf suffer deep fluctuations and continuous degeneration. Consequently, the factual fishing season mostly has been reduced to barely six months, ending during March, instead of May, since the fishing operation costs more than profit (GAFRD, 2022). S. undosquamis covers all the Gulf zones starting from Suez Bay in the north to strait of Gobal in the south, coming with all tows (Yousif, 2003).
The major obstacle that have prevented assessing the fish stocks in the developing countries and regions, since long time ago is the absence of stock assessment methods suitable for use in data-sparse situations. In addition to, lack of expertise and scarcity of data have contributed in that situation (Palomares et al., 2018). The latest development of the simple computer intensive fish stock assessment methods reliant basically on time series of catch data made such defects easy to overcome.
Monte Carlo Catch-Maximum Sustainable Yield (CMSY++) method is the most recent developed by Froese et al., (2017). CMSY++ can estimate fisheries reference points (MSY, $F_{MSY}$, $B_{MSY}$ ) besides relative stock size $(B / B_{MSY})$ and exploitation $(F / F_{MSY})$. The above essential reference points can be estimated using simple inputs as catch data, a prior for resilience or productivity (r), and broad priors for the ratio of biomass to unfished biomass (B/k) at the beginning, an intermediate year and the end of the time series. The advanced Bayesian state-space application of the Schaefer surplus production model BSM is included in the (CMSY++) model.
The stock reduction analysis (Kimura & Tagart, 1982; Kimura et al., 1984) motivated Martell and Froese (2013) to develop $\mathsf{CMSY+}$ as a Monte-Carlo method. Froese et al., (2017) updated $\mathsf{CMSY+}$ in order to resolve some problems.
The CMSY+ method was first used in Egypt by Yousif to manage the population of Siganus rivulatus in Suez Bay, Gulf of Suez (Nafea et al., 2022). The main advantage of BSM compared to other implementations of surplus production models is the focus on informative priors and the acceptance of short and incomplete catch-per-unit-of-effort (CPUE) data to estimate biomass (B) and the current status of Saurida unodsquamis in the Gulf of Suez. Also, key fisheries reference points such as intrinsic rate of population increase (r), carrying capacity (k), maximum sustainable yield (MSY), and the terminal ratio $\mathsf{B} / \mathsf{B}_{\mathsf{MSY}}$ are estimated. Since a long time ago, it has attracted researchers to study its biological and fisheries parameters using commercial landings and constant parameter fisheries models (e.g., Shenouda, 1969, Sanders & Kedidi, 1984, Sanders & Morgan, 1989, El-Ganainy, 1992 & 2003, Ramadan, 1995, Amin et al., 2007, and El-Etreby et. al., 2013).
## II. MATERIAL AND METHOD
### a) Study Area
The Gulf of Suez (Fig., 1) is a semi enclosed shallow basin extends westerly from north of the Red Sea with another Gulf (of Aqaba) extends easterly, and Sinai Peninsula separates them. The Gulf of Suez prolongs from nearly Lat. $30^{\circ}$ & Long. $32.5^{\circ}$ to southerly Lat. $27.5^{\circ}$ & Long. $34^{\circ}$. It is approximately 400 km long and varies in width between 40 km and 80 km. Depth varies between 13 m in the far north to 77 m in the far south (Yousif, 2003). The surface water temperature in the northwestern part of the Gulf vary from $18^{\circ}\mathrm{C}$ in winter to $28^{\circ}\mathrm{C}$ in summer (Pears, 1969). It is characterized by high salinity that exceeds $42\%$ in the northern third of the Gulf and drops below $40.4\%$ near the mouth (Abd El-Mongy and El-Moselhy 2015). It is one of the productive areas in the Red Sea where four main fishing ports are found (El-Salakhana, Attaka, Ras-Gharib, and El-Tour harbor). Bottom trawling, purse seine, long line and artisanal gears are used in the Gulf (El-Ganainy et al 2018).
 Figure 1: Gulf of Suez, with the distribution of Saurida undosquamis, (after Yousif, 2003)
### b) Catch Data
Forty-two years (1980-2021) of S. unodsquamis comprising annual bottom trawl landings from the Gulf of Suez were used in this study. The series of catch data were taken from the General Authority of the Fisheries Resource, Office in Suez (GFRAD).
The total catch of lizardfish was calculated in tons (t). The estimated average catch of S. unodsquamis was about 1115.6t, while the minimum catch was 133.4t in 1991, and the maximum was 2968.7t reported in 1997.
### c) Model CMSY++
Estimation of BRPs from catch and resilience data of S. unodsquamis was conducted using a Monte Carlo method-based Surplus Production Model SPMs called CMSY++. The CMSY++ can predict biomass using catch time series data.
This research used the CMSY++ approach to assess the Biological Reference Points (BRPs) MSY, B/BMSY, F/FMSY, k (carrying capacity), r (intrinsic growth rate of the fish population) related to S. unodsquamis.
$$
B _ {(t + 1)} = B _ {t} + r (1 - B _ {t} / k) B _ {t} - C _ {t} \tag {1}
$$
The biomass exploited in $(t + 1)$ year is $B_{(t + 1)}$, existing biomass is $B_{t}$, and catch in $t$ year is $C_t$. Equation (2) is used when stock sizes are severely depleted, and biomass falls below $1/4$ k.
$$
B _ {(t + 7)} = B _ {t} + 4 \left(B _ {t} / k\right) r \left(1 - B _ {t} / k\right) B _ {t} - C _ {t} \mid B _ {t} / k < 0. 2 5 \tag {2}
$$
The Fish Baseresilience score for S. unodsquamis is "medium" so the prior range for $r$ is 0.2-0.8 used as the input parameter in the CMSY++ (Table, 1). The prior range of $k$ is determined using three assumptions: the unexploited stock size ( $k$ ) > largest catch in the time series, the maximum sustainable catch ( $F_{MSY}$ ) is productivity-dependent, and the maximum catch represents a more significant fraction of $k$ in significantly depleted stocks than in lightly depleted stocks. By default, and based on the anticipated degree of depletion, probable biomass ranges (Table, 1) provide prior estimations of relative biomass at the beginning and end of time series data.
The technique of the CMSY+ method, since 2017 (Froese et al., 2017) has been continually updated and developed and is currently accessible as CMSY++ (Froese et al., 2021).
Table 1: Distributions of the priors for $\mathrm{{CMSY}} + +$ used for S. unodsquamis
<table><tr><td>Input Parameters</td><td>Ranges of the Values</td></tr><tr><td>Prior initial relative biomass</td><td>0.2-0.6</td></tr><tr><td>Prior intermediate relative biomass</td><td>0.1 - 0.391 in a year (2014) default</td></tr><tr><td>Prior final relative biomass</td><td>0.128 - 0.451 default</td></tr><tr><td>Prior range for r</td><td>0.2 - 0.8 expert</td></tr><tr><td>Prior range for k*1000</td><td>7.13 - 43.4</td></tr><tr><td>Prior MSY*1000</td><td>1.75</td></tr><tr><td colspan="2">B/k prior used for first year in BSM and intermediate year and last year.</td></tr><tr><td>Prior range of q</td><td>0.24 - 5.83</td></tr><tr><td>Assumed effort creep</td><td>0.02%.</td></tr></table>
## III. RESULTS
### a) CMSY++ Derived Biological Reference Points (BRPs)
The $\mathrm{CMSY}++$ method delivered important stock information and BRPs (Table, 2). The catch fit diagram (Fig., 1A) depicted a general gradual decrease and fluctuation from the year 1980 to 2021. The seasonal landings of S. unodsquamis from the Gulf of Suez, Red Sea was as follows: the highest catch $(3.0^{*}1000t)$ was observed in 1987, while the lowest catch $(1.3^{*}1000t)$ was reported in 1991.
Table 2: CMSY++ estimated Biological Reference Points BRPs (k, r & MSY) of S. unodsquamis in the Gulf of Suez with 95% confidence intervals (CI), Bayesian Schaefer Model (BSM) using catch & CPUE
<table><tr><td>k (1000ton), 95%CI</td><td>r (year-1), 95%CI</td><td>MSY (1000ton), 95%CI</td><td>B/k (2021), P. (2.5th -97.5th)</td><td>E;{F/(r/2)} (2021), P. (2.5th -97.5th)</td></tr><tr><td>18.2, (11.9-30.7)</td><td>0.304, (0.185-0.468)</td><td>1.4, (1.17-1.73)</td><td>0.315, (0.21-0.427)</td><td>1.29 (0.779-2.44)</td></tr></table>
### b) $CMSY++Assessment$
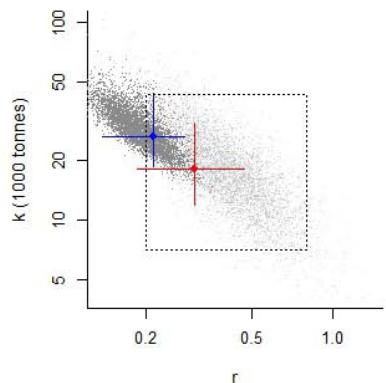
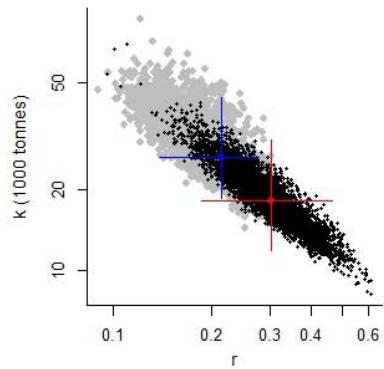
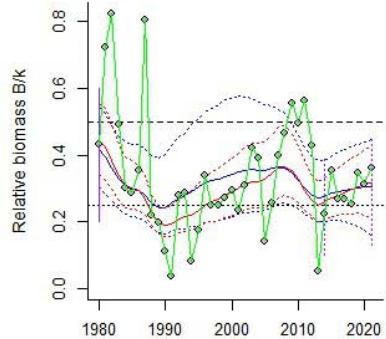
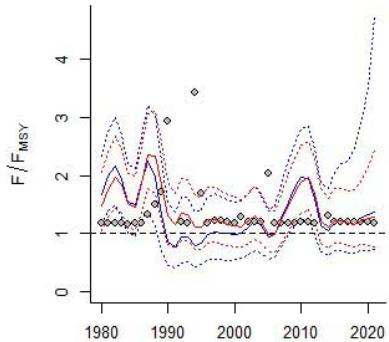
Figure (2) shows the $\mathrm{CMSY}++$ assessment graphs;
1. The black curve in A shows the time series of catches and the blue curve shows the smoothed data with an indication of the highest and lowest catch in red, as used in the estimation of prior biomass by the default rules. Catch shows higher values during the first two-thirds of the eighteens and then gets down to lower fluctuated values to the end of the investigated catch time series.
2. Panel B shows the explored log $r$ -k space and in dark grey the $r$ -k pairs which were found by the model to be compatible with the catches and the prior information. The dotted rectangle indicates the range of the priors provided in the ID file. The point in the center of the blue cross is the most likely $r$ -k pair predicted by CMSY and horizontal and vertical error bars approximate 95% confidence limits for $r$ and $k$, respectively, which are again closer view in Panel C. Following BSM analysis, the red cross in panel B indicates the best $r$ -k estimate of BSM. In panel C, the black dots are the viable $r$ -k pairs found by BSM, with an indication of a red cross for the best estimate with 95% confidence limits.
3. The blue curve in D shows the median of the biomass trajectories estimated by CMSY. The median of the biomass trajectories generally behaves as the estimated catch data in A. The dotted lines indicate the 2.5th and 97.5th percentiles. Vertical blue lines indicate the prior biomass ranges. The red curves in panel D show the BSM predictions for relative biomass, the dots indicate the CPUE data scaled by BSM and corrected for effort creep, and the green line indicates the uncorrected CPUE.
The biomass trajectories estimated by both models CMSY and BSM fluctuate under 0.5 level of relative biomass. The estimated medians started around 0.5 level of relative biomass and decreased fast to reach about 0.2 in 1990 and then increased to 0.5 level for CMSY estimates, and 0.4 level for BSM estimates. Finally, estimates of both models dropped to near 0.2 level in 2015 and approximately flattened to the end of the studied period.
4. Panel E shows the medians of the exploitation $(F / F_{MSY})$ as a blue curve, with the dotted curves indicating 2.5th and 97.5th percentiles. The steep increase in the upper confidence limit in the last year results from catch relative to the lower confidence limit of biomass in panel D. The optimum fishing mortality is the fishing mortality yields the Maximum Sustainable Yield of the fishery, thus $(F = F_{MSY}$, i.e., $F / F_{MSY} = 1$ ). The red curves in panel E show the BSM predictions for exploitation, with the dots showing catch per unit of effort CPUE, as scaled by BSM. The BSM predictions for exploitation (red curves) are nearer to the unity than the CMSY predictions (blue curves). Moreover, the medians reached near unity during the periods of 1995 to 2004 and 2014 to 2021.
5. Panel F shows the Schaefer equilibrium curve of catch/MSY relative to $B / k$, indented, pointed by the reddish arrow, at $B / k < 0.25$ to account for reduced recruitment at low stock sizes. The blue curve shows the predictions by CMSY, from the first year (square) to the last year (triangle). The red curve shows the BSM predictions for exploitation and relative stock size. The dots are showing the predicted catch per predicted biomass as scaled by BSM. Both predictions of CMSY and BSM models go in the same way parallel and near each other.
A:s-undo
B:Finding viable r-k
C: Analysis of viable r-k
D:Stock size
E: Exploitation rate
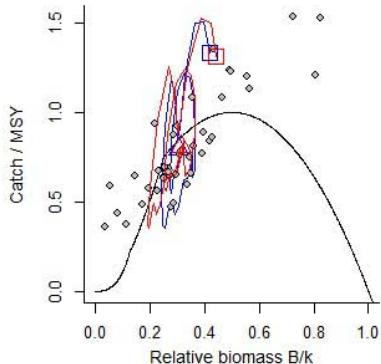
F: Equilibrium curve Figure 2: The CMSY and BSM assessment graphs for S. unodsquamis in the Gulf of Suez, Red Sea
### c) Stock Status of S. unodsquamis Fishery
Table 3: Results from Bayesian Schaefer model (BSM) using catch & CPUE
<table><tr><td>q = 0.728,</td><td>lcl = 0.434, ucl = 1.12 (derived from catch and CPUE)</td></tr><tr><td>r = 0.304,</td><td>95% CL = 0.185 - 0.468,</td></tr><tr><td>k = 18.2 (*1000t),</td><td>95% CL = 11.9 - 30.7,</td></tr><tr><td>r-k log correlation = -0.919</td><td></td></tr><tr><td>MSY = 1.4 (*1000t),</td><td>95% CL = 1.17 - 1.73</td></tr><tr><td>B (2021) = 0.315 k,</td><td>2.5th perc. = 0.21, 97.5th perc. = 0.427</td></tr><tr><td>Exploitation F/(r/2) (2021) = 1.29,</td><td>2.5th perc. = 0.779, 97.5th perc. = 2.44</td></tr></table>
Figure (3) shows that; the upper left panel shows the catch relative to MSY, with an indication of $95\%$ confidence limits in grey. Catch of the first 3 years exceeded the upper limit of the confidence interval of MSY, while in the next 5 years catch fluctuated around MSY. Then the catch dropped lower than the lower limit of the confidence interval of MSY. Catch increased again over the upper limit of the confidence interval of MSY during 2008-2011 and dropped once again under the lower limit of the confidence interval, and continued to the end of the time series. Most of the values of the catch of the studied period fell below the maximum sustainable yield MSY.
The upper right panel shows the development of predicted relative total biomass $(B / B_{MSY})$, with the grey area indicating uncertainty. The relative biomass of S. unodsquamis fluctuated between 1 and 0.5 in the time series except around the nineties it dropped under 0.5.
The lower left graph shows fishing pressure $(F / F_{MSY})$. Fishing pressure generally fluctuated over unity. The value of fishing pressure exceeded 2.25 in 1987 and
1988 and went just under unity during 2004 and 2005 and increased again over unity and fluctuated to the end of the time series.
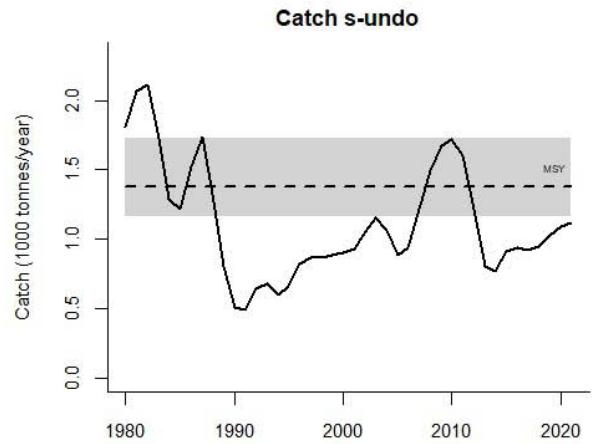
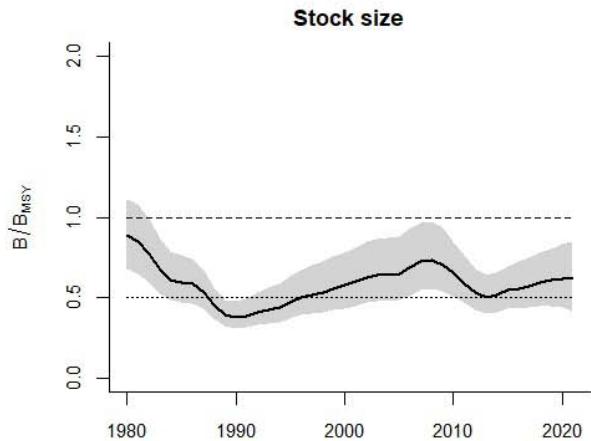
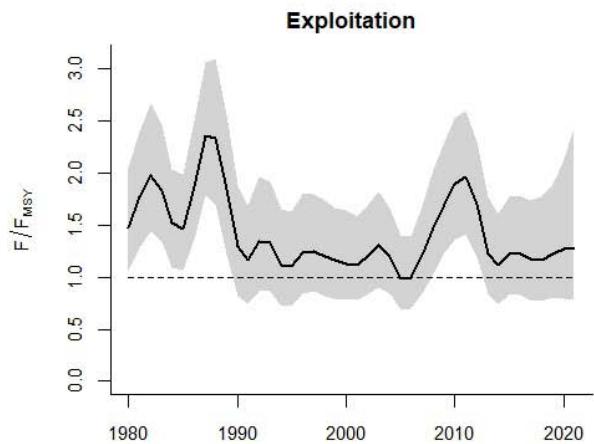
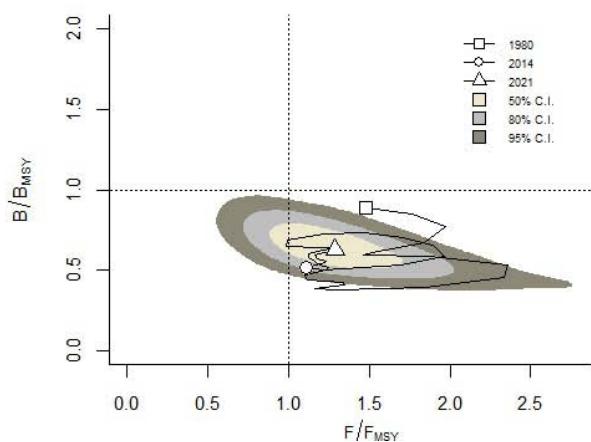 Figure 3: The stock status of S. unodsquamis in Suez Bay, Gulf of Suez
The lower-right panel shows the trajectory of relative stock size $(B / B_{MSY})$ as a function of fishing pressure $(F / F_{MSY})$. The "banana" shape around the assessment of the final year triangle indicates uncertainty with yellow for $50\%$, grey for $80\%$, and dark grey for $95\%$ confidence levels. Most of the studied series, as most of the banana shape, fell in the fourth quarter of the graph which is of high fishing pressure and low relative biomass.
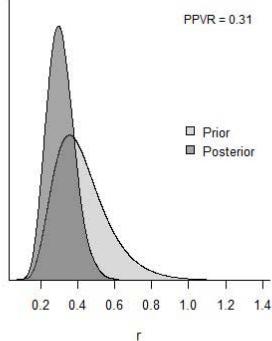
### d) Prior and Posterior Distributions of Densities of BRPs for S. undosquamis
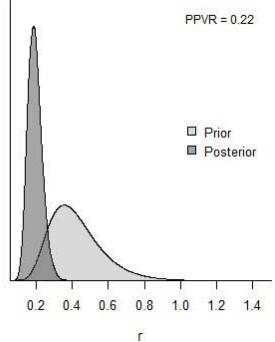
CMSY prior & posterior distributions for s-undo
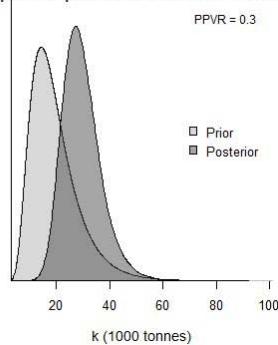
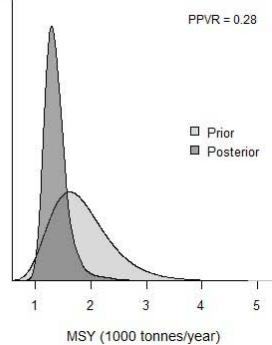
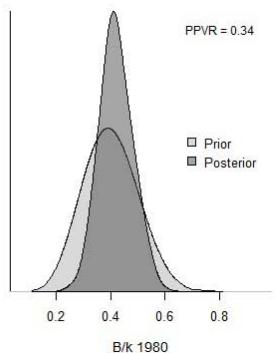
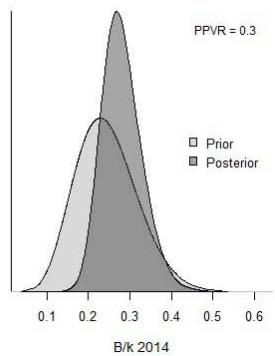
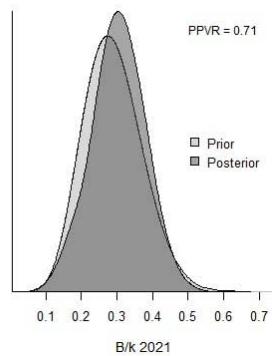 Figure 4: CMSY distributions of prior and posterior densities (same area under curves) for resilience or productivity (r), unexploited stock size (k), maximum sustainable yield (MSY), and relative stock size
$(\mathsf{B} / \mathsf{k})$ at the beginning, the end, and an intermediate year of the available time series (1980-2021) of catch data, for S. undosquamis from Gulf of Suez, Red Sea
BSM prior & posterior distributions for s-undo
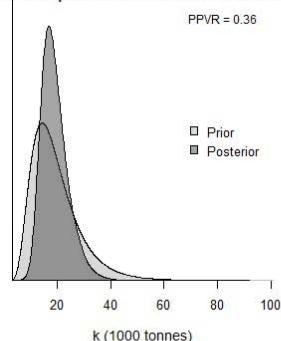
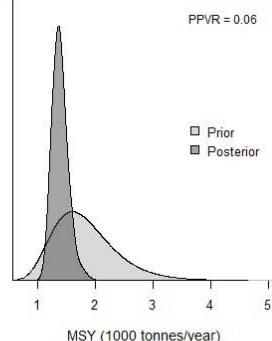
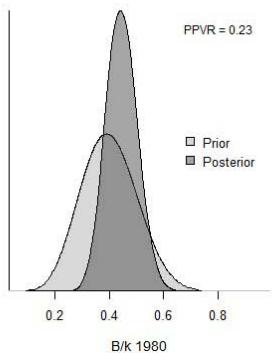
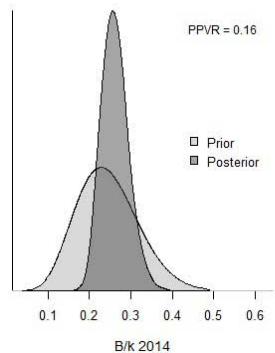
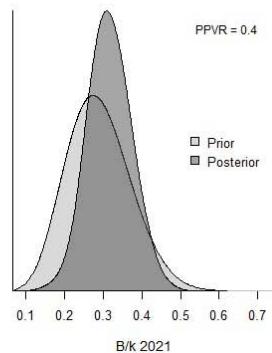 Figure 5: BSM distributions of prior and posterior densities (same area under curves) for resilience or productivity (r), unexploited stock size (k), maximum sustainable yield (MSY), and relative stock size
$(\mathsf{B} / \mathsf{k})$ at the beginning, the end, and an intermediate year of the available time series (1980-2021) of catch data, for S. undosquamis from Gulf of Suez, Red Sea In the logistic model of population growth, $r$ and $k$ are inversely correlated with $k = 4$ MSY/r and a slope of -1 in log-space. A random distribution of r-k pairs generated from that consideration is shown with blue dots in Figure (6). A random distribution of r-k pairs taking into account the empirical slope of -0.919 generated dots shown in purple. Orange dots show a distribution of r-k points derived from JAGS modeling based on the priors for $r$ and $k$. The green dots show the posterior distribution of r-k points using the Bayesian modeling for S. undosquamis from the Gulf of Suez, Red Sea.
The dotted rectangle indicates the range of the priors provided in the ID file. The rectangle includes most of the randomly distributed Logistic r-k, Empirical r-k, JAGS r-k, and about the lower second half of the Posterior r-k.
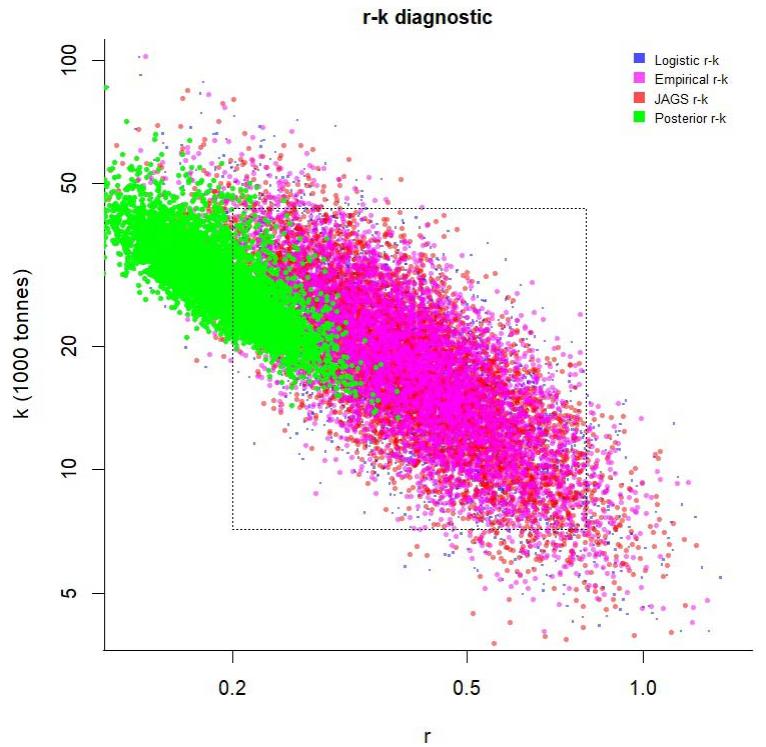 Figure 6: Diagnostic plot of different methods to generate prior distributions for r and k that take into account their negative correlation
### e) Management of S. unodsquamis Fishery
Using model BSM analysis, the values of the estimated catch time series are nearly the same as the observed ones (Fig., 7). Regarding the catch per unit effort, 18 values of CPUE are out of the confidence interval of the fitted line. The process variation clarifies the proximity of the estimated and observed values of biomass along the time series. In addition, the figure does not show considerable autocorrelation of residuals.
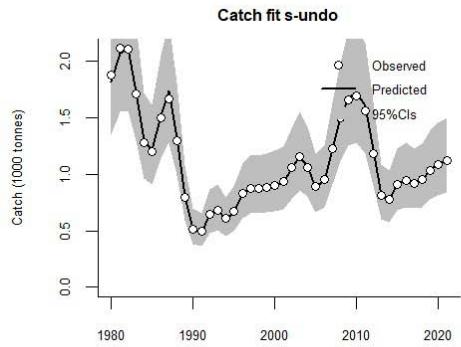
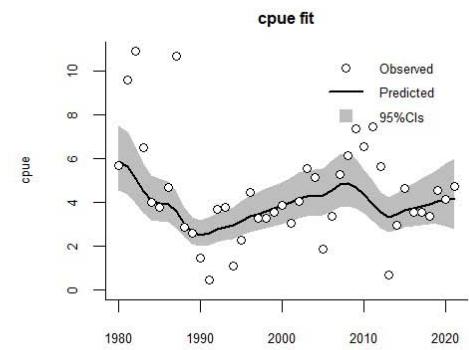
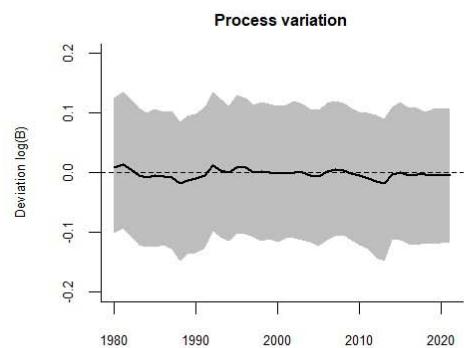
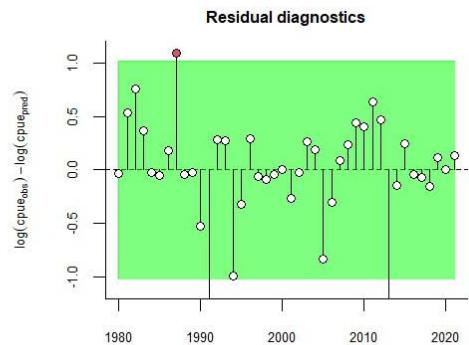
Figure 7: Analytical graph for BSM analysis of S. unodsquamis, showing the fit of the predicted to the observed catch, the fit of predicted to observed CPUE, the deviation from observed to predicted biomass, and an analysis of the log-CPUE residuals, with a green background where autocorrelation of residuals is deemed negligible As long as B is greater than half of $B_{MSY}$ then $F_{MSY}$ equals half (r) as shown in the first line of the table
(4). In addition, due to the value of the ratio, $\mathrm{B} / \mathrm{B}_{\mathrm{MSY}}$ being $> 0.5$, r and $\mathrm{F}_{\mathrm{MSY}}$ are not linearly reduced.
Table 4: Management information of S. unodsquamis in the Gulf of Suez based on BSM
<table><tr><td>Parameter</td><td>P. Value</td><td>95% Confidence Intervals (CI) / Percentile</td></tr><tr><td>FMSY</td><td>0.152,</td><td>0.093 - 0.234(1)</td></tr><tr><td>FMSY</td><td>0.152,</td><td>0.093 - 0.234(2)</td></tr><tr><td>MSY</td><td>1.4 (*1000t),</td><td>1.17 - 1.73</td></tr><tr><td>BMSY</td><td>9.1 (*1000t),</td><td>5.96 - 15.4</td></tr><tr><td>B (2021)</td><td>5.7 (*1000t),</td><td>2.5th perc = 3.35, 97.5 perc = 10.2</td></tr><tr><td>B/BMSY (2021)</td><td>0.629,</td><td>2.5th perc = 0.419, 97.5 perc = 0.853</td></tr><tr><td>F (2021)</td><td>0.194,</td><td>2.5th perc = 0.104, 97.5 perc = 0.361</td></tr><tr><td>Exploitation F/FMSY</td><td>1.29,</td><td>2.5th perc = 0.779, 97.5 perc = 2.44</td></tr><tr><td colspan="3">(1) (if B > 1/2 BMSY then FMSY = 0.5 r)</td></tr><tr><td colspan="3">(2) (r and FMSY are linearly reduced if B < 1/2 BMSY)</td></tr><tr><td colspan="3">(P. = Parameter),
[MSY, BMSY, and B(2021)]*1000t</td></tr></table>
Kobe phase plot (Fig. 7) was used to depict the current stock status and exploitation rate relative to target reference points (TRPs) such as $F_{MSY}$. The Kobe plot is characterized by four colored quadrants (orange, red, yellow, and green) for $F / F_{MSY}$ on $B / B_{MSY}$. The orange plot denotes the healthy stock that will be depleted by overfishing. The red color plot indicates the overfished and overfishing status in which the biomass cannot produce the MSY. The yellow color plot indicates very low biomass, but the stock has a chance to recover in a sustainable state if fishing pressure is reduced. The green plot is the management targeted area, signifying healthy stock status and sustainable fishing to produce the MSY. The legend in the plot's upper right corner indicates the probability of the stock falling into one of the colored areas over the last year. The probability of the stock falling into the red area is $83.9\%$ and $16.1\%$ is the probability of the stock falling into the yellow area. The probability of the stock subsiding into the green area and falling into the orange area is $0.0\%$. All yearly cases of stock of S. undosquamis in the Gulf of Suez had fallen in the red quadrant. Except two cases of the stock of S. undosquamis had fallen on the border between red and yellow quadrates.
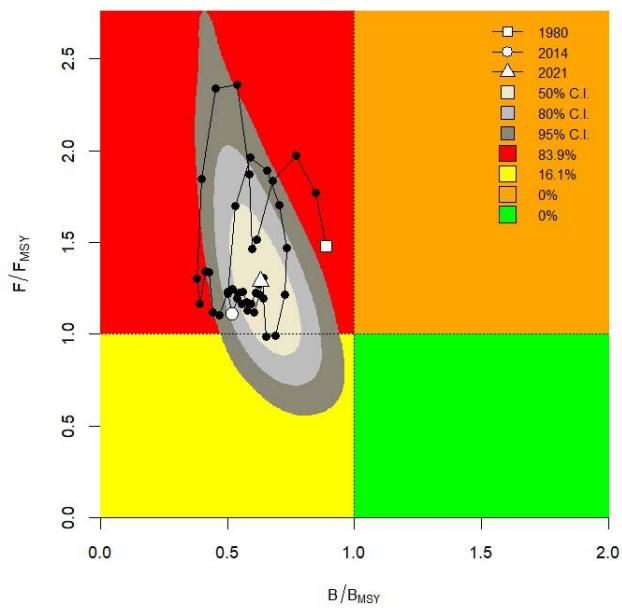 Figure 7: Kobe plot illustrating the concurrent movement of exploitation
$(\mathsf{F} / \mathsf{F}_{\mathsf{MSY}})$ and the relative biomass $(\mathsf{B} / \mathsf{B}_{\mathsf{MSY}})$ of S. undosquamis in the Gulf of Suez
## IV. DISCUSSION
Many fishery researchers dealt scientifically with the fish species Saurida unodsquamis, using the classical methods to estimate the species' biological reference parameters as; the growth coefficient (k), the theoretical maximum length $(\mathsf{L}_{\infty})$, and the theoretical parameter $\left(t_{0}\right)$ pertained to the growth model of von Bertalanffy. For instance, in the territorial waters of Egypt in the Red Sea some researchers investigated S. unodsquamis. Through FAO project, Sanders and Kedidi (1984) studied the population of S. unodsquamis in the Gulf of Suez using reasonable monthly sampling for landings from the commercial boats, not scientific marine surveys. They used Thompson and Bell model (1934), and stated a maximum sustainable yield (MSY) of 2500 tons and recommended a decrease in the fishing effort by $10\%$. In addition, Sanders and Morgan (1989) republished the above results. The Association of the Industrial Fishing Boat Owners has indirect authority to accept or refuse any recommendation in the fisheries committees, so they refused to apply FAO recommendations and others. They manage the fisheries unscientifically following the fishermen opinions.
El-Ganainy (2003) used Pella and Tomlinson time-series model (1969), reported MSY of 1331 tons; and recommended a decrease in the fishing effort by $33.3\%$. Moreover, she used the Fox model (1975) and estimated MSY as 1007 tons and a decrease in the fishing effort by $35.5\%$. Sampling methods and used models, particularly constant parameter models might cause the discrepancy in the resulted values. Shenouda (1969), El-Ganainy (1992), Ramadan (1995), Amin et al. (2007), and El-Etreby et. al., (2013) studied some other biological parameters for S. unodsquamis in the Gulf of Suez.
Actually, these parameters are of individual growth not of population growth. Population growth follows two processes; one for the individual and another for the population. Therefore, in the $\mathrm{CMSY}++$ method; the parameter of the intrinsic increase rate of a population (r) is an important indication to understand a fishery (Anderson et al., 2008; Cheung et al., 2010). Such parameter (r) includes the changes in the size of the individual along its age besides the changes in the number of recruitments in different years. The same corresponds to the different biological reference parameters of the $\mathrm{CMSY}++$ method. Therefore, this method is mostly objective and the statistical procedure of estimating r-k may give it priority over other statistical methods, that used the size frequency of the fish species.
The statistical methods used for fish size frequency are common in tropical and subtropical regions whereas in temperate zones fishery scientists use hard structures as otoliths to age fish, which are more reliable and avoid the possible terrible uncertainty of the statistical methods. Aging fish using the hard structures gives more accurate results than using the size frequency but in the case of subtropical and tropical cases, the annulus is mostly unclear, and the hard structures, e.g. otolith, may contain chaotic lines and/or ruptures.
The catchability coefficient $q$ (0.73) is relatively high (Table, 3). The catchability coefficient is identified as the proportion of the stock taken by one unit of fishing effort (Hoggarth et al., 2006). So, the proportion of the stock taken (q) is determined mainly by the unit of effort used. The intrinsic increase rate of a population (r) is an important indication to understand a fishery (Anderson et al., 2008; Cheung et al., 2010). The estimated (r) is $0.30 \, \text{year}^{-1}$, revealing a medium increase rate of S. unodsquamis that is able to add above $30\%$ biomass to the standing population per year. When r is 0.1, it is mentioned that population size can increase by $10\%$ in a time interval (Hoggarth et al., 2006). The (r) value strongly correlates with fisheries resilience related to natural mortality (Froese & Pauly, 1980; Froese et al., 2017). The fisheries resilience value ranges are: 0.015–0.1, categorized as low resilience, 0.2–0.8 as medium resilience, and 0.6–1.5 as high-resilience fishery (Froese et al., 2017). This study found the population of S. unodsquamis as a "medium-resilience" fishery in the Gulf of Suez, Red Sea.
The value of the intrinsic rate of population growth (r), resulting from CMSY and BSM analyses may not be significantly different where the value of (r) from
CMSY analysis (0.214) lies in the $95\%$ confidence range of (r) from BSM analysis (0.185 - 0.468). Results from CMSY and from BSM models are nearly the same.
The catch mostly dropped under the level of the MSY. Except for 7 years in the first of eight teens and 5 years around 2010, the rest of the studied period catch went down MSY and sometimes deeply alerting biomass overfishing. Moreover, the population might suffer from recruitment overfishing (Fig., 2F), which hinders the fishery for a long time to recuperate.
A common misconception of Bayesian analyses is that the priors determine the results. It is true that if grossly wrong priors are provided as input to CMSY, the results will be wrong. But that is true for any model provided with wrong data. If instead reasonable priors are provided, as Figures 4 & 5 show, the priors (light grey) inform the results, with posterior understanding (dark grey) of the stock clearly improved compared to prior perceptions (Froese, et al., 2019). The lower the prior-posterior variance ratio (PPVR), the more the posterior knowledge is improved relative to prior knowledge. Both CMSY and BSM produced the same areas under curves in the graph of distributions of prior and posterior densities. Maximum sustainable yield MSY is $1.4^{*}1000t$ per year, which is higher than last year's catch $(1.2^{*}1000t$ per year in 2021), indicating the poverty of fish biomass to yield that value of MSY. Therefore, the catch should be increased by more than $14\%$ to attain the maximum sustainable yield MSY. Moreover, the fishery of S. unodsquamis in the Gulf of Suez was suffering from overfishing through the time 2012 to 2021.
CMSY++ method assesses whether $F / F_{MSY}$ values and $B / B_{MSY}$ values, both are approaching 1, to ensure safe fishing conditions and healthy stock in which biomass levels are enough to harvest the MSY and accordingly the biomass levels are enough for a sustainable state of S. unodsquamis in the Gulf of Suez. Biomass-producing MSY is $9.1*1000t$ while Biomass of 2021 is $5.7*1000t$, therefore Biomass needs to be rebuilt by about $3.3*1000t$. Relative Biomass $(B / B_{MSY})$ fluctuated under the level of unity along the studied time period and even under 0.5 around the nineteen and raised to 0.5 some years after 2010. Consequently, the Biomass of the population of Saurida undosquamis in the Gulf of Suez is suffering from overfishing.
Froese, et al., (2021) analyzed observed r-k correlations of 240 stocks and got an empirical slope of -0.76. Analyzing the observed r-k correlation of the stock of S. undosquamis from the Gulf of Suez, Red Sea gave a slope of -0.919.
Most of the studied series, as most of the banana shape (Fig., 7), fell in the first quarter of the graph, which is of high fishing pressure and low relative biomass. Consequently, we might conclude that the stock of S. undosquamis in the Gulf of Suez has been suffering from overfishing for a long time. The representation of the Kobe phase plot and table (6) suggest that the current level of fishing pressure should be reduced by about $30\%$ to ensure sustainability for the population of S. unodsquamis in the Gulf of Suez. Moreover, by decreasing the fishing pressure the ratio of $\mathsf{B} / \mathsf{B}_{\mathsf{MSY}}$ could be increased by about $37\%$ to attain a healthy state.
### a) Management of S. undosquamis Fishery in the Gulf of Suez
1. The fishery suffers from recruitment overfishing as shown in Figure (2, F), and the accompanied photo (Fig., 8), taken on 11 September 2019, for juveniles of S. undosquamis from the Gulf of Suez.
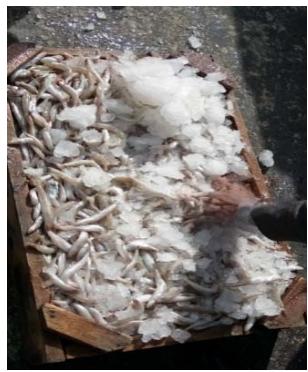 Figure 8: Photo of premature juveniles of S. uodosquamis north Gulf of Suez, 11 Sep. 2019
2. The fishery of S. undosquamis in the Gulf of Suez has suffered from biomass overfishing and overexploitation since the early 1980s of the last century (Fig., 2D; Fig., 3; Table 2; Table, 3; Fig., 3; Table, 4; & Fig., 7).
3. Additionally, Yousif (2003) reported significant numbers of small fishes (9cm-17cm), shown in the accompanied (Fig., 9) of the area of the northern Gulf of Suez (El-Sukhnna Bay) and the length frequency of S. undosquamis. The area extends in the northern Gulf, from Latitudes $29^{\circ}50'$ (Ras Misalla) in the eastern Gulf - $29^{\circ}49.5'$ (Ras Adabiya) in the western Gulf to Latitudes $29^{\circ}27'$ (Ras Matarma) - $29^{\circ}23'$ (Ras Abu Daraq) southward, from Autumn 1998 commercial bottom trawl survey for the Gulf of Suez.
4. The size at which $50\%$ of fishes are mature was 15.0 cm for males and 15.5 cm. for females, which indicates that all individuals over one year of age were sexually mature. Furthermore, the maximum average values of GSI were recorded for both males and females, showing intensive spawning in Spring (El-Etreby et. al., 2013).
El-Ganainy (1992 & 2003) stated that the stock of lizard fishes in the Gulf of Suez has experienced heavy exploitation.
5. Yousif (2003) reported a fishing depth of $20\mathrm{m}$ for lizard fish to ensure fish sizes bigger than $16\mathrm{cm}$ and one spawning time to avoid recruitment overfishing.
6. The population of S. unodsquamis in the Gulf of Suez is able to add above $30\%$ biomass to the standing population per year, at healthy stock status.
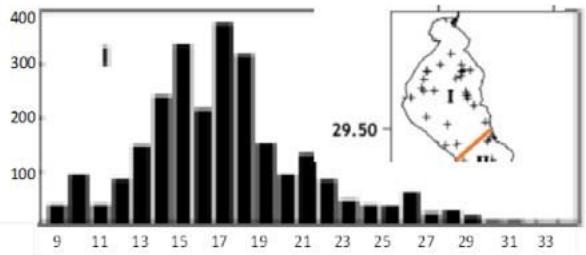 Figure 9: Length (cm) frequency distribution of S. undosquamis in the first area (I) of the Gulf of Suez during the trawl survey of Autumn 1998, Yousif (2003)
As a consequence, if we scientifically and carefully select two months to stop fishing we might recover the health of the stock status in three years.
Therefore, I strongly recommend stopping the fishing activities in the month of September to avoid recruitment and biomass overfishing; and starting the fishing season in October. In addition, I indeed recommend seizing the fishing season during April.
Generating HTML Viewer...
References
22 Cites in Article
Ahmed Fathy*,M Hassanean,Nadia Ali (2019). NGL Recovery Enhancement for GUPCO Trans Gulf Gas Plant by using New Applicable Technique.
Amal Amin,Magdy El-Halfawy,Amal Ramadan (2007). Management and Reproduction of the Male Brushtooth Lizardfish Saurida undosquamis (Richardson) front Gulf of Suez, Egypt.
Christian Anderson,Chih-Hao Hsieh,Stuart Sandin,Roger Hewitt,Anne Hollowed,John Beddington,Robert May,George Sugihara (2008). Why fishing magnifies fluctuations in fish abundance.
W Cheung,V Lam,J Sarmiento,K Kearney,R Watson,D Zeller,D Pauly (2010). Large-scale redistribution of maximum fisheries catch potential in the global ocean under climate change.
A El-Ganainy (1992). Biological Studies on Lizard Fishes, Suarida undosquamis (Pisces: Synodontidae) from the Gulf of Suez.
A El-Ganainy (2003). Assessment of the Lizard Fish Saurida undosouamis (Richardson) Fishery in the Gulf of Suez, Red Sea.
W Fox (1975). Fitting the generalized stock production model by least-squares and equilibrium approximation.
R Froese,D Pauly (1980). Concepts, design and data sources. Fish Base.
Rainer Froese,Nazli Demirel,Gianpaolo Coro,Kristin Kleisner,Henning Winker (2017). Estimating fisheries reference points from catch and resilience.
Rainer Froese,Henning Winker,Gianpaolo Coro,Maria-Lourdes "deng" Palomares,Athanassios Tsikliras,Donna Dimarchopoulou,Konstantinos Touloumis,Nazli Demirel,Gabriel Vianna,Giuseppe Scarcella,Rebecca Schijns,Cui Liang,Daniel Pauly (2019). Figure 3 from: Froese R, Winker H, Coro G, Palomares M-L, Tsikliras AC, Dimarchopoulou D, Touloumis K, Demirel N, Vianna GMS, Scarcella G, Schijns R, Liang C, Pauly D (2023) New developments in the analysis of catch time series as the basis for fish stock assessments: The CMSY++ method. Acta Ichthyologica et Piscatoria 53: 173-189. https://doi.org/10.3897/aiep.53.105910.
Rainer Froese,Henning Winker,Gianpaolo Coro,Maria-Lourdes "deng" Palomares,Athanassios Tsikliras,Donna Dimarchopoulou,Konstantinos Touloumis,Nazli Demirel,Gabriel Vianna,Giuseppe Scarcella,Rebecca Schijns,Cui Liang,Daniel Pauly (2021). Figure 7 from: Froese R, Winker H, Coro G, Palomares M-L, Tsikliras AC, Dimarchopoulou D, Touloumis K, Demirel N, Vianna GMS, Scarcella G, Schijns R, Liang C, Pauly D (2023) New developments in the analysis of catch time series as the basis for fish stock assessments: The CMSY++ method. Acta Ichthyologica et Piscatoria 53: 173-189. https://doi.org/10.3897/aiep.53.105910.
Gafrd (2022). General Authority for Fish Resources Development.
D Hoggarth,S Abeyasekera,R Arthur,J Beddington,R Burn,A Halls,G Kirkwood,M Mcallister,P Medley,C Mees (2006). Stock Assessment for Fishery Management.
Daniel Kimura,Jack Tagart (1982). Stock Reduction Analysis, Another Solution to the Catch Equations.
Daniel Kimura,James Balsiger,Daniel Ito (1984). Generalized Stock Reduction Analysis.
Steven Martell,Rainer Froese (2013). A simple method for estimating <scp>MSY</scp> from catch and resilience.
M Nafea,A Amin,A Yousif (2022). Stock Status and Management of the Rabbitfish Siganus rivulatus in the Suez Bay, Gulf of Suez, Egypt.
M Palomares,R Froese,B Derrick,S.-L Nöel,G Tsui,J Woroniak,D Pauly (2018). A Preliminary Global Assessment of the Status of Exploited Marine Fish and Invertebrate Populations.
A Ramadan (1995). Reproduction Studies on Lizard Fish, Suarida undosquamis in Gulf of Suez.
G Salah,El-Etreby,A Azza,Mahmoud El-Ganainy,Saber,A Magdy,El-Alwany,A Al-Azab,Elbokhty (2013). Age, growth and reproduction of the lizard fish Saurida undosquamis from the Gulf of Suez, Red Sea, Egypt. Egypt.
M Sanders,S Kedidi (1984). Stock assessment of Suarida undosquamis from the Gulf of Suez. UNDP.
M Sanders,G Morgan (1989). Review of the fisheries resources of the Red Sea and Gulf of Aden.
No ethics committee approval was required for this article type.
Data Availability
Not applicable for this article.
How to Cite This Article
Aly Yousif. 2026. \u201cA Monte Carlo-based Evaluation of Fishery Management Strategies for Lizardfish (Saurida undosquamis) in the Gulf of Suez, Red Sea\u201d. Global Journal of Science Frontier Research - C: Biological Science GJSFR-C Volume 23 (GJSFR Volume 23 Issue C1): .
Explore published articles in an immersive Augmented Reality environment. Our platform converts research papers into interactive 3D books, allowing readers to view and interact with content using AR and VR compatible devices.
Your published article is automatically converted into a realistic 3D book. Flip through pages and read research papers in a more engaging and interactive format.
Our website is actively being updated, and changes may occur frequently. Please clear your browser cache if needed. For feedback or error reporting, please email [email protected]
Thank you for connecting with us. We will respond to you shortly.