In automotive body manufacturing, the dies used for blanking, trimming, and piercing are subject to harsh and demanding conditions, including high-impact loading and a large number of cycles. As the strength of sheet metal continues to increase, the service life of trim dies has become a major concern for the industry. To address this issue, this study conducted a comprehensive comparison of the fatigue lifetime of trim dies produced using different manufacturing processes, which involved two distinct materials (wrought vs. cast), two different die heat treatment methods (induction-hardened vs. through-hardened), and analysis of the effect of edge weld repair on fatigue lifetime. An accelerated trimming simulator test is developed to cyclically load and assess the cumulative damage evolution of the cutting edge of a die specimen at a set number of cycles. The evolution of edge damage areas and volumes were used to compare and rank the fatigue performance of each studied condition. A new statistical model is developed to systematically analyze the effects of different routes on fatigue damage over time considering process uncertainty. Microstructures and hardness were analyzed to provide metallurgical explanations of the test results. Suggestions to improve trim die performance and areas for further study are provided.
## I. INTRODUCTION
In recent decades advanced high-strength steels (AHSS) have been rapidly developed and widely applied in automotive industry to reduce vehicle weight, improve sustainability, and increase fuel efficiency and safety at an affordable cost. However, as the strength of AHSS continues to increase, the service life of existing dies, especially trim dies, is rapidly declining. This is due to the high impact stresses at the trim die cutting edges and the absence of adequate backing material to support the cutting edge.
The performance of trim dies, especially their fatigue life, directly impacts tooling cost and the occurrence of edge cracking in stamped parts. The theoretical study and experimental foundation on fatigue damage of materials were established over a century ago, with the discovery of fatigue failure in railway car axles reported as early as the 19th century [1]. Wöhler [2-4] initiated the early concepts of allowable load, metallurgical size effect, crack propagation, and finite life design based on both static strength and allowable stress amplitude, i.e., the two corresponding safety factors for static and cyclic. The S-N curve was also called "Wöhler curve" after 1936. Eshelby [5](in 1898) firstly utilized the stress concentration factor of 3.0 for a cylindrical hole in an infinite plate for an explanation of failure at low applied stress. For the reverse loading effect, Bauschinger [6-8] reported that the material elastic limit would be changed after repeated stress cycles". Basquin [9] stated that the fatigue life has a power-law dependence on the external load amplitude. Soderberg [10], Goodman [11], and Gerber [12] modeled the effect of cyclic stress amplitude on fatigue life with different treatments. Haigh [13-15] studied the stress ratio effect on fatigue life. From a long history of fatigue study on the mechanics and physical damage mechanisms, it is generally agreed that the fatigue failure experiences crack initiation and propagation stages until a critical crack length is reached. Coffin [16] and Manson [17] developed the strain-based low cycle fatigue (LCF) model by correlating strain amplitude to crack initiation. Based on linear elastic fracture mechanics initiated by Griffith [18, 19], the mechanics of fatigue crack growth was established and later extended to ductile materials with crack-tip plastic zone. Paris and Erdogan found that the crack propagate rate, da/dN, is driven by $\Delta K$ (where $K$ is the stress intensity factor) in a power-law relation, leading to Paris Law and the S-N curve for fatigue life prediction. A mass of comprehensive review articles and books are available, with representative ones by Schutz [20] and Suresh [21]. Figure 1 summarizes the fatigue damage mechanisms and three regimes. A variety of fatigue testing methods have been developed, with some becoming material testing standards."
Design of Experiments (DOE) is a powerful statistical method that optimizes a system or process by identifying key variables and their interactions [22, 23]. Sir Ronald A. Fisher first developed DOE methods in 1920 for agricultural research [24]. Later, factorial design [25] and fractional factorial designs [26] were developed, which require only a fraction of the runs of a full combination of variables. Classic designs used to detect interactions and quadratic effects include the Central Composite Design (CCD) and Box-Behnken Design (BBD) [23]. Taguchi [27, 28] developed robust parameter design methods that emphasize robustness and quality in the design process. Box and Wilson further developed Response Surface Methodology (RSM) [29], which models and optimizes response variables over a range of input variables. Space-filling designs are another relevant family of DOE designs. The space-filling designs select a set of experimental conditions that cover the entire range of input variables or factors while minimizing the number of experiments required. Examples of space-filling designs include Latin Hypercube Sampling, Orthogonal Arrays, and Sobol Sequences [30].
The DOE method have made significant progress and has been widely used in many fields, including engineering, manufacturing, healthcare, and agriculture [31]. However, most of the existing research on DOE focuses on a scalar performance variable or a vector of performance variables. Little research studied the DOE method when the performance is high dimensional data such as time series, or images.
This research investigates the impact of trim die repair/reconditioning processes on trim die performance in automotive body manufacturing. In the automotive sheet metal stamping process, trim dies may become damaged due to wear or edge chipping during production. To remedy this, trim dies can either be repaired/reconditioned on-site through welding, grinding, and induction hardening in the tool maintenance division, or repaired/reproduced off-line using different manufacturing methods such as machining, welding, and furnace through-hardening in a more controlled environment.
The objective of this study is to compare these competing manufacturing routes and their effect on trim die performance through simulated and accelerated fatigue testing and microstructure analysis. Because the trim die performance degradation over time can be treated as a time series process over time, the traditional DOE method cannot be directly applied. To overcome this difficulty, we developed a new DOE method when the output performance is a time series. The results and insights gained from this study will provide valuable guidance for future process selection and performance improvement.
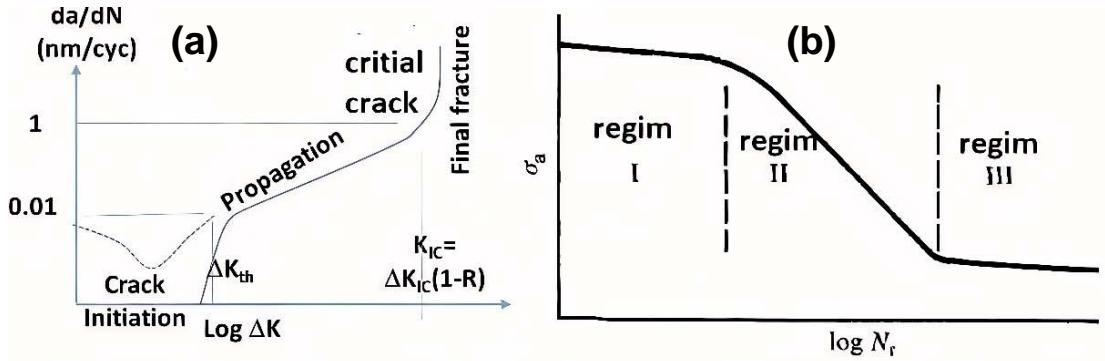 Figure 1: (a) Mechanisms of crack initiation and propagation fatigue failure development; (b) S-N curve showing three regimes of fatigue damage (regenerated schematically based on [21])
## II. EXPERIMENTAL METHODS
### a) Test Material and Matrix
There exist various tool steels, and one such steel utilized in this study is $\mathrm{Caldie}^{\mathrm{TM}}$, a trademarked grade of Uddeholm [32]. $\mathrm{Caldie}^{\mathrm{TM}}$ is a chromium-molybdenum-vanadium alloyed tool steel developed by Uddeholms AB for use in tools operating under high compressive pressure, where Rockwell hardness 58-62 HRC is required, and where chipping and/or cracking are the predominant failure mechanisms. Its chemical composition, given by [33], is (in wt%): C 0.7, Si 0.2, Mn 0.5, Cr 5.0, Mo 2.3, and V 0.5.
This study compares three pairs of competing manufacturing methods: raw material process (cast versus wrought), heat treating method (induction heating versus furnace through heating), and repair status (edge welded with CaldieTM filler wires versus base metal-not welded). Each route undergoes two repeated tests, resulting in a total of 16 fatigue tests for eight manufacturing routes. The routes are labeled with abbreviations using the abrasives used in testing, such as "C-TH-w," which stands for the Cast-Through Heating-welded route. To distinguish between repeated tests, a tail "-t1", "-t2", etc., is added, such as "W-IH-b-t2," which represents the Wrought-Induction Heating-bulk-test #2 route. The provider did not perform any heat treatment after a stand TIG welding process using CaldieTM wire. For all IH coupons, the original CaldieTM blocks' hardness is improved from 20HRc to 36-42HRc through a pre-hardening process using the TH method.
### b) Simulated Trim Die Edge Fatigue Set-up
We designed and fabricated a trimming simulator, as shown in Figure 2, to assess the die life and relative damage evolution of a trim die specimen. The cube-shaped specimen measures $3/4$ on each side, with two cutting edges subjected to a concentrated sinewave load through a WC pin. The applied force is equally carried by two specimens using a self-alignment block, allowing the loading train to pass through the edge center. The higher force applied accelerates the edge damage, enabling a quick assessment and comparison of the relative die damage evolution and die life, compared to that observed in real sheet metal trimming processes. The similarity and difference of the loading conditions between this test and real sheet metal trimming process are explained in detail in another paper published by the present author [34].
Fatigue loading was operated under a constant cyclic compressive force for remaining WC pin in contact with the die edge. The waveform is given as
$$
F(t) = \frac{(F_{\text{max}} + F_{\text{min}})}{2} \sin(2\pi f t) = \frac{F_{\text{max}}}{2} (1 - R) \sin(2\pi f t) \tag{1}
$$
where $R = F_{min} / F_{max}$, $F_{max} = 60kN$, and $R = F_{min} / F_{max} = 0.1$, and $f = 10Hz$ for all the tests. The load wavefunction was provided by a standard material tester (Instron model 8801) with a servo-hydraulic actuator and digital controller.
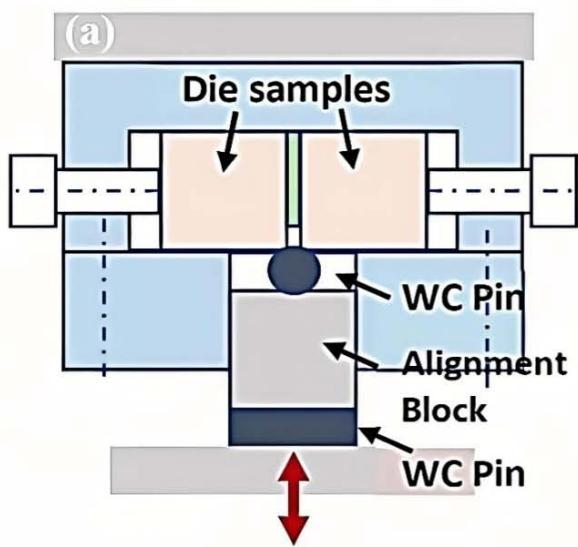
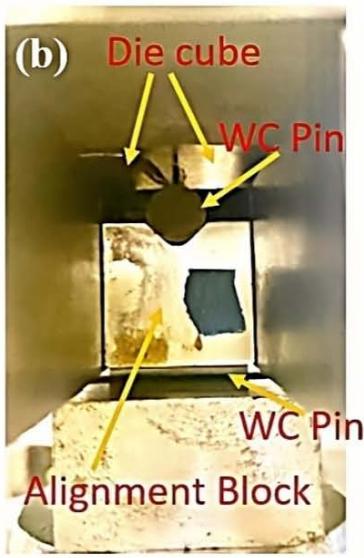
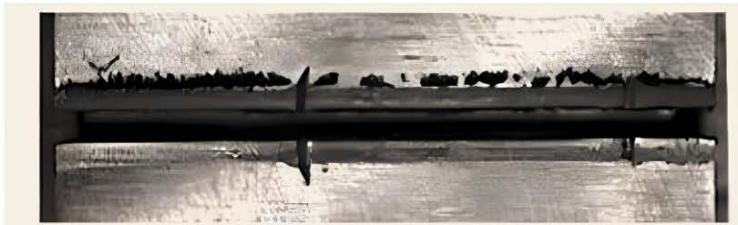
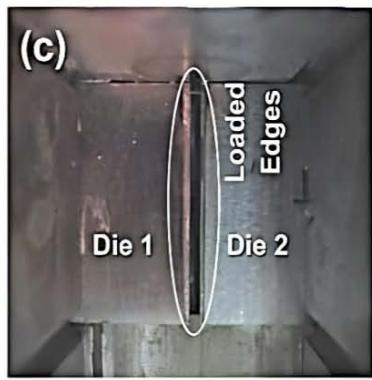 Figure 2: (a) The concept design of simulated trim die edge loading; (b) Self-aligned loading train configuration; (c) Image of specimen damaged edges viewed from fixture opening
### c) Edge Damage Characterization and Measurement
The die holding fixture has an open window to allow a front view and bottom view of mounted two die cubes (at the die loaded edges), and the WC pin can be removed and remounted to the die edge from bottom window, as shown in Figure 2(c). This allows the fatigue test to be interrupted at any specified cycles (at about half of the order of magnitude, i.e., 1, 300, 1000, 3000, 10000, 30000...) while the die edge damage needs to be photographed for measurement. All the specimen were gradually and statically loaded to the peak force before applying cyclic load, which is counted as the first fatigue cycle. Upon completion of the fatigue testing, the recorded edge images were analyzed by image processing, to identify the pin contacted edge areas. As shown in Figure 3(a), the 2D projected damage areas were recorded using a digital camera, and the projected edge damage areas were obtained from the number of pixels and the calibrated magnifications for individual images with the known cube edge length on the image.
The edges, under compressive load from round WC bar, will be plastically deformed under static load up to $F_{\max}$ i.e. the fatigue peak load, then the edge will continually deform under cyclic loading, during which micro-cracks are initiated, and propagated to meso- or macro-scale cracks. When WC pin is pushed down from
$H_0$ (initial corner contact) to $H_1$ and $H_2$, the pin-corner contact arc length (projected) increases from zero to $L_1$ and $L_2$; the corresponding volume $V_1$ and $V_2$ of the die material is moved from original top surface to side wall, as shown in Figure 3(b), where $t$ is the initial gap between two die cubs. Based on the geometrical relationship, the projected edge damage area can be converted to the corresponding volume of materials. Both of them are used to evaluate the edge damage evolution along with the number of cycles.

10,000 cycles

50,000 cycles (a)
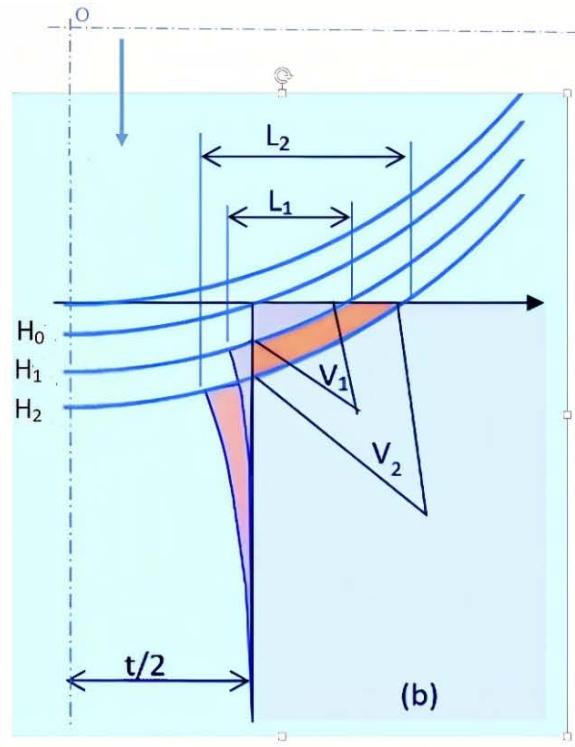 Figure 3: (a) The damaged edge, with the projected damage area highlighted; (b) the schematic of edge profile evolution
### d) Results of Mechanical Testing
Figure 4 plots the projected edge damage area (A) and volume (V) of metal removed from the die corner against $\log_{10}(N)$ for all 16 fatigue tests. In this semi-log plot, it can be observed that all of the A-N curves exhibit a sigmoidal shape. The initial and final portions of the curves exhibit a lower growth rate, while the middle portion of the curves displays a more linear increase at a higher rate. The V-N curves follow the same trend as the A-N curves, so in subsequent analysis, only the edge damage area (A) is used to represent the degree of damage.
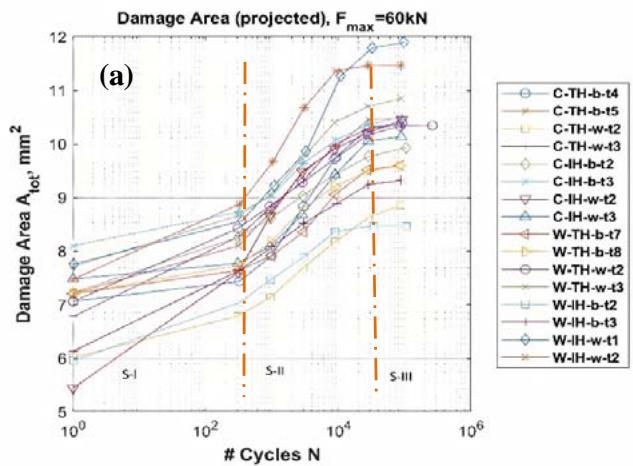
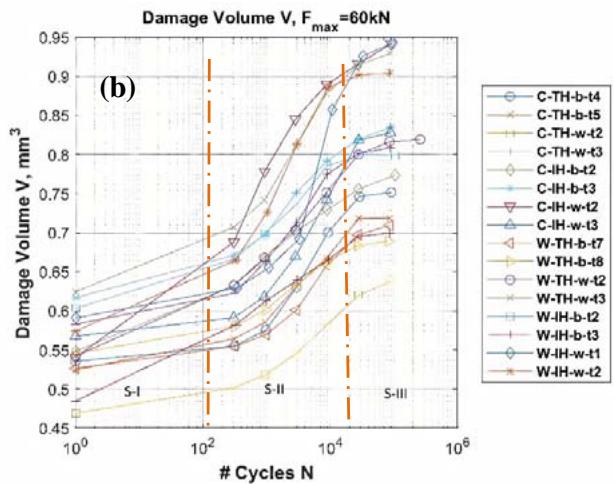 Figure 4: (a) Edge projected damage area vs number of cycles, (b) volume of metal vs number of cycles, showing there are three regimes over tested cycle range
Based on the observed data, we can categorize the A-N curves into three stages of damaging development, namely Stage I (S-I), Stage II (S-II), and Stage III (S-III). These stages are depicted in Figure 4 and are defined as follows: N ~ [1,300] for S-I, N ~(300,30,000) for S-II, and N > 30,000 for S-III. In this research, we focus on evaluating the fatigue performance is Stage II (S-II).
### e) Hardness Measurement and Microstructure Examination
The hardness of the as-received specimens from various process routes was measured. For each manufacturing route, a representative metallographic specimen was prepared through standard grinding, polishing, and etching. The microstructures of the specimens were then scanned and photographed using the microscopy.
Figure 5 (a) displays the hardness for each process route and the solid line represents the mean hardness. It can be seen that half of the C-IH-b coupons did not meet the minimum required hardness value of 58 HRC, resulting in the highest static damage area (refer to Table 1). As a general trend, a higher hardness value results in a lower static damage area (Astat). For example, the W-IH-b route shows the lowest static damage area with the highest hardness value. In terms of the standard deviation, which is shown in Figure 5 (b), the top 3 routes with high variation are: (1) C-IH-b, (2) W-IH-b, and (3) C-TH-w. These routes are either from induction hardening or welding, and the larger variations are introduced from manual operation.
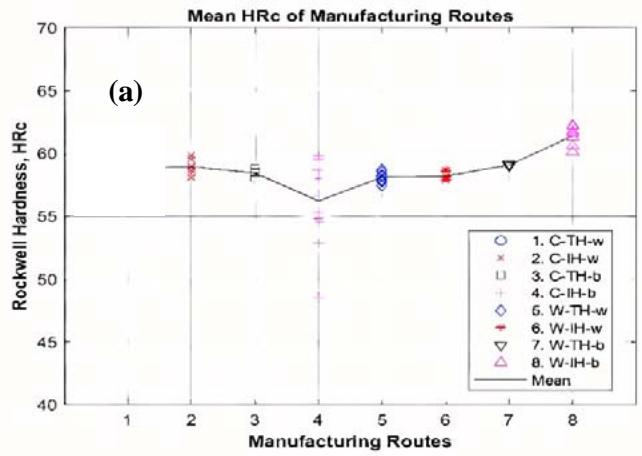
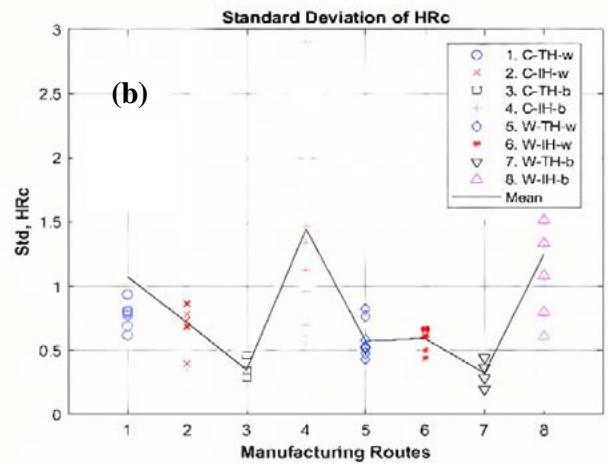 Figure 5: Mean(a) and standard(b) deviation of Rockwell hardness for 8 manufacturing routes. Note that each plotted data point is the mean of 18 measurements (repeats) from one specimen, and about half of these specimens were used for fatigue testing
Based on its chemical composition, the investigated material can be classified as hyper-eutectoid steel [33, 35]. When subjected to equilibrium conditions, heating the material to temperatures ranging from $805 - 875^{\circ}C$ causes the carbide (cementite) to dissolve and transform into austenite. At room temperature, the microstructural phases present may consist of tempered martensite, or a combination of carbide and martensite, bainite, and/or pearlite, depending on the cooling rate depicted in Figure 6. Additionally, the cooling rate has an impact on both the grain size and the size of the phase particles.
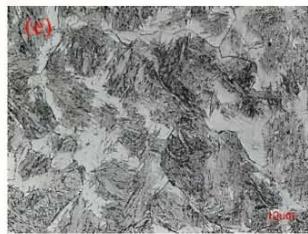
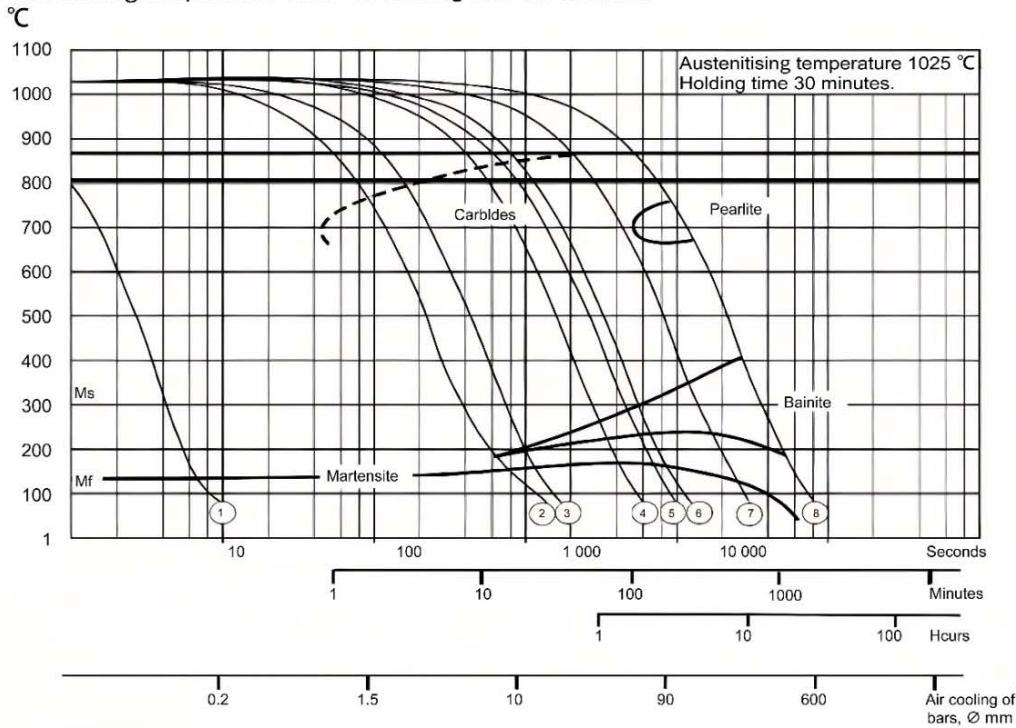
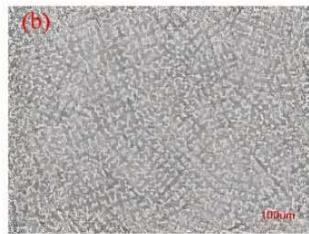
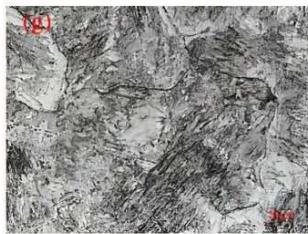
The microstructure produced directly influences the static and dynamic characteristics of the material [36]. No further heat treatment was carried out after TIG welding, and therefore, the welded specimens are only meaningful for comparison between the bulk and weld materials as the previous heat treatment history will be overridden by the welding process. Figure 7 shows the microstructures of unrepaired dies manufactured using four different methods without welding, while Figure 8 displays the microstructures of four repaired dies produced using TIG welding. Based on information provided by the material supplier, all eight manufacturing routes will result in tempered martensite with some retained austenite, which is also confirmed by the microstructure images shown in Figure 7 and Figure 8.
Austenitising temperature $1025^{\circ}\mathrm{C}$. Holding time 30 minutes.
$$
A_{C1f} = 870^{ extdegree}C A_{C1a} = 805^{ extdegree}C
$$
<table><tr><td>Cooling
Curve
No</td><td>Hardness
HV 10</td><td>T800-500
sec</td></tr><tr><td>1</td><td>824</td><td>2</td></tr><tr><td>2</td><td>813</td><td>140</td></tr><tr><td>3</td><td>803</td><td>280</td></tr><tr><td>4</td><td>803</td><td>1030</td></tr><tr><td>5</td><td>792</td><td>1593</td></tr><tr><td>6</td><td>690</td><td>2325</td></tr><tr><td>7</td><td>525</td><td>5215</td></tr><tr><td>8</td><td>464</td><td>13850</td></tr></table>
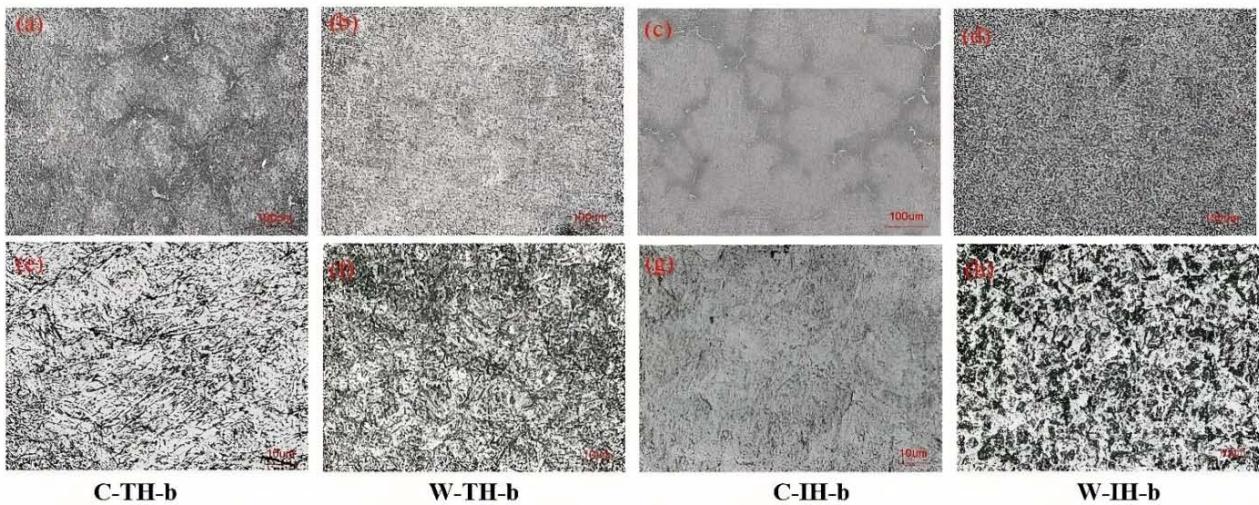
Figure 6: Continuous cooling transformation (CCT) diagram of CaldieTM [23]
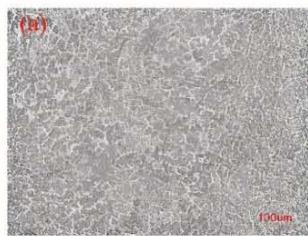 Figure 7: Microstructures of four different kinds of unrepaired dies. For each case two images are given at low (upper) and high (bottom) magnifications, with scale bars at
$100\mu \mathrm{m}$ and $10\mu \mathrm{m}$, respectively; C-TH-b: (a) & (e), W-TH-b: (b) & (f), C-IH-b: (c) & (g), W-IH-b: (d) & (h)
 C-TH-w
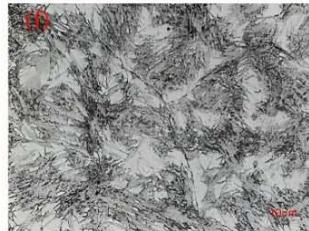 W-TH-w
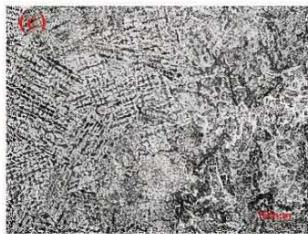
 C-III-W
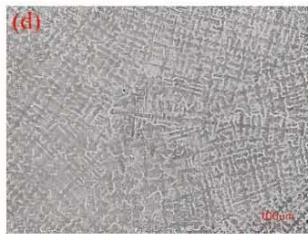
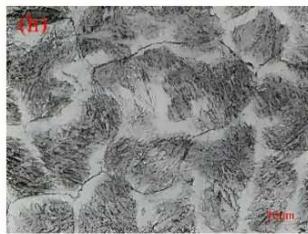
W-IH-w Figure 8: Microstructures of four different kinds of repaired dies by welding. For each case two images are given at low (upper) and high (bottom) magnifications, with scale bars at $100\mu \mathrm{m}$ and $10\mu \mathrm{m}$, respectively; C-TH-w: (a) & (e), W-TH-w: (b) & (f), C-IH-w: (c) & (g), W-IH-w: (d) & (h)
# f) A
The DOE is a methodology for systematically applying statistics to experimentation by considering variation due to the experiment replication. In this study, the DOE method is used to compare the effect of competing manufacturing routes on trim die performance -- fatigue degradation (fatigue damage area over time), denoted by $y_{ijkl}(t)$, where $i,j,k,l$ represent material process, heating method, repair status, and replication, respectively, and $t$ denotes the number of cycles. As $y_{ijklt}(t)$ is a time series data that typically have a temporal dependency, the traditional multi-variable based method cannot be directly applied. In this research, we developed a new two-stage statistical model to analyze the fatigue degradation process over different routes.
In stage 1, the time series data $y_{ijkl}(t)$ is modeled by using a parametric model $f(\theta; t)$, where $\theta$ is the model parameters and $t$ is the time represented by the number of cycles (for a given frequency); In this research, linear regression is chosen as the parametric model. Specifically, the total edge damage area for this stage can be expressed as follows:
$$
y _ {i j k l} (t) = A _ {t o t} = A _ {s t a t} + A _ {c y c} = \left\{ \begin{array}{l l} A _ {s t a t}, & t = 1 \\ A _ {s t a t} + B _ {2} \log_{10} (t), & t = 300 \sim 30,000 \end{array} \right. \tag {2}
$$
where the two model parameters, $A_{stat}$ and $B_{2}$, are used to evaluate and compare the performances of different tests or process routes. Specifically, $A_{stat}$ represents the edge damage under static test when number of cycle $t = 1$, and $\beta$ represents the slope of the damage evolution curve, or dynamic damage rate. In this research, we focus on regime S-II where the number of cycles $t = 300 \sim 30,000$. The $B_{2}$ vs. $\log_{10}(t)$ data show a linear relationship in the semi-log plot, which justify the usage the linear regression model.
To calculate and compare the damage severity of the eight process routes, the tested data was grouped for each route (which includes two tests of four specimens each), and the results were plotted in Figure 9 and listed in Table 1.
In Table 1, the power-law fitting error for parameter $B_{2}$ is estimated by the p-value, which represents the probability of obtaining a correlation as large as the observed value. A small p-value, such as less than 0.05, indicates that the correlation between the experimental data and the fitted curve is significant. The fitting errors for all routes are below the $5\%$ threshold.
The errors in the data are composed of two parts: (1) material processing/operation error, which is dependent on process route, and (2) mechanical testing/measurement error, which is random over different process route. High error cases are often observed in induction hardening (IH) or in welded (w) specimen, due to the manual operation that introduced higher test-to-test variation and specimen-to-specimen variation. This is evident from the hardness measurement of the as-received cube specimens before fatigue testing, as shown in Figure 5.
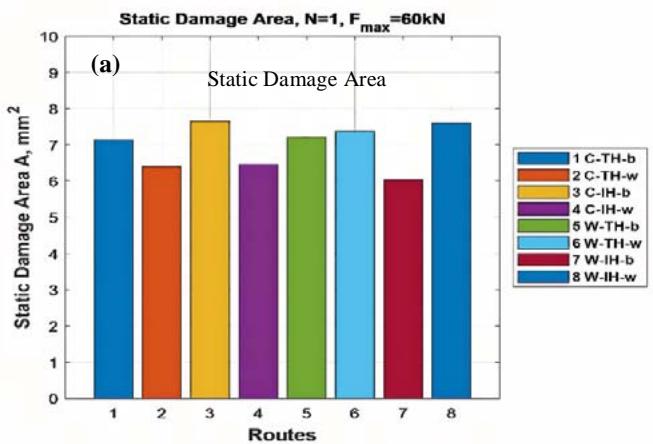
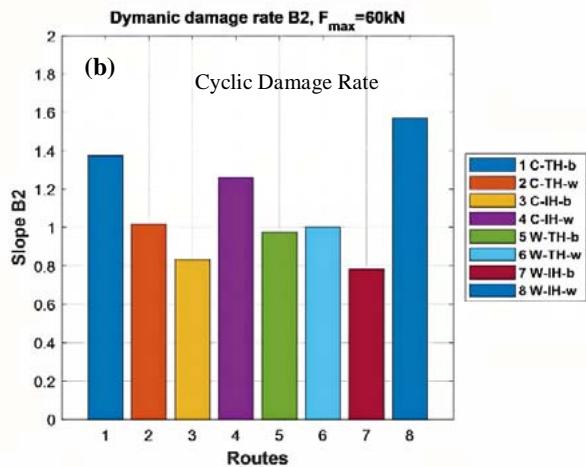
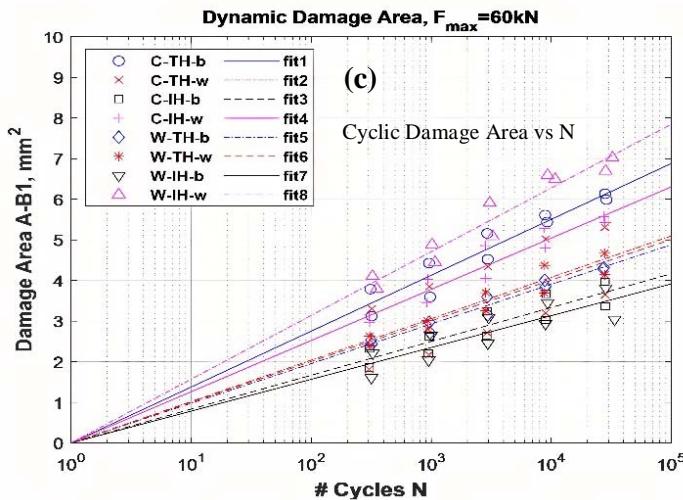 Figure 9: (a) The static projected damage area
$A_{\text{stat}}$, (b) the dynamic damage rate B2, and (c) the dynamic damage evolution over cycles (with the fitted slopes given in b), for 8 manufacturing routes tested at $F_{\text{max}} = 60kN$
Table 1: Measured damages for each process route with error estimate and ranking (a higher score has a lower rank number) <blockquote><table><tr><td rowspan="2">#</td><td rowspan="2">ID</td><td colspan="2">Static</td><td colspan="3">Cyclic</td><td colspan="2">Sum</td></tr><tr><td>A<sub>stat</sub>,mm[2]</td><td>Score</td><td>B<sub>2</sub></td><td>p-value</td><td>Score</td><td>Mean Score</td><td>Rank</td></tr><tr><td>1</td><td>C-TH-b</td><td>7.137</td><td>5</td><td>1.377</td><td>1.72E-05</td><td>2</td><td>3.5</td><td>7</td></tr><tr><td>2</td><td>C-TH-w</td><td>6.397</td><td>7</td><td>1.020</td><td>4.30E-02</td><td>4</td><td>5.5</td><td>2</td></tr><tr><td>3</td><td>C-IH-b</td><td>7.663</td><td>1</td><td>0.833</td><td>3.69E-04</td><td>7</td><td>4.0</td><td>5</td></tr><tr><td>4</td><td>C-IH-w</td><td>6.461</td><td>6</td><td>1.261</td><td>1.39E-05</td><td>3</td><td>4.5</td><td>4</td></tr><tr><td>5</td><td>W-TH-b</td><td>7.206</td><td>4</td><td>0.976</td><td>6.66E-07</td><td>6</td><td>5.0</td><td>3</td></tr><tr><td>6</td><td>W-TH-w</td><td>7.385</td><td>3</td><td>1.003</td><td>3.13E-05</td><td>5</td><td>4.0</td><td>5</td></tr><tr><td>7</td><td>W-IH-b</td><td>6.041</td><td>8</td><td>0.784</td><td>1.48E-03</td><td>8</td><td>8.0</td><td>1</td></tr><tr><td>8</td><td>W-IH-w</td><td>7.615</td><td>2</td><td>1.570</td><td>4.9E-06</td><td>1</td><td>1.5</td><td>8</td></tr></table></blockquote>
<blockquote><table><tr><td rowspan="2">#</td><td rowspan="2">ID</td><td colspan="2">Static</td><td colspan="3">Cyclic</td><td colspan="2">Sum</td></tr><tr><td>A<sub>stat</sub>,mm[2]</td><td>Score</td><td>B<sub>2</sub></td><td>p-value</td><td>Score</td><td>Mean Score</td><td>Rank</td></tr><tr><td>1</td><td>C-TH-b</td><td>7.137</td><td>5</td><td>1.377</td><td>1.72E-05</td><td>2</td><td>3.5</td><td>7</td></tr><tr><td>2</td><td>C-TH-w</td><td>6.397</td><td>7</td><td>1.020</td><td>4.30E-02</td><td>4</td><td>5.5</td><td>2</td></tr><tr><td>3</td><td>C-IH-b</td><td>7.663</td><td>1</td><td>0.833</td><td>3.69E-04</td><td>7</td><td>4.0</td><td>5</td></tr><tr><td>4</td><td>C-IH-w</td><td>6.461</td><td>6</td><td>1.261</td><td>1.39E-05</td><td>3</td><td>4.5</td><td>4</td></tr><tr><td>5</td><td>W-TH-b</td><td>7.206</td><td>4</td><td>0.976</td><td>6.66E-07</td><td>6</td><td>5.0</td><td>3</td></tr><tr><td>6</td><td>W-TH-w</td><td>7.385</td><td>3</td><td>1.003</td><td>3.13E-05</td><td>5</td><td>4.0</td><td>5</td></tr><tr><td>7</td><td>W-IH-b</td><td>6.041</td><td>8</td><td>0.784</td><td>1.48E-03</td><td>8</td><td>8.0</td><td>1</td></tr><tr><td>8</td><td>W-IH-w</td><td>7.615</td><td>2</td><td>1.570</td><td>4.9E-06</td><td>1</td><td>1.5</td><td>8</td></tr></table></blockquote>
In Stage 2 of the developed DOE method, after time series data is modeled by parameters, $y_{ijkl}(t) = \{A_{stat}, B_2\}$, the fatigue damage for different process routescan be analyzed by DOE methods with three factors (the two input variables and their interaction). However, during the welded repair process, the welded material overlays the base material, and all the workpieces are cooled in the air, eliminating the effects of considered raw material process and heat treating methods. Thus, the traditional DOE method with three factors, e.g., factorial design or fractional factorial designs, cannot be directly applied. The new statistical analysis needs to consider the different repair status individually.
We first consider the scenario when the repair status is for the case of base metal not welded. The effects of material process, heat treating method, and their interaction can be modeled as follows.
$$
\boldsymbol {\theta} _ {h} = \mu_ {h} + \alpha_ {h i} + \beta_ {h j} + (\alpha \beta) _ {h i j} + \varepsilon_ {h i j l}; i, j, h = 1, 2; l = 1 \dots m; \tag {3}
$$
Where index $i,j$ is the level of the two input variables $\alpha$ and $\beta$ for raw material processes and heat treatment, respectively, and $h$ is the two levels of response $\theta$. $\theta_{1} = A_{stat}$ and $\theta_{2} = B_{2}$; $\mu_{h}$ is the global mean of the response. For the two input variables, their value ranges are normalized to be at two levels at -1 and 1. i.e., $\alpha_{hi} = -1$ is the raw material process for Cast (C), and $\alpha_{hi} = 1$ for Wrought (W). Similarly, $\beta_{hi} = -1$ for Induction heat treated (IH) and $\beta_{hj} = 1$ for (TH); $(\alpha \beta)_{hij}$ is the effect of the interaction of raw material process and heat treatment at levels $i$ and $j$. In this research, $m = 2$, as two replication are implemented for each route. $\varepsilon_{hijl}$ is the random error component of the model, which are composed of two parts: (1) material processing/operation error, which is dependent on process route, and (2) mechanical testing/measurement error, which is random over different process route.
The model is fitted by using the experiment data, and the results are listed in the following Table 2.
Table 2: Summary of the statistical model \begin{table}[htbp] \centering \begin{tabular}{l|cccc|cccc} \hline \multicolumn{1}{c}{} & \multicolumn{4}{c}{Static damage, $A_{stat}$} & \multicolumn{4}{c}{Cyclic damage rate, $B_2$} \\ \cline{2-5} \cline{6-9} \multicolumn{1}{c}{} & Estimate & Std. Error & $t$-value & P($>|t|$) & Estimate & Std. Error & $t$-value & P($>|t|$) \\ \hline Raw material process & -0.388 & 0.113 & -3.42 & 0.027 & -0.112 & 0.0471 & -2.38 & 0.076 \\heat treatment & 0.160 & 0.113 & 1.41 & 0.233 & 0.184 & 0.0471 & 3.91 & 0.017 \\raw material process $\times$ heat treatment & 0.423 & 0.113 & 3.72 & 0.020 & -0.089 & 0.0471 & -1.88 & 0.133 \\ \hline \end{tabular} \end{table}
<table> <tr> <td></td> <td colspan="4">Static damage, $A_{stat}$</td> <td colspan="4">Cyclic damage rate, $B_2$</td> </tr> <tr> <td></td> <td>Estimate</td> <td>Std. Error</td> <td>$t$-value</td> <td>P($>|t|$)</td> <td>Estimate</td> <td>Std. Error</td> <td>$t$-value</td> <td>P($>|t|$)</td> </tr> <tr> <td>Raw material process</td> <td>-0.388</td> <td>0.113</td> <td>-3.42</td> <td>0.027</td> <td>-0.112</td> <td>0.0471</td> <td>-2.38</td> <td>0.076</td> </tr> <tr> <td>heat treatment</td> <td>0.160</td> <td>0.113</td> <td>1.41</td> <td>0.233</td> <td>0.184</td> <td>0.0471</td> <td>3.91</td> <td>0.017</td> </tr> <tr> <td>raw material process $\times$ heat treatment</td> <td>0.423</td> <td>0.113</td> <td>3.72</td> <td>0.020</td> <td>-0.089</td> <td>0.0471</td> <td>-1.88</td> <td>0.133</td> </tr> </table>
The p-values in Table 2 suggest that both raw material process and heat treatment have a significant impact on static and cyclic damage rates. Specifically, the effects of the raw material process and the 2-way interaction of the raw material process and heat treatment are statistically significant for static damage, as the p-values are smaller than 0.05. While the effects of raw material process and heat treatment are statistically significant for cyclic damage rate. Both models fit the data well, as indicated by their high R-square values of 0.8731 and 0.8597 for static and cyclic damage rates, respectively. These findings provide strong evidence that raw material process and heat treatment are key factors affecting fatigue damage for both static and cyclic tests.
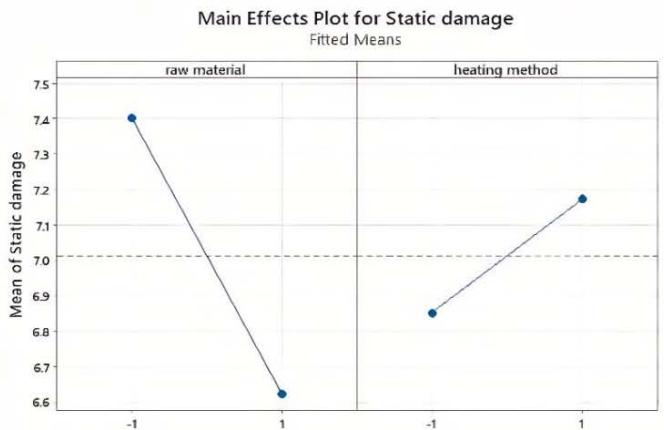
Figure 10 further illustrates the effect of the main factor and 2-way interaction on the static damage. In Figure 10(a), it can be seen that static damage is higher when the raw material process factor is set to the "-" level (C) compared to the "+" level (W). On the other hand, static damage is lower when the heat treatment factor is set to the "-" level (IH) compared to the "+" level (TH), although this effect is not statistically significant. Moreover, Figure 10(b) shows that the combination of raw material process factor C and heat treatment factor IH results in the greatest static damage, while the combination of raw material process factor C and heat treatment factor TH results in the lowest static damage.
(a)
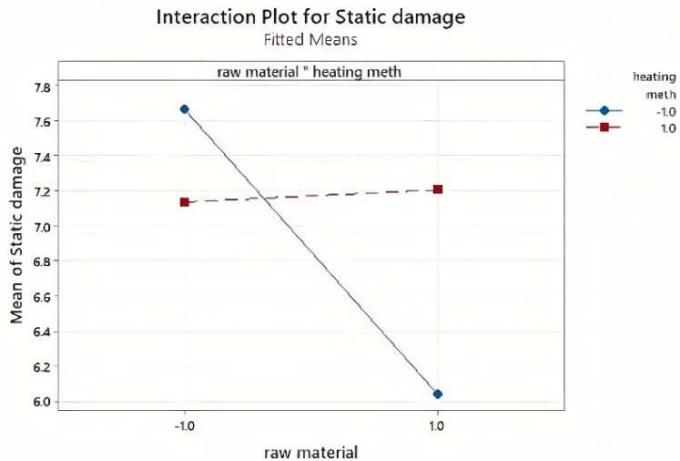
(b) Figure 10: Effect of the main factors and factor interaction on the static damage (a) Main effect of raw material process and heating treatment; (b) Interaction effect of raw material process and heating treatment
Figure 11 illustrates the impact of the factors on cyclic damage rate, with only the main factor effects plotted since the interaction effect is not statistically significant. As shown in Figure 11, the cyclic damage rate is observed to be higher, when the raw material process factor is set to the "-" level (C) or the heat treatment factor is set to the "+" level (TH). Figure 12 presents the results of the model checking procedure for both the static damage and cyclic damage rate. As evident from the figure, the model fits the experimental data well.
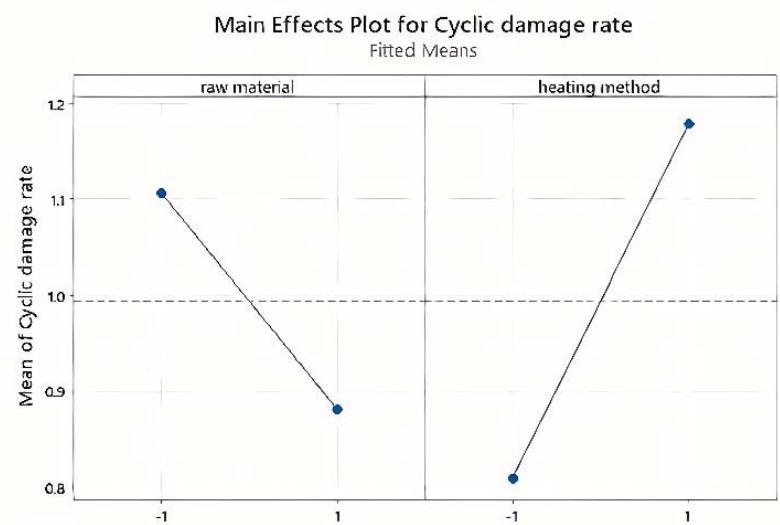
Figure 11: Effect of the main factors and factor interaction on the cyclic damage rate
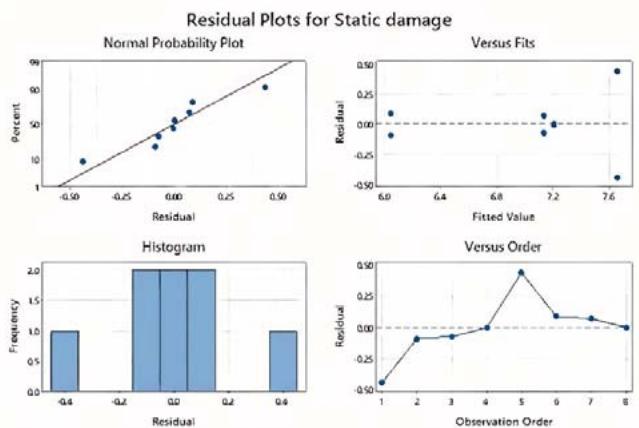
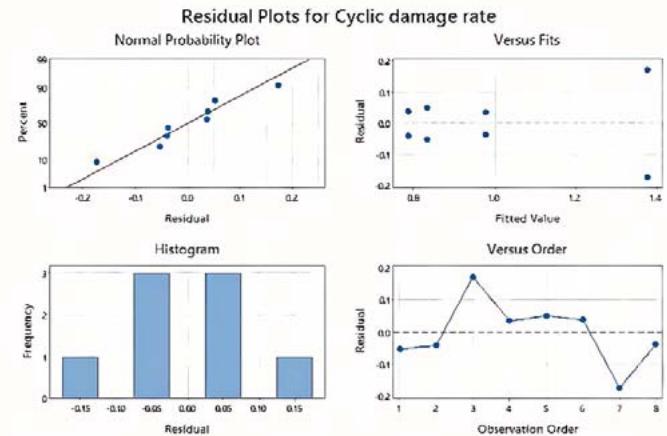 Figure 12: Model checking
In the previous section, the microstructures of the cast and wrought materials, which underwent the same hardening processes, are significantly different. As shown in Figure 7, the cast material has large undissolved eutectic carbides and severe carbon segregation along the grain boundaries of the parent austenite, which are expected to reduce its toughness. On the other hand, the initial coarse dendrite grain structure and large eutectic carbides of the wrought material are broken down by extensive hot plastic deformation, resulting in a refined grain structure and a homogenized distribution of carbon and alloying elements after recrystallization. Additionally, even though both materials may contain similar amounts of martensite after quenching and tempering, the distribution and size of the martensite in the wrought material are much more uniform and smaller than that in the cast material. These two factors explain why the wrought material has a slower dynamic damage rate compared to the cast material.
Furthermore, for TH samples, there are at least two tempering processes according to the recommended heating treatment schedule. This results in a reduction of the retained austenite below $5\%$ [33], which means that the TH sample has significantly less retained austenite compared to the IH sample. Austenite is a soft phase in the matrix, which enhances the material's toughness and slows down fatigue damage. As shown in Figure 7(a) and Figure 7(c), for cast bulk materials, the eutectic carbides located at the initial coarse grain boundaries will not dissolve during the austenization process. The grain size of the parent austenite of C-TH-b and C-IH-b is almost the same under low magnification. However, under high magnification, the martensitic morphology and the amount of retained austenite are clearly different, as seen in Figure 7(e) and Figure 7(g). More lath martensite is generated in C-IH, compared to the needle martensite (or plate martensite) in C-TH. It is well-known that the toughness of lath martensite is better than plate martensite. Therefore, for cast materials, IH results in much better fatigue resistance compared to TH. In addition, for wrought bulk materials, Figure 7(b) and Figure 7(d) show that both heat treatment processes can produce a similar microstructure, i.e., small and uniform tempered martensite with retained austenite. Due to the small starting grain size and homogenized chemical composition in unrepaired wrought dies, IH provides sufficient thermal activation for martensite transformation without coarsening the grain size, unlike TH. Figure 7(h) shows the formation of a cryptocrystalline martensite with a super-fine grain size resulting from the subsequent high cooling rate. As a result, W-IH-b achieved the highest scores in both static and cyclic properties, making it the top-ranked process route among the eight studied in Table 1.
It is also noteworthy that the improved fatigue properties of the IH samples may also be attributed to the pre-hardening process carried out using TH methods. This process increased the original hardness of Caldie from 20 HRc to 36-42 HRc. The tempering curve for CladieTM is shown in Figure 13, where to obtain 36-42 HRc, the tempering temperature should be around $650^{\circ}\mathrm{C}$, which is significantly higher than the standard tempering temperature of $525^{\circ}\mathrm{C}$ used to achieve 58-62HRc. Hence, this quenching and high-temperature tempering process may provide a more uniform texture for the C-IH-b and W-IH-b samples before induction hardening, which is beneficial for the formation of smaller and more evenly distributed martensite in the matrix. Moreover, high-temperature tempering can cause the participating carbides to grow further, resulting in a larger carbon-depleted area in Cast Caldies, which also explains why more lath martensite is generated in the C-IH samples [37]. Given its crucial role in phase transformation, there seems to be a large scope for improving the heat treatment process.
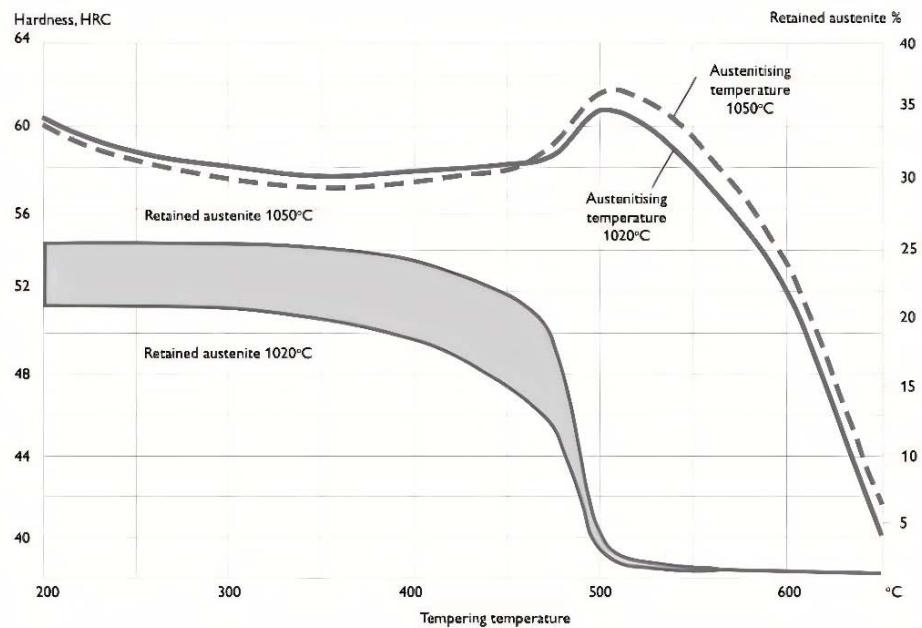 Figure 13: Tempering Graph for CaldieTM[33]
Next, we consider the scenario when the repair status is set as (w), i.e. the die edge is welded with CaldieTM filler wires. Under this situation,
$$
\boldsymbol{\theta}_h = \xi_h + \tau_{hk},\,k=1\dots n;
$$
where $h = 1,2.\mathbf{\theta}_1 = A_{stat}$ and $\mathbf{\theta}_2 = B_2$; $\xi_h$ is the mean effect of the response; $\tau_{hk}$ is the error term and $n = 4$ as we have four samples.
Tests were conducted to determine the equality of means and variances across different repair statuses for both static damage $A_{stat}$ and cyclic damage rate $B_{2}$.
The results are presented in Table 3. Since the p-values for the equal mean tests for both static damage and cyclic damage rate are large, we cannot reject the null hypothesis that the means are equal across different repair statuses. Similarly, since the p-values for the equal variance tests for both static damage and cyclic damage rate are large, we cannot reject the null hypothesis that the variances are equal across different repair statuses.
Table 3: Tests for equal mean and variance for different repair status (w v.s.b)
<table><tr><td></td><td colspan="2">Static damage, Astat</td><td colspan="2">Cyclic damage rate, B2</td></tr><tr><td></td><td>F statistics</td><td>p-value</td><td>F statistics</td><td>p-value</td></tr><tr><td>Test for equal mean</td><td>0.02</td><td>0.90</td><td>2.64</td><td>0.12</td></tr><tr><td>Test for equal variance</td><td>0.58</td><td>0.46</td><td>0.05</td><td>0.83</td></tr></table>
Theoretically, the static damage and cyclic damage rate should be similar for all welded materials, since the welding process is the final procedure and all the workpieces are cooled in the air. However, the results show dramatic variations in response to changes in the substrate metals, which is also consistent with the large variation in the hardness measurement of the welded die.
As seen from Table 1, overall for welded and bulk materials, they have similar static properties, but the welded material has a much higher cyclic damage rate compared to the bulk material. In terms of the individual cases, only in the case of C-TH, the welded die shows a slower accumulation of damage compared to the bulk new die, while in the other three cases, the result is reversed. As observed from the low magnification images in Figure 8(a) through 8(d), all welded samples showed considerable dendrite structures in the matrix, except for C-TH-w, which had very small and uniform grain size. This explains why C-TH-w was ranked second overall in Table 1. The high magnification images, Figures 8(e) through 8(h), reveal the presence of micro-crack defects in all four welded samples that were generated during the welding process. These defects are expected to deteriorate the fatigue resistance of the welded dies. Additionally, manual TIG welding with Caldie wires may also introduce a large heat-affected zone (HAZ), which
further worsens the fatigue properties of the repaired dies.
## III. CONCLUSIONS AND DISCUSSION
In this research, accelerated fatigue testing was performed using a newly designed trim die simulator, with projected edge damage areas being used to quantify cutting-edge damage. Edge damage amounts as a function of the number of cycles were obtained and used to compare and rank the different process routes. A new two-stage statistical model was developed to systematically analyze the effect of different manufacturing routes on fatigue damage path. In addition, microstructures resulting from the various manufacturing routes were also studied, revealing that solidification thermal conditions and heat treatment schedules significantly impact the microstructures produced and subsequent fatigue properties of the trim die. Based on these findings, it can be concluded as follows:
1. Cast material is generally more prone to damage underboth static and cyclic loading compared to wrought metal, because of its more brittle dendritic microstructure and eutectic carbides. This is due to their brittle dendritic microstructure and eutectic carbides. In contrast, wrought metals break down the cast dendrite and primary carbides through hot deformation and recrystallization, resulting in a refined grain structure.
2. The heat treatment history significantly impacts the fatigue performance of tool steel. Overall, the IH heat treatment leads to much better cyclic damage resistance than the TH heat treatment, for both nonwelded cast and wrought dies. This could be due to the pre-hardening process and the higher cooling rate, which promotes grain refinement.
3. The welded die edges (with the exception of C-TH) show a higher cyclic damage rate compared to bulk metals in overall comparisons. This can be attributed to the formation of abundant dendrite textures, the heat-affected zone, welding defects, and variations from manual welding operations.
4. The fatigue damage of the trim die over time is a time series data, so the traditional DOE methods are not sufficient to characterize the damage path. To handle this issue, a new two-stage DOE method is developed in this research to describe fatigue damage paths over time. Based on the proposed model, the fatigue damage over time of a new trim die can be predicted.
In the stamping industry, some material processing routes, such as forming and heat treatment, are unavoidable due to industry-wide best practices and time constraints. At times, limitations in material availability also result in suboptimal processing choices. Despite cast material's tendency to be more susceptible to damage compared to conventional wrought bar stock, its design versatility and size capabilities make it a commonly used material in stamping dies. To harden dies, including large cavities and components, various methods such as flame, induction, or through-hardening, are employed in the industry. The choice of hardening method can greatly impact downstream die performance, particularly before other surface applications, such as ion nitride and PVD coatings. It is ideal to control the cooling rate in all hardening processes, whether through optimized quenching mediums or heat retention coverings. Another factor affecting die longevity is its condition. For repair reasons, all stamping dies require subsequent weld overlays in addition to the base material. It is important for die shops to understand crucial factors such as cap and filler weld rod selection, speeds and feeds, and application temperature. Although welds on stamping dies are unavoidable, the material usage can be optimized by using a preferred weld material and minimizing the formation of heat-affected zones.
In this study, the statistical models and analysis are based on fatigue damage information obtained through a pre-processing step using image processing methods. In the future, deep learning models will be developed using deep neural networks, allowing the model and analysis to directly utilize image information. Furthermore, the microstructure information will be quantitatively extracted and incorporated into the statistical learning models and analysis to achieve more accurate damage predictions.
For the purpose of trim die reconditioning, edge welding with high-grade materials followed by rapid cooling can be an effective process route. This can be achieved through the use of an automated welding system. We have tested both MIG welding and laser powder deposition on trim die corners, and found that a portable 3D electrically-driven automated machine for MIG/TIG welding followed by quick cooling, or a special version of a laser additive manufacturing system with a portable diode laser welding unit and powder filler, could be used to achieve superior welding quality. This system eliminates heat-affected zones, refines the microstructure, improves both static and dynamic properties, and strengthens the cutting edge by adding high alloys, making it adaptable to a wide range of base die materials such as cast, wrought, and low-cost base metals. The implementation of such a system will ultimately address concerns regarding trim die performance and sustainability.
### ACKNOWLEDGEMENT
Funding support of this study is provided by US Auto/Steel Partnership under the project of STO P13 - CALDIE.
- from Different Manufacturing Routes. WCX SAE World Congress Experience, 2022-01-0245.
35. website.http://www.steeldata.info/tempering/demo/data/2177.html.
2017.
36. Hanlon, T., Y. N. Kwon, and S. Suresh, Grain size effects on the fatigue response of nanocrystalline metals. Scripta Materialia, 2003. 49(7): p. 675-680.
37. William D. Callister Jr. and David G. Rethwisch, Fundamentals of Materials Science and Engineering, 2018.


Generating HTML Viewer...
References
34 Cites in Article
W Albert (1837). Albert; über Treibseile am Harz.
A Wöhler Bericht fiber die Versuche, welche auf der k6nigl. Niederschlesisch-miirkischen eisenbahn mit Apparaten zum Messen der Biegung und Verdehung von Eisenbahnwagenachsen w/ihrend der Fahrt angestellt wurden.
A Wöhler (1860). Versuche über die chemische Einwirkung von Wasser, Kohlensäure, Ammoniaksalzen etc. auf einige Gesteine und Erdarten.
A Wöhler (1863). Ober Versuche zur Ermittlung der Festigkeit von Achsen, welche in den Werkst/itten der Niederschlesisch-M/irkischen Eisenbahn zu Frankfurt a.d.O, angestellt sind.
J Eshelby,J Hirth,R Dewit (1969). Fundamental aspects of dislocation theory: conference proceedings.
J Bauschinger (1880). Ober das Kristallinischwerden und die Festigkeitsverminderung des Eisens durch den Gebrauch.
J Bauschinger Über die Veränderung der Elastizitätsgrenze und des Elastizitätsmoduls verschiedener Metalle.
J Bauschinger (1886). 2. Der Einfluß der Seilmasse auf die unter der Einwirkung der Schwere sich ausbildenden Seilschwingungen und die Beanspruchung des Seiles durch diese Schwingungen bei fester Einspannung des oberen Seilendes.
O Basquin (1910). Officers of the American Society of international Law for the Year 1910–1911.
C Soderberg,V Sweden (1930). Factor of Safety and Working Stress.
J Goodman (1899). Recent Literature Claude Bernard . By Michael Foster, M.A., M.D., D.C.L., etc., Secretary of the Royal Society of London; Professor of Physiology in the University of Cambridge. New York: Longmans, Green & Co. 1899..
H Gerber Bestimmung der zulassigen Spannungen in Eisenkonstructionen.
B Haigh (1915). BRITISH ASSOCIATION FOR THE ADVANCEMENT OF SCIENCE. MEETING AT MANCHESTER..
B Haigh (1917). Experiments on the fatigue of brasses.
B Haigh (1920). Strain-energy Function and the Elastic limit.
L Coffin (1954). A study of the effect of cyclic thermal stresses on a ductile metal.
S Manson (1965). Fatigue: A complex subject—Some simple approximations.
Alan Griffith (1920). VI. The phenomena of rupture and flow in solids.
Alan Griffith,G Taylor,V (1921). VI. The phenomena of rupture and flow in solids.
W Schütz (1996). A history of fatigue.
S Suresh (1998). Fatigue of materials.
Friedrich Pukelsheim (2006). Optimal Design of Experiments.
D Montgomery (2017). Design and analysis of experiments.
R Fisher (1921). Studies in crop variation. I. An examination of the yield of dressed grain from Broadbalk.
R Fisher (1960). Textbook of pharmaceutical chemistry. 7th ed. By J. E. Driver. Oxford University Press, 417 Fifth Ave., New York 16, N. Y., 1960. ix + 728 pp. 15.5 × 24.5 cm. Price $14.50.
G Box,J Hunter (1961). The 2 k-p Fractional Factorial Designs Part II.
G Taguchi (1986). Introduction to quality engineering: designing quality into products and processes.
G Taguchi (1979). Introduction to off-line quality control.
William Hill,William Hunter (1966). A Review of Response Surface Methodology: A Literature Survey.
M Mckay,R Beckman,W Conover (2000). A Comparison of Three Methods for Selecting Values of Input Variables in the Analysis of Output From a Computer Code.
Jiju Antony (2014). Fundamentals of Design of Experiments.
Pengyan Lu,Xingyu Chen,Qingyu Yang,Xin Wu,Patricia Miller (2022). A Comparative Study on Fatigue Damage of Caldie™ from Different Manufacturing Routes.
No ethics committee approval was required for this article type.
Data Availability
Not applicable for this article.
How to Cite This Article
Pengyan Lu. 2026. \u201cA New Design of Experiment Method for Trim Dies Considering Fatigue Failure\u201d. Global Journal of Research in Engineering - A : Mechanical & Mechanics GJRE-A Volume 23 (GJRE Volume 23 Issue A2): .
Explore published articles in an immersive Augmented Reality environment. Our platform converts research papers into interactive 3D books, allowing readers to view and interact with content using AR and VR compatible devices.
Your published article is automatically converted into a realistic 3D book. Flip through pages and read research papers in a more engaging and interactive format.
In automotive body manufacturing, the dies used for blanking, trimming, and piercing are subject to harsh and demanding conditions, including high-impact loading and a large number of cycles. As the strength of sheet metal continues to increase, the service life of trim dies has become a major concern for the industry. To address this issue, this study conducted a comprehensive comparison of the fatigue lifetime of trim dies produced using different manufacturing processes, which involved two distinct materials (wrought vs. cast), two different die heat treatment methods (induction-hardened vs. through-hardened), and analysis of the effect of edge weld repair on fatigue lifetime. An accelerated trimming simulator test is developed to cyclically load and assess the cumulative damage evolution of the cutting edge of a die specimen at a set number of cycles. The evolution of edge damage areas and volumes were used to compare and rank the fatigue performance of each studied condition. A new statistical model is developed to systematically analyze the effects of different routes on fatigue damage over time considering process uncertainty. Microstructures and hardness were analyzed to provide metallurgical explanations of the test results. Suggestions to improve trim die performance and areas for further study are provided.
Our website is actively being updated, and changes may occur frequently. Please clear your browser cache if needed. For feedback or error reporting, please email [email protected]
Thank you for connecting with us. We will respond to you shortly.