The applicability of a mobile learning system reflects how it works in an actual situation under diverse conditions. In previous studies, researches for evaluating applicability in learning systems using data mining approaches are challenging to find. The main objective of this study is to evaluate the applicability of the proposed mobile learning framework. This framework consists of seven independent variables and their influencing factors. Initially, 1000 students and teachers were allowed to use the mobile learning system developed based on the proposed mobile learning framework. The authors implemented the system using Moodle mobile learning environment and used its transaction log file for evaluation. Transactional records that were generated due to various user activities with the facilities integrated into the system were extracted. These activities were classified under eight different features, i.e., chat, forum, quiz, assignment, book, video, game, and app usage in thousand transactional rows.
## I. INTRODUCTION
Mobile learning (ML) emerged as an essential and successful learning method due to its flexibility of time and place for learning in the present globe. On the other hand, learners and teachers have an interactive and cost-effective learning environment for carrying out educational activities with cutting-edge technology advancements. However, at the same time, learners and teachers experience various limitations in this learning method, such as the quality of the learning applications. Therefore, it is vital to evaluate ML applications in various dimensions, such as their ML applicability [1]. The Cambridge Oxford Dictionary defines applicability as "the fact of affecting or relating to a person or thing." Applicability definitions for domains related to computer systems are minimal. Hence we found a specific definition for the public health sector domain, and it defines applicability as "the extent to which an intervention process could be implemented in another" [2]. On the other hand, transferability gives a meaning similar to applicability. It defines transferability as "the extent to which the measured effectiveness of an applicable intervention could be achieved in another setting". Rosemann and Vessey (2008) proposed the significance and capability to check the applicability of a research framework with three factors, i.e., importance, accessibility, and suitability [3]. Accordingly, we can recognize an applicable mobile learning system (MLS) as "the extent to which a MLS could be implemented effectively in a target environment as well as in another environment with a similar setting". This study's main objective is to evaluate the applicability of the proposed mobile learning framework (MLF). This framework consists of seven independent variables, and each variable has different influencing factors. Evaluating this MLF for applicability would help realize the proposed framework's applicability when it works in a real-world environment. Normally, pattern mining algorithms are used to describe patterns in usage behaviors [4]. Hence, we use pattern mining to study users' usage of different learning tools in the system, such as chat, forum, quizzes, assignments, etc. Proper understanding of these usages would help calculate how many users apply these tools in their academic activities in the proposed system. Considering each tool's usage would support predicting the system's overall applicability (Fig. 3: motivating example). Because if a learning system has better applicability, its users should fully practice the tools integrated into it. In this study, the authors intend to analyze the transactional log of the MLS, developed using the proposed MLF for evaluating applicability. According to the previous studies, the FP-Growth[5] efficient pattern mining and Apriori [6] popular association rule mining algorithms have been utilized to evaluate many automated systems. FP-Growth algorithm was used to evaluate systems to identify important segments in learning materials [7], learning
behaviors[8], best course modules[9], learners requirements[10], offensive activities, and illegal transactions[11]. In these studies, the FP-Growth algorithm helps to improve the learning process, course selection[9], course recommendation[10], security enhancement, and legal judgments [11] in learning systems and portals. On the other hand, the Apriori algorithm was used to evaluate systems to identify, information for decision making[12], tourists attractive places[13], course administration history[9], study preferences, archived cyber-attacks, and network hackings[14], requirements in software [15], health clinical information in clinical[16], and deformation states of landslides[17]. In these studies, the Apriori algorithm help in different activities such as better administrative decisions[12], improving tourist attraction[13], enhancing course facilities, offering productive subjects[9], preventing networks attacks[14], recommend software requirements[15], enhanced health decision and treatments[16], and predict landslides accurately[17]. But it is a very shortage of using FP Growth or Apriori algorithms in the evaluation applicability of learning systems. Also, difficult to find such applicability evaluation using any statistical approach too in previous studies. Moreover, these two well-established algorithms have no direct provisions for evaluating the applicability of the system. Nevertheless, using the rules and frequent patterns generated by Apriori and FP Growth algorithms can predict applicability. In this study, the authors proposed a novel frequent pattern mining algorithm for applicability evaluation directly in the proposed learning system to address this research gap. Also, FP Growth and Apriori algorithm are used to predict the applicability of the same system.
## II. RELATED WORK
Pattern mining is a popular data mining tactic to emerge secret knowledge in data stores, and it is applied for solving issues arising in various scenarios. A Pattern mining approach was proposed to identify the most critical or complex learning segments in video tutorials. The proposed method integrates a learning model that learns the above-considered components of the analysed video transaction log. [7]. A pattern mining framework was proposed to identify learners' different learning behaviors and improve their learning process with the institutional learning system. This study's output reveals that the learners obtained significant study performance in different learning modes via various tools integrated into the system [8]. Another pattern mining framework was proposed to analyse huge databases by addressing existing pattern mining algorithms such as a large number of searching iterations, excessive space for processing, and too much time requirements. Results reveal that this approach can solve different kinds of pattern mining problems[18]. An online course recommender system was proposed using the FP-Growth algorithm to guide learners to select learning courses according to their preferences. The investigation displays that the system has better efficiency in instructing learners for selecting appropriate learning materials in their learning process [9]. FP-Growth-based data mining technique was used to promote educational services in educational institutes. Various variables related to learners and educational institutes were employed on FP-Tree to determine regular data items. Research reveals that the best selection of attributes in the data for the algorithm gives better results[19]. FP-Growth algorithm was used to elaborate users' access patterns in learning portals. The study revealed, such as learners' favorite courses, less and high navigation areas of the learning site, and recommendations for advancing both learner's gain and user-friendliness of the site[10]. Wu and Zhang (2019) researched to extract support information to prove offensive actions. An improved FP-Growth algorithm analysed data associated with illegal transactions and supported legal judgment with better efficiency and accuracy[11].
Another method for hidden information recovery from large databases is associate rule mining, and its applications are spread in various researches in the past. The E-learning system was evaluated by combining the association rule mining method and the fuzzy analytic hierarchy process[20]. Apriori algorithm-based association rule mining was used to analyse the Wi-Fi data in attractive tourist places. The study results give the association rules of travel patterns of tourists' movements and enable further enhancements of tourist's magnetism of travel destinations[13]. Learner assisting study guides approval mechanism was proposed using association rule mining with archived course administration data. This approach queries useful relationships in learners' learning subject preferences[9]. An improved Apriori algorithm is offered to find fresh network attacks using the data that was produced by previous episodes. This method has optimal accuracy with superior efficiency for discovering cyber strikes[14]. A customized Apriori algorithm was used to improve the audit system's security building association rules using fewer scanning cycles in logs with shorter processing time[21]. Apriori algorithm-based recommender system was proposed to enhance the accuracy of requirements in software development [15]. Apriori algorithm was coustomized to excavate intelligence information from virtual reality applications for effective decision making[22]. Apriori algorithm was executed successfully in analyzing the deformation states of landslides [17]. A heart disease prediction model was proposed by applying the Apriori algorithm in clinical datasets[23]. Here, we used the Apriori associate rule mining and FP-Growth frequent pattern mining algorithm-based approaches as comparable methods to the novel proposed pattern mining algorithm for evaluation applicability of the proposed MLS.
## III. PRELIMINARIES
In this section, the authors discuss the proposed MLF and its implemented MLS, which will be evaluated for applicability. Also, the critical theories undergo related to the proposed solution for evaluating the system's applicability, such as associate rule mining, Apriori, and FP-Growth algorithms.
### a) Mobile Learning Framework for Higher Education
We can refer to many frameworks that were implemented in the Moodle environment successfully in previous studies. Halvoník and Kapusta (2020) implemented an e-Learning material composing framework through Moodle LMS with the teachers' highest inclination[24]. A framework for evaluating student learning was performed through the Moodle platform to create useful tests for learners[25]. Karagiannis and Satratzemi (2017) proposed a Moodle implemented framework for e-learning content adaptation according to learner wishes and better usability with decent learning outcomes[26]. Hence, according to the literature, several conceptual frameworks have been implemented via the Moodle mobile learning environment (MMLE). So in our study, we implemented the proposed conceptual MLFrame through the MMLE.
In this study, we require to measure the applicability of the MLS implemented based on the proposed MLF for higher education (MLFrame). This framework consists of seven independent variables: learner, teacher, mobile ML devices, ML tools, ML contents, higher education institutes, and communication technology (Fig. 1). Each independent variable has several influencing factors: motivation, usefulness, interactivity, ease of use, etc. These factors were realized through various resources and facilities embedded in the MLS such as chat, forum, games, quizzes, assignments, etc.[27],[28]. This MLFrame was implemented in the MMLE by integrating new facilities and modifying the existing Moodle mobile application. Therefore, existing Moodle plugins were enhanced to develop these new ML facilities for the Moodle mobile environment[28]. Because most of the facilities available in the Moodle learning environment are not implemented in the Moodle mobile environment. Hence, when implementing the MLFrame in the Moodle mobile environment, we customized the Moodle ML application by upgrading relevant plugins to serve the facilities introduced in the MLFrame.
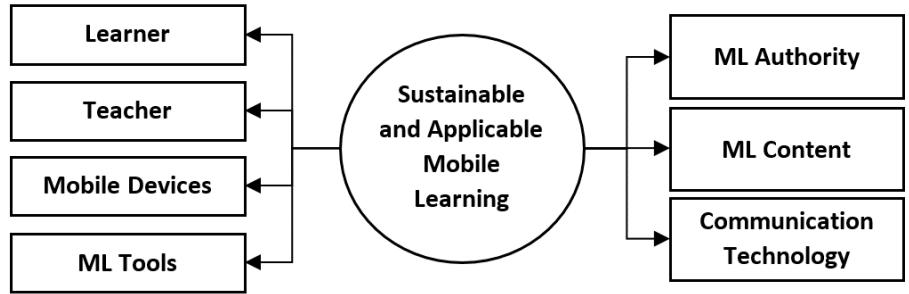

Fig. 1: Proposed MLF for higher education (MLFrame) (a)

(b)

(c)
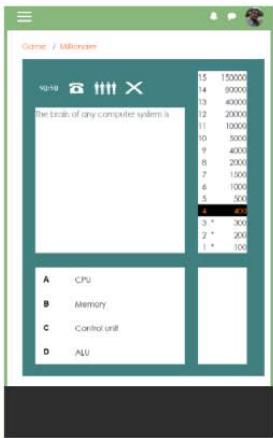
(d) Fig. 2: Interfaces of Some of the Features Considered in the Study Such as (a) Course Overview, (b) Chat, (c) Forum, and (d) Game in the Modified Moodle Mobile App
### b) Motivating Example
Fig. 3 depicts the concept associated with predicting the system applicability. Consider a MLS with facilities chatting, forum, quiz, assignment, book, video, game, and app. If this app was allowed to use 100 particular users, then assume transaction log analysis as follows. 8,7,6,5 features out of all 8 features used by 60,10,15,5 users, respectively. Therefore, 70 users out of 100 users used at least 7 features out of all 8 features (or $88\%$ features). Hence system applicability was $70\%$ for $88\%$ feature usage. Further, 85 users out of 100 users used at least 6 features out of 8 features (or $75\%$ features). Hence system applicability is $85\%$ for $75\%$ features usage. Similarly, it can be realized that the system applicability is $90\%$ for $63\%$ features usage.
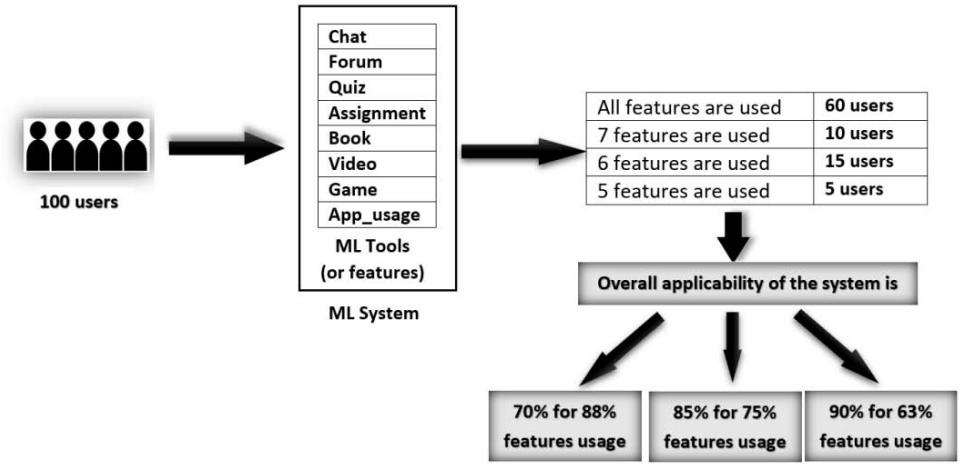 Fig. 3: Example for Predicting Applicability using Pattern Mining Algorithm
### c) Associate Rule Mining
Association rule mining is used to find essential associations among stored data in large databases. 'Antecedent' and 'Consequent' are significant two fractions in association rules. These are data items finding in databases, and 'Antecedent' combines with the 'Consequent'. Moreover, finding frequent itemsets is a crucial requirement to mine association rules from databases. Additionally, two important factors, such as support and confidence, must be defined when finding association rules using these frequent itemsets[29].
### d) Apriori Algorithm
Apriori is a Latin term which denotes "from what comes before". Bottom-up and breadth-first search strategies are taken into account. Agarwal and Srikant (1994) developed the Apriori algorithm for generating associate rules by frequent pattern mining. The main terminologies used in the Apriori algorithm are Min_supp, Min_conf, Frequent itemsets, Apriori Property, Join Operation, Join Step, and Prune Step [30].
### e) Frequent Pattern (FP) Growth Algorithm
FP-Growth is a widespread pattern mining algorithm used in data mining. In this algorithm, frequent patterns are stored in a tree-like data structure called FP-tree. The algorithm's main steps are calculating each database item's support count by scanning, deleting irregular patterns, and order remains. Then FP-tree is constructed and frequent patterns are generated using FP-tree [5]. This improves the frequent pattern mining technique because it scans the database only twice. There is no candidate set generation, though it is not suitable for mining patterns in databases that are updated frequently[31].
## IV. PROPOSED METHOD
Details of the proposed novel frequent pattern mining algorithm, namely the Binary Total for Pattern Mining (BTPM) algorithm, which evaluates the proposed MLF's applicability, are described in this section.
### a) Process of the Proposed Algorithm
The processing steps of the proposed algorithm implementation are described below.
Procedure 1: Purpose is generating a features list (extracting unique features, used in this evaluation, stored in the transaction log of the system)
Step 01 & 09: For loop iterates from $1^{\text{st}}$ row to last row of the transactional database.
Step 02 & 08: For loop iterates from $1^{\text{st}}$ item to the last item of a transactional database row.
Step 03 & 07: For loop iterates from $1^{\text{st}}$ item to the last item of the array call Array Features. Array Features is an array that contains unique features of the transactional database.
Step 04: Check whether each item does not exist in the array Array Features $(\mathsf{f}_{\mathfrak{m}})$
Step 05: If the new item is not in the array, the item is saved in Array Features as the last item $(f_{s+1})$. Likewise,
Array Features consists of an array of distinct features in the transactional database.
Procedure 2: Purpose is creating BIMF Data Set(The usage transaction table needs to be converted into the Binary Incidence Matrix Format (BIMF))
Step 10: Creating an array calls Array Data Set BIMF[] for saving the transactional database in binary incidence format array size is:
t x s; t means the number of transactions in the transactional database;s means the number of features in the array Features[]. Assign 0 for all the array elements.
Step 11 & 19: For loop iterates from $1^{\text{st}}$ row to last row of the transactional database
Step 12 & 18: For loop iterates from $1^{\text{st}}$ item to the last item of a transactional row
Step 13 & 17: For loop iterates from 1st item to the last item of the array called Array Features[].
(Note: Array Features[] contains distinct features of the transactional database)
Step 14: Check each item in the transaction database $(a_{ij})$ with feature items in Array Features $(f_m)$
Step 15: If a similar item is found, replace the value in the Array Dataset BIMF with 1. The position of the item (i.e. $d_{im}$ ) substituting in the Array Dataset BIMF is found by taking the associate item's row number of the transactional database ( $i^{th}$ row) and column number of the Array Features ( $m^{th}$ column).
Likewise, replace 0 with 1 in Array Dataset BIMF to denote similar features in the same column in Array Dataset BIMF for all items in the transactional database.
Procedure 3: Purposes are,
1) Saving BIMF dataset (ArrayDatasetBIMF[]) to an Array (ArrayTDVT[]) by creating tdvt and cnb. (tdvt: Total Decimal Value of binary digit positions in entire Transactions; cnb: Count of the Non-zero Binary digits)
2) Selecting and Saving Patterns to ArrayPatterns
Step 20: Create arrays named ArrayTDVT[] and ArrayPatterns[]
- Step 21: For loop iterates from $1^{\text{st}}$ row to last row of the ArrayDatasetBIMF[]
- Step 22: For loop iterate from $1^{\text{st}}$ column to last column+2 ArrayDatasetBIMF[]
- Step 23: Insert items (features) in Array DatasetBIMF[] to ArrayTDVT[] by row wise.
- Step 24: Advance the inner loop
- Step 25: Once a particular row of Array DatasetBIMF[] is inserted to ArrayTDVT[], tdvt and cnb values are inserted to the same row in ArryTDVT[] as last tow column.
The second last element $(n + 1)$ of each row of the array is the Total Decimal Value of binary digit positions in entire Transactions (tdvt).
$\mathrm{tdvt}_{\mathrm{i}} = \sum_{j=0}^{n-1} d_{ij} 2^{j}$; where $d_{ij}$ is the digit value of $j^{\text{th}}$ position in $i^{\text{th}}$ transaction i.e., $d_{ij} = \{0,1\}$
The last element $(n + 2)$ of each row of the array is the Count of the Non-zero Binary digits in each transaction row $(\mathsf{cnb}_i)$.
$\mathrm{cnb}_{i} = \sum_{j=0}^{n-1} d_{ij}$; where $d_{ij}$ is the digit value of $j^{\text{th}}$ position in $i^{\text{th}}$ transaction i.e., $d_{ij} = \{0,1\}$
Step 26: At the end of each row, check whether the percentage of features used in a transaction is greater than or equal to minFUT. The minFUT is the given threshold value for the percentage of minimum features usage in a transaction. For instance, if minFUT = 70% for a 10 features transaction means, at least 7 features are used out of 10 features by a user.
$$
(\text{if} j = n \text{and} c n b _ {i} (1 0 0 / n) > = \min F U T \text{then})
$$
If the above condition is satisfied, then save the transaction pattern to another array (i.e., ArrayPatterns).
In each row of ArrayPatterns[tdvtk, pattern Countk], tdvtk denotes total decimal values of binary digit positions in entire transactions. Feature usage transaction patterns can be derived by taking the binary conversion of the tdvti. And patternCountk gives the count of the number of occurrences of the pattern.
Step 27: For loop iterates from $1^{\text{st}}$ row to last row of the ArrayPatterns[]
Step 28: Read existing tdvt values in the ArrayPatterns[]
Step 30: If the existing tdvt value equals the tdvt value, satisfy the conditions in Step 26, increase the patternCountvalues in the ArrayPatterns by one
$$
ArrayPatterns[tdvtk, patternCountk = patternCountk + 1]
$$
Step 32: If the existing tdvt value does not equal the tdvt value, satisfy the conditions in Step 26, add new row tothe ArrayPatterns
$$
\text{ArrayPatterns} \left[ \mathrm{t d v t} _ {\mathrm{k} + 1} = \mathrm{t d v t} _ {\mathrm{i}}, \text{patternCount} _ {\mathrm{k}} = 1 \right]
$$
Procedure 4: Purposes are generating patterns and their percentages
Step 37: For loop iterates from 1st row to last row of the ArrayPatterns[]
Step 38: Generate distinct transaction patterns by converting $\text{tdvt}_k$ to its binary pattern whose percentage of featureusage in a transaction is greater than or equal to minFUT.
$$
k ^ {t h} \text{Pattern} = C t o B i n a r y (t d v t _ {k})
$$
$k^{th}$ pattern can be realize by considering both CtoBinary $(\mathrm{tdvt_k})$ and the ArrayFeatures[]. CtoBinary $(\mathrm{tdvt_k})$ and the ArrayFeatures[] array have same no of elements. We can identify the pattern by replacing non-zero digits in CtoBinary $(\mathrm{tdvt}_k)$ with the element in the same position of the ArrayFeatures[] and ignoring zeros.
Step 39: Percentage of each distinct usage transaction pattern can be calculated by using the equation,
Percentage of $k^{th}$ pattern = (patternCountk/t) * 100
Step 41: Finally, the overall percentage of transactions whose FUT is greater than or equal to minFUT can becalculated by taking the percentage of summation of the element ArrayPatterns[patternCount $_k$ ]. i.e.
$$
O P T = \left(\sum_ {k = 1} ^ {L} \text{ArrayPatterns} [ \text{patternCount} _ {k} ]\right) \times \frac{1}{t} \times 1 0 0
$$
Where $L =$ No. of patterns $=$ Number of rows in the ArrayPatterns, $t =$ no. of transactions in the dataset
Algorithm – Binary Total for Pattern Mining Algorithm (BTPM Algorithm)
<table><tr><td colspan="2">Algorithm – Binary Total for Pattern Mining Algorithm (BTPM Algorithm)</td></tr><tr><td colspan="2">Input D: = {aij} where i=1 to t (t denotes no of transactions or rows); j=1 to n</td></tr><tr><td colspan="2">(n denotes number of features in each transaction); aijdenotesithfeature ofithtransaction in transactional database.</td></tr><tr><td colspan="2">Input minFUT: Percentage of minimum features usage in a transaction</td></tr><tr><td colspan="2">Output Patterns: Transaction patterns whose each feature usage is greater than or equal to minFUT</td></tr><tr><td colspan="2">Output IPTs: Individual percentage of each transaction (IPT) pattern whose feature usage is greater than or equal to minFUT</td></tr><tr><td colspan="2">Output OPT: Overall percentage of transactions whose individual transactions feature usage is greater than or equal to minFUT</td></tr><tr><td colspan="2">Procedure 1: Generating Feature List</td></tr><tr><td colspan="2">(1) For i=1 to t (t = no of transactions in D)</td></tr><tr><td colspan="2">(2) For j=1 to n (n = no of features inithtransaction in D)</td></tr><tr><td colspan="2">(3) For m=1 to s (s = no of items in ArrayFeatures)</td></tr><tr><td colspan="2">(4) If aij<>ArrayFeature[fim] then</td></tr><tr><td colspan="2">(5) ArrayFeature[fim+1]=aij</td></tr><tr><td colspan="2">(6) End if</td></tr><tr><td colspan="2">(7) Next m</td></tr><tr><td colspan="2">(8) Next j</td></tr><tr><td colspan="2">(9) Next i</td></tr><tr><td colspan="2">Procedure 2: Creating binary incidence matrix format (BIMF) DataSet</td></tr><tr><td colspan="2">(10) Create t x s DataSetBIMF[] with 0 value for each element</td></tr><tr><td colspan="2">(11) For i=1 to t (t = no of transactions in D)</td></tr><tr><td colspan="2">(12) For j=1 to n (n = no of features per transaction in D)</td></tr><tr><td colspan="2">(13) For m=1 to s (s = no of items in ArrayFeatures)</td></tr><tr><td colspan="2">(14) If aij=ArrayFeatures[fim] then</td></tr><tr><td colspan="2">(15) update: ArrayDatasetBIMF[dim=1]</td></tr><tr><td colspan="2">(16) End if</td></tr><tr><td colspan="2">(17) Next m</td></tr><tr><td colspan="2">(18) Next j</td></tr><tr><td colspan="2">(19) Next i</td></tr><tr><td colspan="2">Procedure 3: Saving BIMF dataset (ArrayDatasetBIMF[]) to an Array (ArrayTDVT[]) by creating tdvt and cnb. Selecting and Saving Patterns to ArrayPatterns</td></tr><tr><td colspan="2">(20) Create t x s+2 array names ArrayTDVT [] and create 1 x 2 array names ArrayPatterns []</td></tr><tr><td colspan="2">(21) For i=1 to t (t = no of rows in ArrayDatasetBIMF[])</td></tr><tr><td colspan="2">(22) For j=1 to s+2 (s = no of columns in ArrayDatasetBIMF[])</td></tr><tr><td colspan="2">(23) insert item dij to ArrayTDVT[] on the positionithrow and jthcolumn</td></tr><tr><td colspan="2">(24) Next j</td></tr><tr><td colspan="2">(25) Insert tdvtj=∑j=1s dij2(j-1), cnbj=∑j=1sdij to ArrayTDVT as columns s+1 and s+2 in theithrow</td></tr><tr><td colspan="2">(26) If j = s and cnbj*(100/s) >= minFUT then</td></tr><tr><td colspan="2">(27) For k = 1 to no of rows in ArrayPatterns</td></tr><tr><td colspan="2">(28) Read ArrayPatterns[tdvtk, patternCountk]</td></tr><tr><td colspan="2">(29) If ArrayPatterns[tdvtk] = tdvtj then</td></tr><tr><td colspan="2">(30) ArrayPatterns[tdvtk, patternCountk = patternCountk + 1]</td></tr><tr><td colspan="2">(31) Else</td></tr><tr><td colspan="2">(32) ArrayPatterns[tdvtk+1 = tdvtj, patternCountk = 1]</td></tr><tr><td colspan="2">(33) End if</td></tr></table>
(34) Next k
(35) End if
(36) Next i
Procedure 4: Generating patterns and their percentages
(37) For $k = 1$ to number of rays in ArrayPatterns[tdvt_k_patternCount_k]
(38) $k^{\mathrm{th}}$ Pattern = CtoBinary $(\mathrm{td}v t_{\mathrm{k}})$
(39) IPT of $k^{th}$ pattern = (patternCount $_k$ /t) * 100
(40) Next k
(41) $\mathbf{OPT} = \left(\sum_{k=1}^{L} \text{ArrayPatterns[}\text{patternCount}_k\right) \times \frac{1}{t} \times \mathbf{100}$;
Where $L =$ number of patterns $=$ row count of the ArrayPatterns.
### b) Algorithm Implementation with a Sample
- Fig. 4 depicts the generation of the required dataset by implementing the proposed algorithm to evaluate the applicability of MLFrame. In this example, five features were considered for the transaction database. Moodle tools usage and users tables of the log database of the system were used to create the transaction dataset.
- Step 01: 'Transaction' table is created by copying user ids from the main user table and updating each user id from the tools usage log table in the database of the MLS.
- Step 02: 'ArrayFeatures' table is created by inserting distinct features in the 'Transaction' table. As we use only 5 features, this ArrayFeature table consists of a row with five values.
- Step 03: 'ArrayDatasetBIMF' consists 5 rows (transactions of 5 users) and 6 columns (the first column is for TID-transaction ids and the rest of the rows for features). The array consists of user ids and 5 tools (features) same order with the 'ArrayFeatures' in a particular row.
- Step 04: The table 'ArrayTDVT' is created by adding two columns at the end to the 'ArrayDatasetBIMF'. New columns are 'TDVT,' and 'CNB' represents the decimal value of the binary values in the same row and the count of non-zero binary digits in the same column, respectively.
- Step 05: Different feature usage patterns with frequency are stored in the array called 'ArrayPatterns'. Unique feature usage patterns are selected by satisfying the condition, each pattern's minimum number of features are greater than or equal to the minimum feature usage percentage (minFUT) supplied.
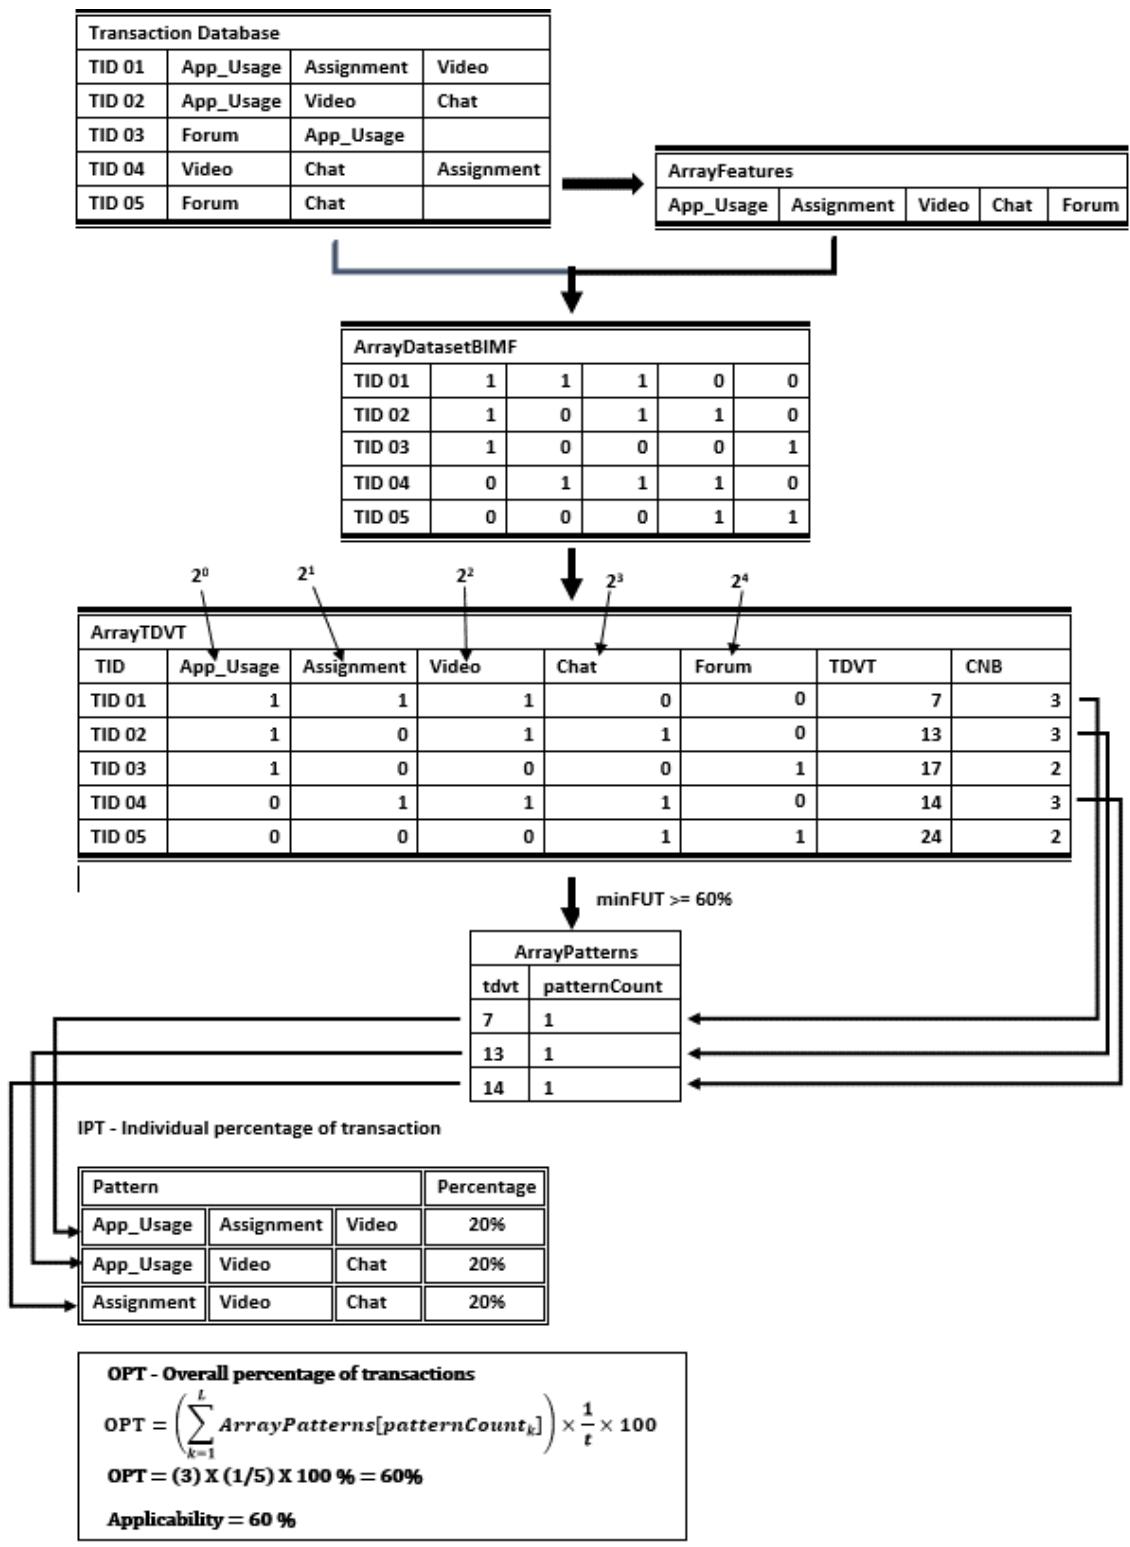 Fig. 4: A Sample Implementation of the Proposed Algorithm
### c) Comparison of Proposed BTPM Algorithm vs. Existing Pattern Mining Algorithms
Popular algorithms for pattern mining such as Apriori and FP-Growth generate itemsets or candidate itemsets to find frequent itemsets. These itemsets are a group of transactional items that reside in the transaction database. Then, they use a minimum threshold value to minimize or prune itemsets to reduce data considered in mining. On the contrary, the BTPM algorithm uses an entirely mathematical technique, i.e., binary incidence matrix format of the transactional database with mathematical calculations. This reason minimizes memory usage and time for searching or traversals. Furthermore, in this method, the minimum
threshold value is used to reduce the transaction dataset simultaneously with the generation of required patterns. These causes reduce the computing load of the process.
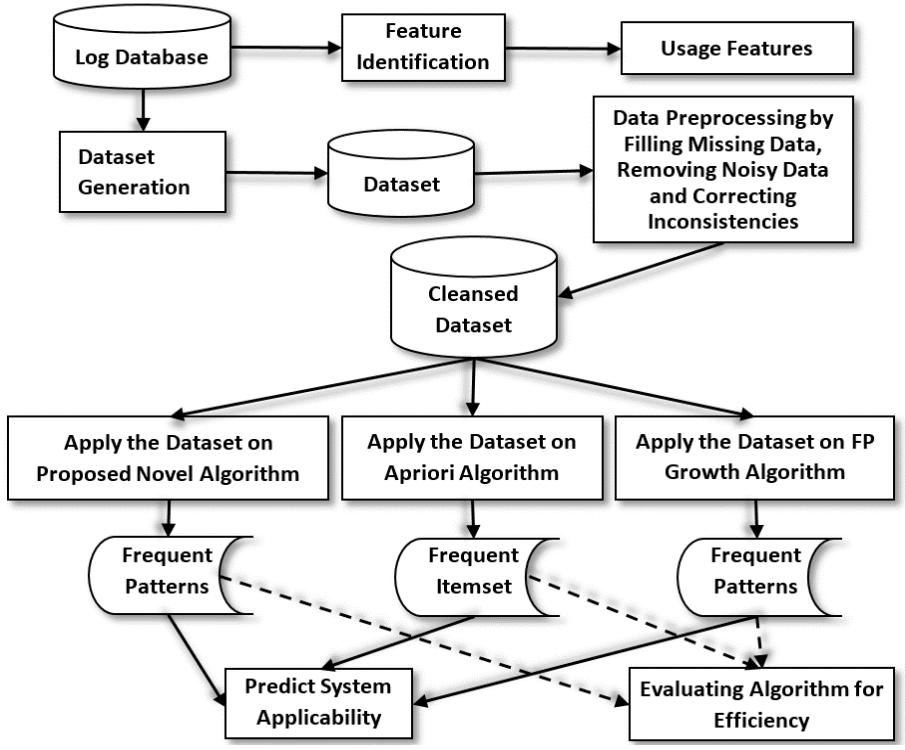
## V. METHODOLOGY
The proposed MLS was given to precisely 1000 users, who are learners and teachers in the University of Kelaniya's four faculties. Among them, 220 students from each faculty of Science and Commerce & Management, and 200 students from each Faculties of Social Sciences and Humanities. Also, 160 teachers participated, and they consisted of 40 teachers in each faculty mentioned above. They were asked to use the system for around 50 days. This study was conducted according to the research framework illustrated in Fig. 5. The standard log file was extracted, and approximately half a million records were identified as different transactions related to the above user group on the given spell. Transactions were categorized into eight transactions with facilities integrated into the proposed ML application, i.e., chat, forum, quiz, assignment, book, video, game, and app_use. The app_use represents general user activities associated with the mobile application, such as page viewing, information modifying and deleting, etc. These activities were classified according to each user (Table 4). Finally, the transaction dataset was generated using the above eight features for all 1000 users. This dataset completed preprocessing steps to be perfect for applying algorithms such as filling in missing data and removing unusual data. This dataset consists of 1000 records, and each record represents different transactions done using the proposed ML app.
The proposed data mining-based novel frequently pattern mining algorithm was primarily implemented using Python programming language to describe the proposed MLS's applicability (Table 1: BTPM Algorithm), and it was applied to the dataset. This algorithm caters to finding patterns of feature usage in transactions and calculating percentages of each different transaction pattern. For instance, what is the percentage of different patterns including all the features considered above (i.e., chat, forum, quiz, assignment, book, video, game, and app_usage), or what are the percentages of different patterns including seven features out of the eight features considered above? Then overall applicability of the system can be predicted by considering these transaction patterns and taking the summation of their percentage values. Next, the Apriori algorithm for associate rule mining and the FP-Growth algorithm for frequent pattern mining were applied on the same dataset and generated the best possible rules which can describe the overall systems' applicability.
Finally, the proposed BTPM algorithm's performance was compared with Apriori and FP-Growth algorithms. For that, a data set with 15000 records were used. The dataset was created by using the original data set multiple times with changing the order of records randomly. Each algorithm's execution times were recorded by changing number of execution records (i.e. 2500, 5000, 7500, 10000, 12500, 15000) and percentage of minimum feature usage (supports) $(20\%, 40\%, 60\%, 80\%)$.
 Fig. 5: Research framework
Various activities in the MLS are used as eight features in the transaction dataset. Feature descriptions are mentioned in Table 2.
Table 2: Activity Table
<table><tr><td>Feature</td><td>Type</td><td>Description</td></tr><tr><td>ID No.</td><td>Identification</td><td>Student identification number</td></tr><tr><td>Chat</td><td>Activity</td><td>Chat facility for discussions</td></tr><tr><td>Forum</td><td>Activity</td><td>Forum facility for knowledge sharing</td></tr><tr><td>Quiz</td><td>Activity</td><td>Quiz facility to test learners' knowledge</td></tr><tr><td>Assignment</td><td>Activity</td><td>Assignment for extra academic tasks</td></tr><tr><td>Book</td><td>Activity</td><td>Book-facility for further reading</td></tr><tr><td>Video</td><td>Activity</td><td>Video facility for academic activities</td></tr><tr><td>Game</td><td>Activity</td><td>Game facility for academic activities</td></tr><tr><td>App</td><td>Activities(View/Modify/)</td><td>General activities in the mobile app such as view, modify..</td></tr></table>
## VI. RESULTS AND DISCUSSIONS
### a) Dataset
In this study, we use a data set including 1000 transactional rows of 1000 users. Each transaction row consists of 8 features denoting activity usage in the MLS. The second subprocedure in the proposed algorithm converts the transactional dataset to the BIMF dataset, and part of the BIMF dataset is shown below (Table 3).
Table 3: Converting Transaction Table into BIMF
<table><tr><td>ID</td><td>App_used</td><td>Assignment</td><td>Book</td><td>Chat</td><td>Forum</td><td>Quiz</td><td>Video</td><td>Game</td><td>TDVT</td><td>CNB</td></tr><tr><td>1</td><td>1</td><td>1</td><td>1</td><td>1</td><td>1</td><td>1</td><td>1</td><td>1</td><td>255</td><td>8</td></tr><tr><td>2</td><td>1</td><td>1</td><td>1</td><td>1</td><td>1</td><td>1</td><td>1</td><td>1</td><td>255</td><td>8</td></tr><tr><td>3</td><td>1</td><td>1</td><td>1</td><td>1</td><td>1</td><td>1</td><td>1</td><td>1</td><td>255</td><td>8</td></tr><tr><td>4</td><td>1</td><td>1</td><td>1</td><td>1</td><td>1</td><td>1</td><td>1</td><td>1</td><td>255</td><td>8</td></tr><tr><td>5</td><td>1</td><td>0</td><td>1</td><td>1</td><td>1</td><td>1</td><td>1</td><td>1</td><td>253</td><td>7</td></tr><tr><td>..</td><td>.</td><td>.</td><td>.</td><td>.</td><td>.</td><td>.</td><td>.</td><td>.</td><td>.</td><td>.</td></tr><tr><td>..</td><td>.</td><td>.</td><td>.</td><td>.</td><td>.</td><td>.</td><td>.</td><td>.</td><td>.</td><td>.</td></tr><tr><td>996</td><td>1</td><td>1</td><td>1</td><td>0</td><td>1</td><td>1</td><td>1</td><td>0</td><td>119</td><td>6</td></tr><tr><td>997</td><td>1</td><td>0</td><td>1</td><td>1</td><td>1</td><td>1</td><td>1</td><td>1</td><td>253</td><td>7</td></tr><tr><td>998</td><td>1</td><td>1</td><td>1</td><td>1</td><td>1</td><td>1</td><td>1</td><td>1</td><td>255</td><td>8</td></tr><tr><td>999</td><td>1</td><td>0</td><td>1</td><td>1</td><td>0</td><td>1</td><td>0</td><td>1</td><td>173</td><td>5</td></tr><tr><td>1000</td><td>1</td><td>1</td><td>1</td><td>1</td><td>1</td><td>1</td><td>1</td><td>1</td><td>255</td><td>8</td></tr></table>
### b) Results of the Proposed Novel Frequently Pattern Mining Algorithm
The proposed algorithm was implemented using the Python programming language. The following results were obtained after running the proposed algorithm on the dataset.
Table 4: Results of BTPM Algorithm
<table><tr><td rowspan="2">PNo</td><td></td><td colspan="7">Features (F1to8)</td><td rowspan="2">No. of Features used</td><td rowspan="2">Each rule percentage (%)</td><td rowspan="2">Each rule group percentage (%)</td><td rowspan="2">FUT Percentage (%)</td></tr><tr><td>F1</td><td>F2</td><td>F3</td><td>F4</td><td>F5</td><td>F6</td><td>F7</td><td>F8</td></tr><tr><td>1</td><td>App used</td><td>Assign ment</td><td>Book</td><td>Chat</td><td>Forum</td><td>Quiz</td><td colspan="2">Video Game</td><td>8</td><td>43</td><td>43</td><td></td></tr><tr><td>2</td><td>App used</td><td>Assign ment</td><td>Book</td><td>Chat</td><td>Forum</td><td>Quiz</td><td>Video</td><td>Null</td><td>7</td><td>2</td><td></td><td></td></tr><tr><td>3</td><td>App used</td><td>Assign ment</td><td>Book</td><td>Chat</td><td>Forum</td><td>Quiz</td><td>Null</td><td>Game</td><td>7</td><td>1</td><td></td><td></td></tr><tr><td>4</td><td>App used</td><td>Assign ment</td><td>Book</td><td>Chat</td><td>Forum</td><td>Null</td><td>Video</td><td>Game</td><td>7</td><td>6</td><td></td><td></td></tr><tr><td>5</td><td>App used</td><td>Assign ment</td><td>Book</td><td>Chat</td><td>Null</td><td>Quiz</td><td>Video</td><td>Game</td><td>7</td><td>2</td><td>24</td><td></td></tr><tr><td>6</td><td>App used</td><td>Assign ment</td><td>Book</td><td>Null</td><td>Forum</td><td>Quiz</td><td>Video</td><td>Game</td><td>7</td><td>2</td><td></td><td>82</td></tr><tr><td>7</td><td>App used</td><td>Assign ment</td><td>Null</td><td>Chat</td><td>Forum</td><td>Quiz</td><td>Video</td><td>Game</td><td>7</td><td>3</td><td></td><td></td></tr><tr><td>8</td><td>App used</td><td>Null</td><td>Book</td><td>Chat</td><td>Forum</td><td>Quiz</td><td>Video</td><td>Game</td><td>7</td><td>8</td><td></td><td></td></tr><tr><td>9</td><td>App used</td><td>Null</td><td>Book</td><td>Chat</td><td>Forum</td><td>Null</td><td>Video</td><td>Game</td><td>6</td><td>4</td><td></td><td></td></tr><tr><td>10</td><td>App used</td><td>Null</td><td>Book</td><td>Chat</td><td>Forum</td><td>Quiz</td><td>Null</td><td>Game</td><td>6</td><td>1</td><td></td><td></td></tr><tr><td>11</td><td>App used</td><td>Null</td><td>Null</td><td>Chat</td><td>Forum</td><td>Quiz</td><td>Video</td><td>Game</td><td>6</td><td>3</td><td></td><td></td></tr><tr><td>12</td><td>App used</td><td>Assign ment</td><td>Null</td><td>Chat</td><td>Null</td><td>Quiz</td><td>Video</td><td>Game</td><td>6</td><td>1</td><td></td><td></td></tr><tr><td>13</td><td>App used</td><td>Assign ment</td><td>Null</td><td>Chat</td><td>Forum</td><td>Null</td><td>Video</td><td>Game</td><td>6</td><td>3</td><td></td><td></td></tr><tr><td>14</td><td>App used</td><td>Assign ment</td><td>Null</td><td>Chat</td><td>Forum</td><td>Quiz</td><td>Null</td><td>Game</td><td>6</td><td>1</td><td></td><td></td></tr><tr><td>15</td><td>App used</td><td>Assign ment</td><td>Null</td><td>Chat</td><td>Forum</td><td>Quiz</td><td>Video</td><td>Null</td><td>6</td><td>1</td><td></td><td></td></tr><tr><td>16</td><td>App used</td><td>Assign ment</td><td>Book</td><td>Null</td><td>Forum</td><td>Quiz</td><td>Video</td><td>Null</td><td>6</td><td>1</td><td></td><td></td></tr></table>
The proposed algorithm gives 16 different patterns of features used in transaction rows. We considered $75\%$ as the minimum threshold value for minimum feature usage in a transaction (6 features out of 8 features) (Table 4). Thus, we ask the proposed algorithm to give different patterns in the dataset, consisting of at least six features out of the eight total features in a single transaction. Results reveal that $43\%$, $24\%$, $15\%$ of transactions have used 8, 7, and 6 features consecutively. Therefore $82\%$ of transactions have used at least six features ( $75\%$ of features). Hence, we can predict that the system's applicability is $82\%$ when the minimum threshold feature usage in a transaction is $75\%$.
### c) Results of the Apriori Algorithm
Table 5: Results of the Apriori Algorithm
<table><tr><td>Rule No.</td><td colspan="2">Antecedent</td><td>Consequent</td><td>Support (%)</td><td>Confidence (%)</td><td>Lift</td></tr><tr><td>1</td><td>App_used</td><td>Assignment</td><td></td><td>71</td><td>71</td><td>1.0</td></tr><tr><td>2</td><td>App_used</td><td>Quiz</td><td></td><td>72</td><td>72</td><td>1.0</td></tr><tr><td>3</td><td>App_used</td><td>Forum</td><td></td><td>92</td><td>92</td><td>1.0</td></tr><tr><td>4</td><td>App_used</td><td>Game</td><td></td><td>85</td><td>85</td><td>1.0</td></tr><tr><td>5</td><td>App_used</td><td>Book, Forum</td><td></td><td>73</td><td>73</td><td>1.0</td></tr><tr><td>6</td><td>App_used</td><td>Game, Chat</td><td></td><td>82</td><td>82</td><td>1.0</td></tr><tr><td>7</td><td>App_used</td><td>Chat, Video</td><td></td><td>82</td><td>82</td><td>1.0</td></tr><tr><td>8</td><td>App_used</td><td>Forum, Chat, Video</td><td></td><td>79</td><td>79</td><td>1.0</td></tr><tr><td>9</td><td>App_used</td><td>Game, Chat, Video</td><td></td><td>74</td><td>74</td><td>1.0</td></tr></table>
The authors use values $40\%$, $40\%$, and 1.0 for Apriori parameters, i.e., support, confidence, and lift, respectively to build the Apriori model Using these parameters 267 rules were generated. We chose these values to get 8-itemset combinations. Therefore, according to the 15th rule mentioned in table 05, support, confidence, and lift of 8-itemset are matched with the above minimum parameter values. Otherwise, we were unable to obtain 8-itemset combinations. Fifteen specific rules were selected whose antecedent is the app_used feature. Since all the users use the app_used feature, the support of the app_used feature is $100\%$. Therefore, we can assume that the maximum feature usage in transactions comes for an itemset whose antecedent is App_USAGE. According to the Apriori algorithm results (Table 5), rule 15 reveals that its confidence is 43. Rule 15 denotes that $43\%$ of users use the app with seven other features. This indicates that $43\%$ of users used all the considered features in the proposed system. Hence, both the proposed novel algorithm and the Apriori algorithm gave the same output percentage value for eight feature usage in transactions. Similarly, according to the confidence value of rule 14 and rule 13, we can assume that the maximum percentage for the usage of 7 features in transactions is $51\%$, and the maximum percentage for six features usage in transactions is $61\%$. Finally, using the Apriori algorithm results, we can assume that the proposed system's overall applicability should be greater than $61\%$ when at least 6 features are used in a transaction.
### d) Results of the FP-Growth algorithm
FP-Growth algorithm gives the following patterns as frequent patterns for the above dataset with $40\%$ as both minimum threshold values for support and confidence parameters.
Table 6: Results of the FP-Growth Algorithm
<table><tr><td>Pattern description</td><td>Min. support</td><td>Min. confidence</td><td>Number of patterns</td></tr><tr><td>7-itemset (7 feature items patterns)</td><td>40%</td><td>40%</td><td>8</td></tr><tr><td>6-itemset (6 feature items patterns)</td><td>40%</td><td>40%</td><td>28</td></tr><tr><td>6-itemset (6 feature items patterns)</td><td>50%</td><td>40%</td><td>28</td></tr><tr><td>6-itemset (6 feature items patterns)</td><td>60%</td><td>40%</td><td>8</td></tr></table>
These results denote that $40\%$ of users use at least seven features among the eight features. Also, $60\%$ of users use at least six features among the eight features. These results secure the $75\%$ usage of the features by $60\%$ of users. Therefore, we can assume that the applicability of the system is not less than $60\%$ when minimum feature usage in a transaction is equal to $75\%$ for the FP-Growth algorithm.
### e) Evaluating the Algorithm
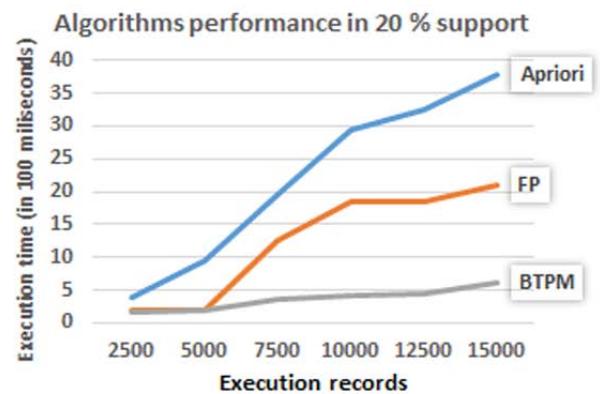
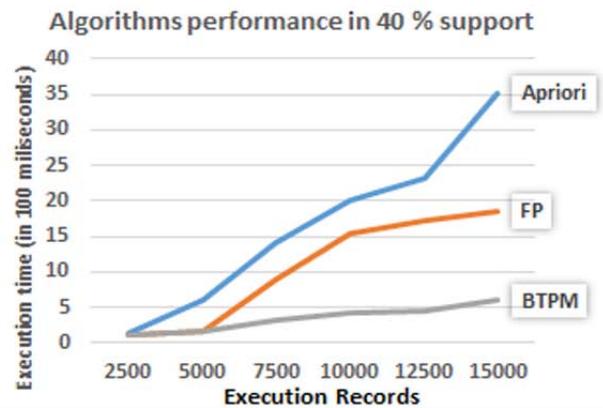
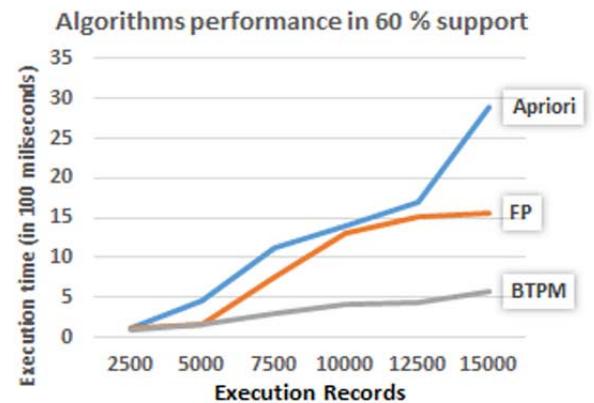
The performance of the proposed algorithm for pattern mining was compared with Apriori and FP-Growth algorithms. The results clearly show the better efficiency of the proposed algorithm. According to the graphs in Fig.6, the proposed algorithm (BTPM) takes less execution time than the Apriori and FP-Growth algorithm for different support thresholds in each size of transactions.
Table 7: Execution Times (in milliseconds) of Apriori, FP Growth, and BTPM Algorithms when Changing the Number of Execution Records in Different Support Thresholds
<table><tr><td rowspan="2">Exec. Records</td><td colspan="3">20% Support</td><td colspan="3">40% Support</td><td colspan="3">60% Support</td><td colspan="3">80% Support</td></tr><tr><td>Apri</td><td>FP</td><td>BTPM</td><td>Apri</td><td>FP</td><td>BTPM</td><td>Apri</td><td>FP</td><td>BTPM</td><td>Apri</td><td>FP</td><td>BTPM</td></tr><tr><td>2500</td><td>387</td><td>195</td><td>161</td><td>141</td><td>121</td><td>110</td><td>118</td><td>113</td><td>101</td><td>117</td><td>103</td><td>92</td></tr><tr><td>5000</td><td>961</td><td>202</td><td>189</td><td>617</td><td>176</td><td>171</td><td>450</td><td>161</td><td>155</td><td>345</td><td>148</td><td>137</td></tr><tr><td>7500</td><td>1969</td><td>1255</td><td>349</td><td>1417</td><td>899</td><td>320</td><td>1117</td><td>750</td><td>305</td><td>917</td><td>559</td><td>291</td></tr><tr><td>10000</td><td>2946</td><td>1846</td><td>431</td><td>2014</td><td>1532</td><td>420</td><td>1403</td><td>1316</td><td>413</td><td>994</td><td>869</td><td>407</td></tr><tr><td>12500</td><td>3255</td><td>1850</td><td>454</td><td>2314</td><td>1714</td><td>445</td><td>1706</td><td>1505</td><td>431</td><td>1393</td><td>1110</td><td>410</td></tr><tr><td>15000</td><td>3779</td><td>2107</td><td>618</td><td>3513</td><td>1849</td><td>600</td><td>2889</td><td>1556</td><td>574</td><td>2419</td><td>1399</td><td>564</td></tr></table>
(a)
(b)
(c)
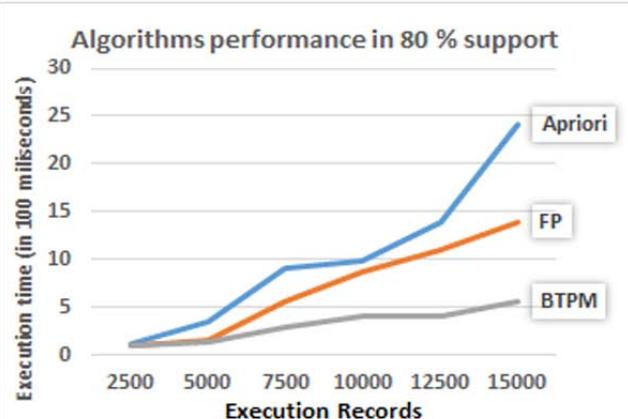
(d) Fig. 6: Algorithm Performance Graphs of Number of Transaction vs Execution time in (a) $20\%$ Support (b) $40\%$ Support (c) $60\%$ Support (d) $80\%$ Support
Reasons for these performances in the proposed algorithm are, it scans the database only once to develop an array of features. Also, the BIMF dataset and mathematical process have quicker processing power in the proposed algorithm. On the contrary, other algorithms considered in this study use techniques to mine frequent patterns such as scans database iteratively, creating candidate itemsets, and a frequent pattern tree. However, if our proposed algorithm uses the BIMF dataset directly, these execution times reduce further.
#### Time complexity of the proposed algorithm
The time complexity of an algorithm is the time estimation to execute the programming code inside the algorithm. It depends on the building blocks or control structures used in the algorithm, such as sequence, selections, and iterations. Further, the situation differs when the input is increasing. It expresses universally using big O notations, for instance, $\mathrm{O}(\mathrm{N})$, $\mathrm{O}(\mathrm{N}^2)$, $\mathrm{O}(\mathrm{N}^3)$, $\mathrm{O}(\mathrm{N}^\circ)$, $\mathrm{O}(2^\mathrm{N})$, $\mathrm{O}(\mathrm{N}\log \mathrm{N})$, $\mathrm{O}(\log \log \mathrm{N})$, $\mathrm{O}(\log^2\mathrm{N})$. Here N means the number of run times. Typically, loops run equal to their ending number times while a single statement runs only once[32]. The time complexity of
Table 8: The Time Complexity Evaluation of BTPM Algorithm
<table><tr><td>Component</td><td>Description</td><td>Complexity</td></tr><tr><td rowspan="2">Procedure 1</td><td rowspan="2">Three nested iterations and an inner if statement with an assignment statement. But innermost iteration considers a low number of transactions well below N.</td><td>O(N*N*M+1+1), M is very close to 1 and very low to N</td></tr><tr><td>~ O(N2)</td></tr><tr><td rowspan="2">Procedure 2</td><td rowspan="2">Array create a statement, three nested iterations, inner if statement, and inner assignment statement. But innermost iteration considers a very low number of transactions well below to N.</td><td>O(1+N*N*M+1+1) ~ O(N2), M is very close to 1 and very low to N</td></tr><tr><td>~ O(N2)</td></tr><tr><td rowspan="2">Procedure 3</td><td rowspan="2">Two array creating statements, two nested for loops, one inserting statement in the second for loop, two arrays insert statements, inside an if statement another for loop within the first iteration, a read statement and another if statement within the last for loop, last for loop's if the statement has two array assignment statement before and after else part. Last for loop runs very low number of times transaction well below to N.</td><td>O(1+1+(N*(N+1)(1+1+1+M+1+1), M is very close to 1 and very low to N</td></tr><tr><td>~ O(N2)</td></tr><tr><td rowspan="2">Procedure 4</td><td rowspan="2">two assignment statements within a for loop and one outside assignment statement.</td><td>O(N*(1+1)+1)</td></tr><tr><td>~ O(N)</td></tr></table>
According to table 8, the total time complexity is equal to the summation of time complexity of procedure 1, procedure 2, procedure 3, and procedure 4. It is close to $O(N^2)$.
Therefore, the time complexity of the proposed BTPM algorithm is realized approximately as$O(N^2)$. According to previous studies, the Apriori algorithm's time complexity was calculated as $O(N^2)$ for a larger dataset[33]. But Tahiyudin and colleagues (2019) show the time complexity of the Apriori algorithm as $O(2^N)[34]$. Also, the FP-Growth algorithm's time complexity is $O(N \log N)$ for higher data volumes, while in lower datasets, it shows $O(N)$ better performance[35].
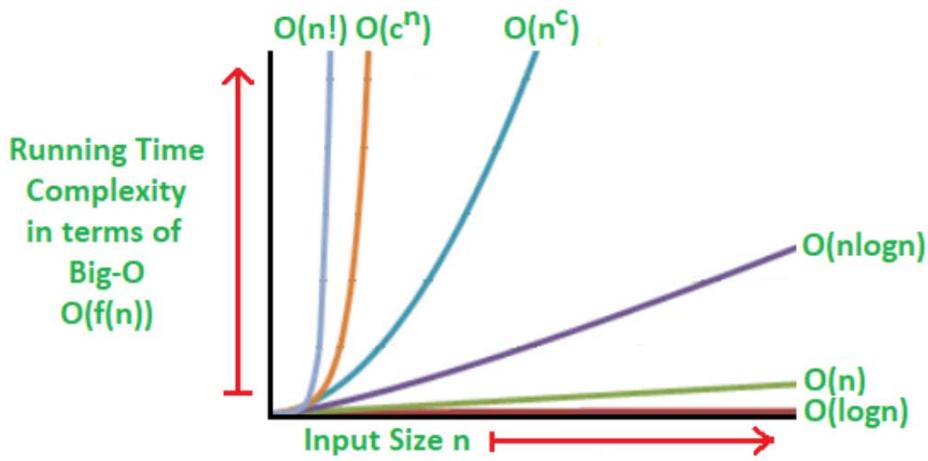 Fig. 7: Big-O Complexity for Different Input Sizes
According to Fig. 7, the proposed BTPM algorithm's time complexity has similar or a little better to the Apriori algorithm for more extensive data volumes. The purpose of creating the BTPM algorithm is to evaluate the proposed algorithm for applicability. BTPM algorithm provides the applicability of the MLS directly. But when Apriori and FP Growth algorithms are used to evaluate applicability, it requires certain assumptions, as mentioned in 6.3 and 6.4.
## VII. CONCLUSION AND IMPLICATION
This study's primary purpose is to check whether the proposed MLF for higher education is applicable for higher education learners and teachers. The framework was implemented via a modified MMLE. This study was carried out using generated MySQL standard system log files integrated with a Moodle learning management system. In this study, the authors used Python programming language implementations of the proposed novel frequent pattern mining algorithm, the Apriori associated rule mining algorithm, and the FP-Growth frequent pattern mining algorithm. Results reveal that the system's applicability is not less than $60\%$ by the FP-Growth algorithm while it should be greater than $61\%$ by the Apriori algorithm.
Meanwhile, our proposed algorithm gives $82\%$ of the system applicability for a $75\%$ threshold as the transaction's minimum features. Finally, we can conclude that the proposed pattern mining algorithm provides accurate and more precise results for evaluating the proposed ML system's applicability compared to the Apriori and FP-Growth algorithms. Meanwhile, in the applicability evaluation of the learning system, the proposed algorithm shows better efficiency than the Apriori and the FP-Growth for different support thresholds in various sizes of transactions. The proposed algorithm also shows the competitive value for the time complexity with the other two algorithms used in this study for larger datasets. However, the proposed novel pattern mining algorithm's efficiency can be improved further by the direct use of the binary incidence matrix format dataset.
Generating HTML Viewer...
References
41 Cites in Article
Gustavo Soad,Nemesio Duarte Filho,Ellen Barbosa (2016). Quality evaluation of mobile learning applications.
Shuhong Wang,John Moss,Janet Hiller (2005). Applicability and transferability of interventions in evidence-based public health.
Michael Rosemann,Iris Vessey (2008). Toward Improving the Relevance of Information Systems Research to Practice: The Role of Applicability Checks1.
S Ventura,J Luna (2016). Pattern mining with evolutionary algorithms.
J Pei,J Han (2000). Mining Frequent patterns without candidate generation.
R Agrawal,R Srikant (1994). Fast algorithms for mining association rules.
Edona Doko,Lejla Abazi Bexheti,Mentor Hamiti,Blerta Prevalla Etemi (2018). Sequential Pattern Mining Model to Identify the Most Important or Difficult Learning Topics via Mobile Technologies.
Magdalena Cantabella,Raquel Martínez-España,Belén Ayuso,Juan Yáñez,Andrés Muñoz (2019). Analysis of student behavior in learning management systems through a Big Data framework.
Karim Dahdouh,Lahcen Oughdir,Ahmed Dakkak,Abdelali Ibriz (2019). Smart Courses Recommender System for Online Learning Platform.
V Budak,Ç Erol (2018). Navigation Behavior Analysis of Users on A Distance Education Website: KLUDEC Sample.
Y Wu,J Zhang (2019). Building the electronic evidence analysis model based on association rule mining and FP-growth algorithm.
Pornthep Rojanavasu (2019). Educational Data Analytics using Association Rule Mining and Classification.
Tosporn Arreeras,Mikiharu Arimura,Takumi Asada,Saharat Arreeras (2019). Association Rule Mining Tourist-Attractive Destinations for the Sustainable Development of a Large Tourism Area in Hokkaido Using Wi-Fi Tracking Data.
Nureni Azeez,Tolulope Ayemobola,Sanjay Misra,Rytis Maskeliūnas,Robertas Damaševičius (2019). Network Intrusion Detection with a Hashing Based Apriori Algorithm Using Hadoop MapReduce.
Shadi Alzu'bi,Bilal Hawashin,Mohammad Eibes,Mahmoud Al-Ayyoub (2018). A Novel Recommender System Based on Apriori Algorithm for Requirements Engineering.
N Dharshinni,Fadhillah Azmi,I Fawwaz,A Husein,Saut Siregar (2019). Analysis of Accuracy K-Means and Apriori Algorithms for Patient Data Clusters.
Xueling Wu,F Benjamin Zhan,Kaixiang Zhang,Qinglu Deng (2016). Application of a two-step cluster analysis and the Apriori algorithm to classify the deformation states of two typical colluvial landslides in the Three Gorges, China.
A Belhadi,Y Djenouri,J Lin,A Cano (2020). A general-purpose distributed pattern mining system.
A Ikhwan,M Yetri,Y Syahra,J Halim,A Siahaan,S Aryza,Y Yacob (2018). A Novelty of Data Mining for Promoting Education based on FP-Growth Algorithm.
C.-S Wang,S.-L Lin (2019). How Instructors Evaluate an e-Learning System? An Evaluation Model Combining Fuzzy AHP with Association Rule Mining.
Maocai Cheng,Kaiyong Xu,Xuerong Gong (2016). Research on audit log association rule mining based on improved Apriori algorithm.
Zhang Jie,W Gang (2019). Intelligence Data Mining Based on Improved Apriori Algorithm.
M Mirmozaffari,A Alinezhad,A Gilanpour (2017). Data Mining Apriori Algorithm for Heart Disease Prediction.
D Halvoník,J Kapusta (2020). Framework for E-Learning Materials Optimization.
Mykhailo Sherman,Halyna Popova,Alona Yurzhenko (2019). RESEARCH ON THE DEVELOPMENT OF PROFESSIONAL NAVIGATIONAL COMPETENCE OF FUTURE SHIP NAVIGATORS BY MIXED REALITY SIMULATION TECHNOLOGIES.
Ioannis Karagiannis,Maya Satratzemi (2017). Enhancing Adaptivity in Moodle: Framework and Evaluation Study.
D Dolawattha,H Salinda Premadasa,Prasad Jayaweera (2018). Modelling the Learner’s Perspectives on Mobile Learning in Higher Education.
D Dolawattha,Salinda Premadasa,Prasad Jayaweera (2019). The Influence on Mobile Learning: Mobile Learning Contents, Higher Education Institutes, and Communication Technology.
J Suresh,T Ramanjaneyulu (2013). Mining Frequent Itemsets Using Apriori Algorithm.
S Nasreen,M Azam,K Shehzad,U Naeem,M Ghazanfar (2014). Frequent Pattern Mining Algorithms for Finding Associated Frequent Patterns for Data Streams: A Survey.
R Balakrishnan,S Sridharan (2020). Discrete mathematics.
Jeff Heaton (2016). Comparing dataset characteristics that favor the Apriori, Eclat or FP-Growth frequent itemset mining algorithms.
I Tahyudin,H Haviluddin,H Nanbo (2019). Time complexity of Apriori and evolutionary algorithm For numerical association rule mining optimization.
H Anand,S Vinodchandra (2016). Association rule mining using treap.
M Dunham (2006). Advanced Topics.
G Buehrer,S Parthasarathy,A Ghoting (2006). Outof-Core Frequent Pattern Mi ni ng on a C ommodi ty PC.
Sadiq Hussain,Neama Abdulaziz Dahan,Fadl Ba-Alwi,Najoua Ribata (2018). Educational Data Mining and Analysis of Students’ Academic Performance Using WEKA.
C Zhang,Y Zu (2019). An Efficient Parallel High Utility Sequential Pattern Mining Algorithm.
Xiuli Yuan (2017). An improved Apriori algorithm for mining association rules.
P Gaikwad,S Kamble,N Thakur,A Patharkar (2017). Evaluation of Apriori Algorithm on Retail Market Transactional Database to get Frequent Itemsets.
No ethics committee approval was required for this article type.
Data Availability
Not applicable for this article.
How to Cite This Article
D.D.M. Dolawattha. 2026. \u201cA Novel Frequent Pattern Mining Algorithm for Evaluating Applicability of a Mobile Learning Framework\u201d. Global Journal of Computer Science and Technology - C: Software & Data Engineering GJCST-C Volume 23 (GJCST Volume 23 Issue C2).
Explore published articles in an immersive Augmented Reality environment. Our platform converts research papers into interactive 3D books, allowing readers to view and interact with content using AR and VR compatible devices.
Your published article is automatically converted into a realistic 3D book. Flip through pages and read research papers in a more engaging and interactive format.
Our website is actively being updated, and changes may occur frequently. Please clear your browser cache if needed. For feedback or error reporting, please email [email protected]
Thank you for connecting with us. We will respond to you shortly.