
I. INTRODUCTION
The goal of this paper was to produce predictions regarding the future stock price of the massive corporation Apple Inc. by using statistical models.
models. The Information Technology (IT) sector comprises six distinct industries, among which Apple Inc., which is a large-cap company has been the mainstay of my research. Apple Inc. is one of the most valuable companies in the world, with a market capitalization of over $2 trillion. In the study, a predictive model has been devised to estimate the equity price of the Apple Inc. company, employing diverse statistical techniques.
The model can be used by investors and analysts to make informed decisions about investing in Apple Inc. and to predict its future performance.
II. PREVIOUS RESEARCH
Predicting equity prices is a significant issue in financial research, especially in the Information Technology (IT) sector, where businesses such as Apple Inc. hold significant influence. This literature study evaluates current research on constructing statistical models for predicting Apple Inc.'s share price using regression analysis in the IT industry.
The impact of market opinion on the stock returns of Apple Inc., providing an understanding of issues affecting its equity price has been considered in this study [1]. For developing statistical models, especially in financial forecasting, [2] this original textbook offers foundational knowledge on econometrics, including regression analysis. The association between Apple Inc.'s financial performance and its stock price movements, providing perceptions to prospective forecasters for regression analysis has been demonstrated in this study [3]. This study [4] combined regression modeling to forecast changes in the company's stock price based on company performance metrics and its financial data. Regression analysis has been applied in this empirical study [5] to explore the relationship between several financial variables and Apple Inc. stock returns. By concentrating on challenges associated with regression analysis, such as multicollinearity and model overfitting a comprehensive guide has been provided this paper [6]. This review [7] explores the use of sentiment analysis of social platforms like Twitter data to predict stock prices, offering potential further predictors for regression analysis. This study [8] provides on the parameters that
affect volatility and stock returns, which may assist in determining which variables should be considered in a regression analysis. Tsay's book [9] provides sophisticated approaches for evaluating financial time series data, including methods relevant to regression analysis for predicting equities prices. Not only emphasizing Apple Inc., but this research paper also predicted the trend pattern by using machine learning techniques such as Support Vector Machine (SVM) that could be perfect for regression analysis in forecasting equity prices [10].
III. METHODOLOGY
The data has been taken from FactSet-2022 and it is time series data. The data is secondary data and
there were 23 observations in the dataset. Generally, several statistical techniques have been used in this research project. For graphical techniques, histograms, scatter plots, line plots, and as analytical methods, three types of statistical tools have been used. I have used descriptive statistics for scalable variables (Price, EPS, BVPS, CR, DTA, EBIT, SPS) and to measure the linear association, I have used correlation, and finally to predict the model regression analysis. I have stated R as the scripting language.
The functional specification, population regression equation, and sample regression equation have been shown in the following Eqns. 1, 2 and 3.
Eqn. 1 Price (BVPS, EBIT, SPS)
Eqn. 2
Eqn. 3
In the above multiple regression equations, price is the dependent variable which was hypothesized to be a positive function on independent variables respectively book value per share (BVPS), earnings before interest and taxes (EBIT) and sell per share(SPS).
IV. RESULTS
For graphical analysis, a histogram (fig.1), scatter plot (fig.2), and line-plot (fig.3) have been developed for all dependent and independent variables.
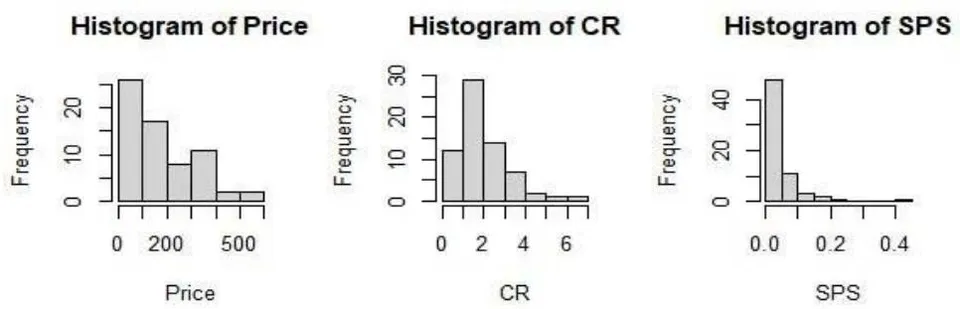
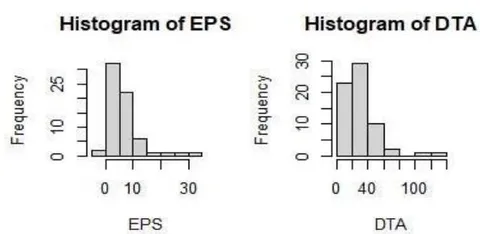
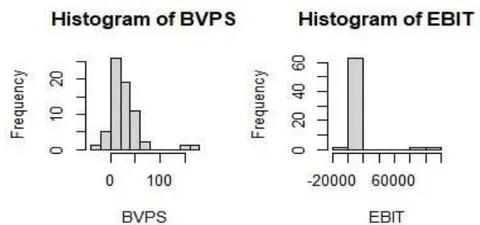
From fig.1 we can see that the histogram of is skewed to the right BVPS, and EBIT's histogram is Price, EPS, CR, SPS, DTA are positively skewed which relatively symmetric.
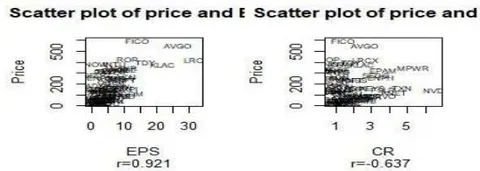
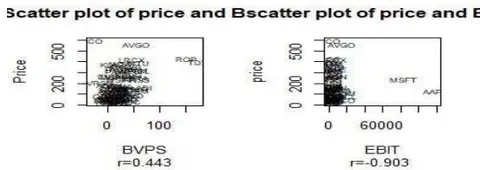
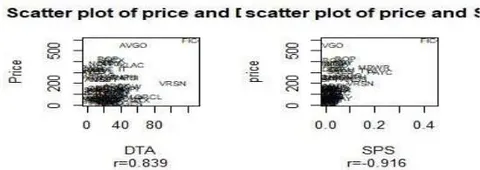
The scatter plot of dependent and independent variables is shown in fig. 2. Price and EPS are positively correlated ( ) with very strong linear association. Whereas price and CR ( ) show a negative but moderate linear relation. The Price-BVPS scatterplot
suggests a positive correlation . While price and EBIT shows a negative but strong linear relation. Price-DTA scatterplot and Price-SPS scatterplot show strong positive linear associations.
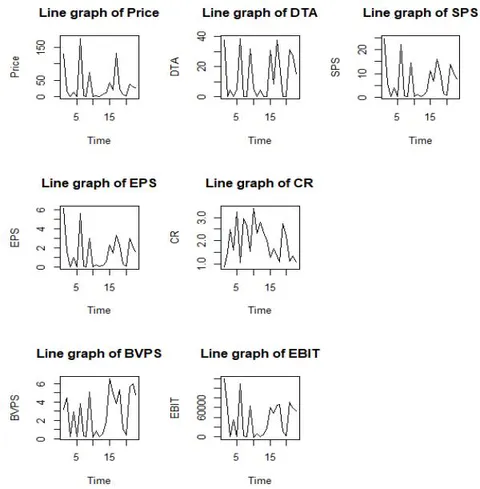
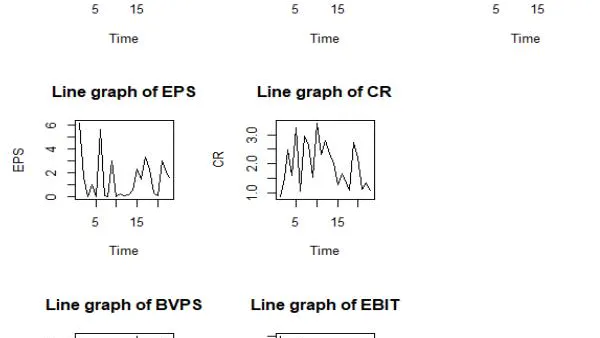
The line graph in fig. 3 shows the trend of Price, EPS, BVPS, DTA, CR, EBIT and SPS with respect to month. Cyclical positive trend has been seen from the
line graph of Price, EPS, BVPS, DTA, CR, EBIT and SPS. Whereas relatively secular trend with seasonality has been from DTA line graph.
| Name | n | Mean | Median | Std.Dev | Skewness | Kurtosis |
| Price | 23 | 33.43 | 14.46 | 48.89 | 1.72 | 5.22 |
| EPS | 23 | 1.51 | 0.99 | 1.77 | 1.18 | 3.90 |
| BVPS | 23 | 2.73 | 2.94 | 2.29 | 0.16 | 1.44 |
| CR | 23 | 1.95 | 1.68 | 0.77 | 0.32 | 1.81 |
| DTA | 23 | 13.05 | 5.02 | 15.07 | 0.59 | 1.70 |
| EBIT | 23 | 36886.22 | 34494.00 | 36577.37 | 0.59 | 2.44 |
| SPS | 23 | 6.85 | 4.17 | 7.40 | 0.94 | 2.99 |
SPS are positively skewed to the right and Price, EPS, and SPS have extreme values with high kurtosis, whereas others are significantly more peaked than symmetric leptokurtic distributions.
| Price | EPS | BVPS | CR | DTA | EBIT | SPS | |
| Price | 1.000 | 0.921 | 0.443 | 0.637 | 0.839 | 0.837 | 0.916 |
| EPS | 0.921 | 1.000 | 0.643 | -0.801 | 0.832 | 0.971 | 0.993 |
| BVPS | 0.443 | 0.643 | 1.000 | -0.866 | 0.703 | 0.786 | 0.689 |
| CR | -0.637 | -0.801 | -0.866 | 1.000 | -0.725 | -0.893 | -0.820 |
| DTA | 0.839 | 0.892 | 0.703 | -0.725 | 1.000 | 0.864 | 0.929 |
| EBIT | 0.837 | 0.971 | 0.786 | -0.893 | 0.864 | 1.000 | 0.970 |
| SPS | 0.916 | 0.993 | 0.689 | -0.820 | 0.929 | 0.970 | 1.000 |

Table 2:
Shows the correlation matrix among the variables. Almost all variables showed a positive and strong correlation. Price and SPS show the highest with
while Price and CR indicate the lowest correlation . The correlation coefficients of all variables agreed with the original hypothesis.
| Price | BVPS | SPS | EBIT | |
| t-stat | 0.272 | -2.234* | 4.281*** | -0.798 |
| p-value | 0.788 | 0.038 | 0.000 | 0.435 |
| r(corr.) | 0.443 | 0.916 | 0.837 |
Our hypothesis is, Ho:
The overall equation is significant at level of significance as F statistics is , so we can conclude that, null hypothesis (H0) is rejected. Since the coefficient of determination is , so variation in price is explained by BVPS, SPS and EBIT. For significant test of the regression coefficient individually t-test has been done. SPS and BVPS statistically significant at and levels respectively. Whereas EBIT is not statistically significant.
V. CONCLUSION
The study presents a statistical model for predicting the equity price of Apple Inc. in the Information Technology sector. The Research was successful, and the explanatory power was high. Price has been considered as the response variable concerning explanatory variables BVPS SPS and EBIT. All explanatory variables were significant except DTA. Price was a successful function of the explanatory variables, and all agreed with the hypothesis. The model can be used by investors and analysts to make informed decisions about investing in Apple Inc. and to predict its future performance. The research might be improved by considering adding more variables.