Adsorption Kinetics and Mass Balance Mathematical Model of Monoethanolamine Surface-Modified Palm Shell Activated Carbon for Carbon Dioxide Dynamic Adsorption in Fixed Bed Column
Dynamic adsorption kinetics results indicated that monoethanolamine-carbon dioxide (MEA-CO 2 ) reaction in fixed bed column packed with MEA-impregnated activated carbon (AC) particles is pseudo first order reaction. The controlling step (slow step) of adsorption is the mass transfer of CO 2 molecules form the feed gas bulk stream to the surface of the adsorbent through the boundary layer (external diffusion). A Dubinin-Astakhov and Avrami models showed that adsorption of CO 2 on MEA-impregnated activated carbon particles is homogeneous. The suggested mass balance model exhibited good agreement with the experimental results for both MEA-impregnated and non-impregnated AC, which they show also that there is no difference in adsorption rates between the two adsorption beds.
## I. INTRODUCTION
The removal of carbon dioxide $\left(\mathrm{CO}_{2}\right)$ is significant for oil and gas industry due to its harmful acidic effects on oil and gas pipelines with no added energy value to natural gas [1]. Because of the increasing indications of $\mathrm{CO}_{2}$ implication in global warming [2], capturing $\mathrm{CO}_{2}$ from its emitting sources is becoming a vital topic. Adsorption is offering an effective alternative for $\mathrm{CO}_{2}$ capturing comparing to other capture technologies [3]. There are many types of gas adsorbents; conventional, like, activated carbons, silica gel, ion-exchange resins, zeolites, and mesoporous silicates, activated alumina, metal oxides, and new like, carbon fibers and metal-organic frameworks. [4]. Adsorbent most important feature is adsorbing capacity [5], besides, good adsorbent should be selective and chemically and mechanically durable [6]. AC is cost-effective and adaptable microporous adsorbent [7] and is considered a superb adsorbent due to its high specific surface area, appropriate pore size distribution, diversity of surface chemistry [8]. It's mostly micropore structure were used extensively in liquids and gases systems. The micropores and mesopores of the AC particles were utilized to accommodate the impregnating molecules, which can be attached chemically (grafting) or physically (impregnation) to the AC particles [9]. Impregnation of AC particles with chemicals improves their natural adsorption capability to adsorb gases [10]. Alkanolamines, such as, monoethanolamine (MEA), diethanolamine (DEA), and methyldiethanolamine (MDEA) are very important absorbents for acidic gases in the field of natural gas sweetening and for mitigation the adversity of these gases on environment [11] and they are extensively used in $\mathrm{CO}_{2}$ absorption from different gas sources [12]. MEA, which is a primary amine, has been used intensively to capture $\mathrm{CO}_{2}$ from gas streams and from many various sources due to its fast reaction kinetics with $\mathrm{CO}_{2}$, low coast and thermal stability, as it is more favorable than other alkanolamines [13] [14]. Because of the effectiveness of liquid amine absorption process researchers were encouraged to utilize amines in their solid state for $\mathrm{CO}_{2}$ capture [15]. Adsorption kinetics is essential tool used to evaluate the performance of an adsorbent and to understand the mechanism of adsorption [16] and many researches had included kinetics of batch $\mathrm{CO}_{2}$ adsorption on different adsorbents in their works [17]. They found that the restriction step is the intraparticle diffusion (pore diffusion). On contrary to the findings of this paper where the restrictive step to $\mathrm{CO}_{2}$ adsorption was the film diffusion. In this research, dynamic adsorption experiments were conducted to investigate the adsorption kinetics of MEA-impregnated AC particles packed in adsorption column to adsorb $\mathrm{CO}_{2}$ from gas mixture.
## II. MATERIALS AND METHODOLOGY
### a) Materials
1. Certified analytical reagent monoethanolamine (MEA), $\mathrm{C}_{2} \mathrm{H}_{7} \mathrm{NO}$, molecular weight 61.
2. Commercial palm shell AC was purchased from Bravo Green SDN BHD (Sarawak, Malaysia).
3. Gases
a. Mixture of $15\% \mathrm{CO}_{2}$ with $85\% \mathrm{N}_{2}$.
b. Pure $\mathsf{N}_2$
### b) Methodology
## i. AC Particles Characterization
Granulated palm shell AC particles were physically activated by steam. The mostly micropore particles have total Bet surface area of $838~\mathrm{cm}^2/\mathrm{g}$, while the micropore surface area of that total area is 675 $\mathrm{cm}^2/\mathrm{g}$ and micropore volume is $0.32~\mathrm{cm}^3/\mathrm{g}$.
## ii. AC Beds Perpetration
A household coffee grinder crushed the AC particles. 710 and $500\mu \mathrm{m}$ sieves were employed to characterize the AC particles to the required particle size of $500\mu \mathrm{m}$ (particles passing 710 and stopping on 500 $\mu \mathrm{m}$ sieve).
## iii. Impregnation of AC Samples
Impregnation was carried out by placing $5\mathrm{g}$ of granular AC in a beaker, $2\mathrm{g}$ of MEA added to the beaker with $10\mathrm{g}$ of deionized water as an environmentally friendly medium and to facilitate the impregnation process. The beaker contents were stirred at $500~\mathrm{rpm}$ for 1 hour at room temperature. The final slurry then dried completely in Heraeus Instrument Vacuthermo oven at $70^{\circ}\mathrm{C}$ under 0.1 bar vacuum pressure (absolute) for 6 hours. Samples of AC particles prepared for $\mathrm{CO}_{2}$ adsorption separation experiments are, non-impregnated AC particles and MEA-impregnated AC particles.
## iv. Working Breakthrough Time
Working breakthrough time was utilized as a method to evaluate the performance of AC beds.
Breakthrough time can be defined as the time spanning from the beginning of the adsorption experiment to the point when $\mathrm{CO}_{2}$ molecules start to break through out of the adsorption column, which was monitored by Guardian Plus $\mathrm{CO}_{2}$ monitor. Data Acquisition Logger was connected to the $\mathrm{CO}_{2}$ monitor to measure the breakthrough time in minutes.
Experimental setup is presented in another work [18].
## v. Amine- $\mathrm{CO}_{2}$ Reactions
Amines remove $\mathrm{CO}_{2}$ in a two-step process:
1. The gas absorbs by the liquid forming a weak acid.
2. The weak acid reacts with amines as a weak base [19].
The suggested [20] reaction path of primary and secondary unhindered amines with $\mathrm{CO}_{2}$ is known as the carbamate formation reaction proceeds through the formation of zwitterion, which was recognized as the reaction mechanism [21].
The first step of the reaction is the formation of amine- $\mathrm{CO}_{2}$ zwitterion as shown in Equation 1a:
$$
\mathrm{C O} _ {2} + \mathrm{R} _ {1} \mathrm{R} _ {2} \mathrm{N H} \leftrightarrow \mathrm{R} _ {1} \mathrm{R} _ {2} \mathrm{N} ^ {+} \mathrm{H C O O} ^ {-} (\text{Zwitterion}) \tag{1a}
$$
The second step is the deprotonation of the zwitterion. For liquid amine reaction, the water would act as a base acquiring the proton released by the zwitterions. In the case of solid amine reaction, another amine molecule would acquire the released proton as the maximum theoretical amount of $\mathrm{CO}_{2}$ reacting with amine would be $0.5\mathrm{mol}\mathrm{CO}_{2} / 1\mathrm{mol}\mathrm{N}_{2}$ as shown in equation 1. In this step, the zwitterion would be stabilized by producing carbamate as in equation 1b.
$$
R _ {1} R _ {2} N ^ {+} H C O O ^ {-} + R _ {1} R _ {2} N H \leftrightarrow R _ {1} R _ {2} N C O O ^ {-} (C a r b a m a t e) + R _ {1} R _ {2} N H _ {2} ^ {+} \tag {1b}
$$
The overall reaction is as in equation 1:
$$
\mathrm {C O} _ {2} + 2 \mathrm {R} _ {1} \mathrm {R} _ {2} \mathrm {N H} \leftrightarrow \mathrm {R} _ {1} \mathrm {R} _ {2} \mathrm {N H} _ {2} ^ {+} + \mathrm {R} _ {1} \mathrm {R} _ {2} \mathrm {N C O O} ^ {-} \tag {1}
$$
## vi. Rate and Mechanism of Adsorption
To investigate the rate of adsorption two equations were explored namely, pseudo first order (SFO) and pseudo second order (PSO) equations. The mechanism of adsorption and the adsorption controlling step was determined by Weber-Morris intraparticle diffusion model.
## III. RESULTS AND DISCUSSIONS
### a) Impacts of MEA Surface-Modification on AC Particles
MEA molecules occupied the pores of the mostly micropore AC particles and blocked them, reducing significantly the micropore surface area from 675 to $36\mathrm{m}^2/\mathrm{g}$ (96%) and micropore volume from 0.32 to $0.02\mathrm{cm}^3/\mathrm{g}$ (94%). MEA-blocked AC particles adsorb selectively more $\mathrm{CO}_{2}$ comparing to non-impregnated AC particles by $172\%$, as the adsorption capacity increased from 49 to $18 \, \text{mg/g}$, respectively.
### b) Adsorption Kinetics
## i. Adsorption Rate
Pseudo first and second order models were investigated to find out which model is predicting the adsorption rate appropriately.
a. Pseudo First Order Model (SFO)
Lagergren [22] published his SFO model to describe homogenous adsorption on solid phase as in equation 2. The equation depends on the adsorption capacity of an adsorption bed rather than concentration of adsorbate as in the case of first order model equation and the adsorption rate is related to the availability of adsorption sites [23]. It had been reported that SFO model can be applied adequately for the adsorption kinetics of $\mathrm{CO}_{2}$ on AC [24].
$$
\frac {d q _ {t}}{d t} = k _ {1} \left(q _ {e} - q _ {t}\right) \tag {2}
$$
The linear form of equation 1 is as in equation 3:
$$
\ln \left(q _ {e} - q _ {t}\right) = \ln q _ {e} - \frac {k _ {1}}{2 . 3 0 3} t \tag {3}
$$
Where,
$q_{e}$: Adsorption capacity at equilibrium, mg/g.
q: Adsorption capacity at any time t, mg/g.
$k_{1}$: Pseudo-first order rate constant, 1/min.
t: Time, min.
Figure 1 is a plot of $\ln (q_{\mathrm{e}} - q_{\mathrm{t}})$ against $t$ for the whole adsorption experiment showing that the straight line fitting the experimental results has good value of $R^2$ equal to 0.9967, which is suggesting that the SFO kinetic model is applicable for this research. The slope of the straight line from equation 3 is $(\frac{k_1}{2.303})$, where the value of the SFO rate $(k_{1})$ was found to be 0.00552721/min.
 Figure 1: Plot of In
$(q_{\mathrm{e}} - q_{\mathrm{t}})$ against time
### b. Pseudo Second Order Model (PSO)
PSO model is usually applied for chemisorption kinetics sorption of liquid solutions [25], the model is in equation 4 and its linear form is as in equation 5:
$$
\frac {d q _ {t}}{d t} = k \left(q _ {e} - q _ {t}\right) ^ {2} \tag {4}
$$
$$
\frac{t}{q} = \frac{1}{k^{2} q_{e}^{2}} + \frac{1}{q_{e}} t
$$
The plot of $t / q$ against $t$ for PSO model as in equation 5, didn't yield straight line for the whole experimental data or even for any of its portions on contrary to the straight line of plot in $(q_{\mathrm{e}} - q_{\mathrm{t}})$ against $t$ for PFO model, which covers the whole experimental data and suggesting that the adsorption rate here is following PFO model which would be applied to calculate adsorption rate constant $(k_{1})$.
## ii. Verification the Rate-Determining Step of the MEA-Impregnated AC Adsorption Bed
Equation 6 is the intraparticle diffusion equation [26],
$$
q _ {t} = k _ {p} t ^ {\frac {1}{2}} + c \tag {6}
$$
Where:
q: Amount of adsorbate absorbed at any time, mg g $^{-1}$.
k_p: Intraparticle diffusion rate constant, mg g $^{-1}$ min $^{-1/2}$.
t: Time, min.
c:Intercept, mg g-1
The multilinearity displayed in Figure 2, the plot of the amount of $\mathrm{CO}_{2}$ adsorbed $(q_{t})$ against the square root of time $(t^{1/2})$ is suggesting that more than one step is taking place. The straight line fitting the curve is not passing through the origin, indicating that the intraparticle diffusion is not the adsorption rate restrictive step [27]. The curve is divided into three zones where the slope of the linear part indicating the rate of adsorption and the rate controlling step is represented by the linear section with lowest slope value [28]. The first zone is the initial zone where the external diffusion of $\mathrm{CO}_{2}$ molecules through the bulk gas phase is taking place and the slope which is representing the adsorption rate is low. The second zone is the film diffusion where the mass transfer of $\mathrm{CO}_{2}$ molecules is continuing through the $\mathrm{CO}_{2}$ film surrounding the AC particles. The slope of the straight line of the second zone is higher than that of the initial zone but lower than that of the third zone due to the resistance exerted by $\mathrm{CO}_{2}$ gas film, which is indicating that this step combining with the initial zone step are slow and the overall adsorption rate is controlled by mass transfer and film resistances respectively. In the third zone, where the amount of $\mathrm{CO}_{2}$ molecules adsorbed $(q_{t})$
versus $\mathrm{t}^{1/2}$ is displaying a straight line with high slope value indicating that $\mathrm{CO}_{2}$ molecules intraparticle diffusion step is fast, where $\mathrm{CO}_{2}$ molecules adsorption is enhanced by the fast $\mathrm{CO}_{2}$ -MEA reaction. The intercept (c) is an indicator of the thickness of the boundary layer surrounding the MEA-impregnated AC particles. Higher values of intercept suggest that the boundary layer is building up as the value of the c in the initial zone is less than that of zone 1, which is in turn less than that of zone 2 deducing that diffusion through the gas film may be considered as the controlling step [29]. $\mathrm{CO}_{2}$ adsorption in zone 2 is approaching its final stage and the active sites on MEA-impregnated AC particles are not able to adsorb more $\mathrm{CO}_{2}$ molecules.
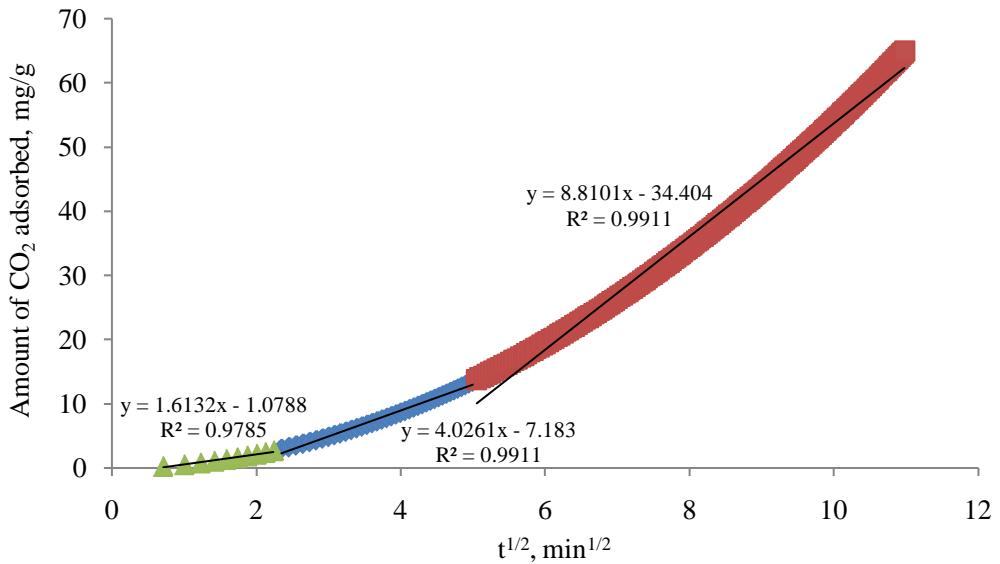
Figure 2: $\mathrm{CO}_{2}$ Amount adsorbed, mg/g against square root of time, min $^{1/2}$
## iii. Gas Film Diffusion Model
The transportation of $\mathrm{CO}_{2}$ molecules from the gas stream bulk to the surface of the AC particles is playing a major role as the analysis of the intraparticle model showed that the mass transfer of $\mathrm{CO}_{2}$ molecules through the gas film is the limiting step of $\mathrm{CO}_{2}$ adsorption. To further inspect that gas film is the limiting step in $\mathrm{CO}_{2}$ molecules adsorption, gas film diffusion model was applied [30], [31] and [32]:
$$
\frac {q _ {t}}{q _ {e}} = 1 - e ^ {k _ {f d} t} \tag {7}
$$
The linearized form of equation 7 is as in equation 8:
$$
\ln (1 - \mathrm {F}) = - k _ {f d} t \tag {8}
$$
Where,
F: Fractional adsorption equilibrium $(\mathrm{F} = q_{\mathrm{t}} / q_{\mathrm{e}})$. $k_{\mathrm{fd}}$: Film diffusion coefficient, $\min^{-1}$.
A plot as in Figure 3 of -In (1 - F) vs t with intercept equal to zero and $R^2$ equal to 0.99 is suggesting that adsorption kinetics is controlled by diffusion through the $\mathrm{CO}_{2}$ gas film surrounding the AC particles.
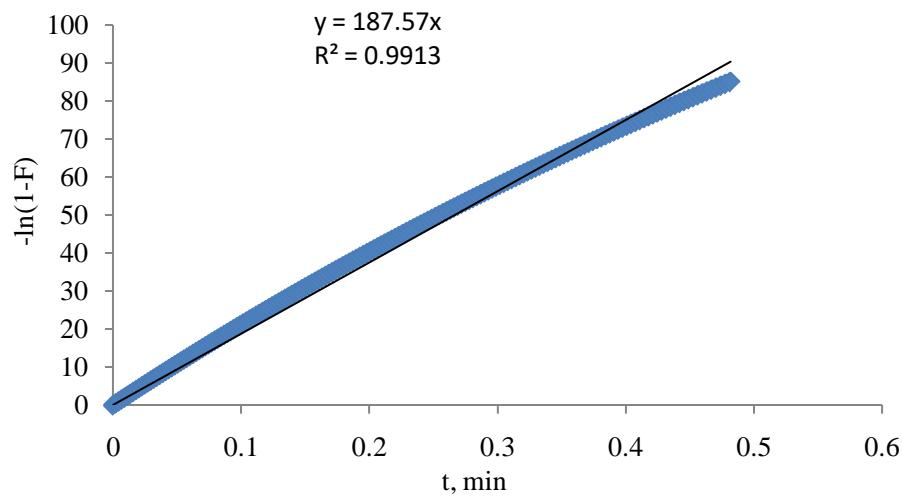 Figure 3: Plot of -In (F-1) against time
## iv. Avrami (JMAK) Model
Johnson-Mehl-Avrami-Kolmogorov (JMKA) model, which is called Avrami model too, is expressed in equation 9, [33] and [34]. Avrami equation describes the growth of crystallites with respect to time. In this work Avrami equation is describing the increasing numbers of $\mathrm{CO}_{2}$ molecules by adsorption inside the AC pores.
$$
\alpha = 1 - \exp \left(- k _ {A v} (t) ^ {n}\right) \tag {9}
$$
Where, $\alpha$ is adsorption fraction at time $t$, $k_{Av}$ is the Avrami kinetic constant, and $n$ is a constant which represents the mechanism of particles adsorption (growth).
The linearized form is as in equation 10:
$$
\ln (- \ln (1 - \alpha)) = n l n k _ {A v} + n l n t \tag {10}
$$
Plotting In $(- \ln (1 - \alpha))$ against In t as in Figure 4 producing straight line $(R^2 = 0.9991)$ with intercept equal to $n \ln k_{\mathrm{Av}}$ and slope equal to n. If Avrami constant n equal to 1. Furthermore the value of Avrami exponent n, which is $1 \leq n \leq 2$ suggesting one dimensional growth of crystallites and that the growth is homogenous [35], which is agreeing with exponent n in micropore filling method of Dubinin-Astakhov (D-A), equation 11 and its linearized form equation 13. D-A equation is applicable for homogeneous carbonaceous adsorbents with micropore structures [36]. It was found in other study [37] that the value of D-A exponent n for MEA-impregnated beds is showing less heterogeneity and more homogeneity with their exponent n value equal to 2, where the value of exponent n in AC is 3 - 1.5. Moving from 3 to 1.5 the microporous system would be getting more heterogeneous [38] and [39].
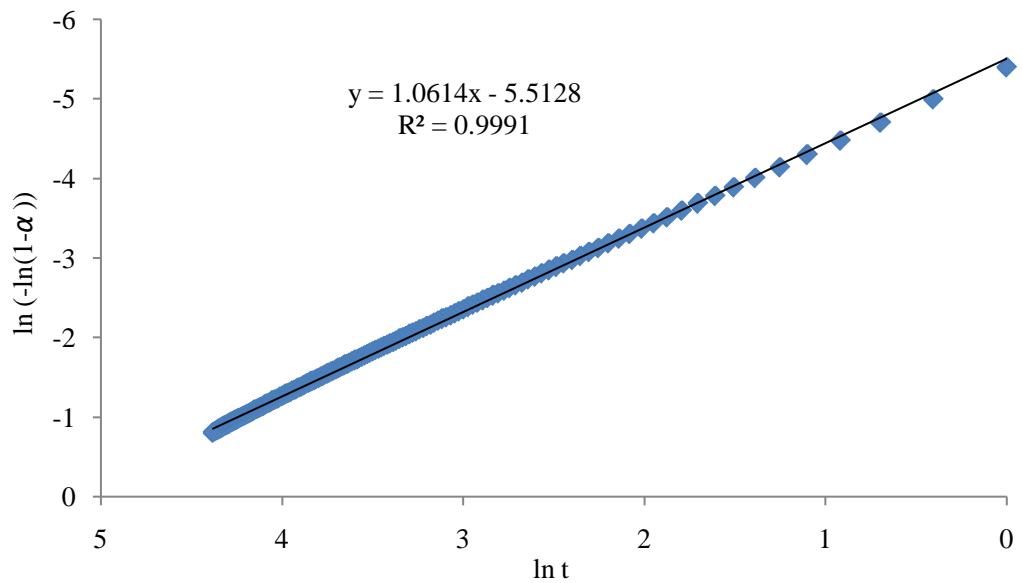 Figure 4: Plot of In (-In (1-α)) against In (t)
### c) Mass Balance Mathematical Modeling
Adsorption of $\mathrm{CO}_{2}$ molecules from feed gas stream containing $15\%$ $\mathrm{CO}_{2}$ and $85\%$ $\mathrm{N}_{2}$ was performed in fixed bed packed column of non-impregnated and MEA-impregnated AC beds. Breakthrough time was employed as real time tool to evaluate the efficiency of the adsorption beds. $\mathrm{CO}_{2}$ monitor was used to display the concentration (\%) of the gas stream exiting the adsorption column. Graphs of $\mathrm{CO}_{2}$ molecules concentration leaving the adsorption column plotted against time were obtained from the data acquisition logger connected to the outlet of the adsorption column.
## i. Mathematical Modeling of MEA-Impregnated 500 $\mu$ m Adsorption Bed To formulate a general mathematical model corresponding to the mainly micropore adsorption mechanism and to cover the two stages mentioned earlier, the following assumptions were made:
1. The system operates under isothermal, isobaric and diabatic conditions.
2. The porosity of the adsorption bed was uniform and constant.
3. The equilibrium of adsorption is a nonlinear isotherm.
4. The velocity distribution is constant across the column diameter.
5. The volumetric flow rate is constant along the column.
Summarizes of the experimental parameters and simulation boundary conditions for the mathematical model validation are in Table 1:
Table 1: Experimental data and simulation boundary conditions
<table><tr><td colspan="3">Operating conditions</td></tr><tr><td>Pressure</td><td>1 atm</td><td></td></tr><tr><td>Temperature</td><td>25°C</td><td></td></tr><tr><td>Inlet concentration</td><td>6.05118E10-6mol/ml</td><td></td></tr><tr><td>Inlet volumetric flow rate</td><td>10 ml/min</td><td></td></tr><tr><td colspan="3">Adsorption column</td></tr><tr><td>Material</td><td>Glass</td><td></td></tr><tr><td>Inside diameter</td><td>1 cm</td><td></td></tr><tr><td>Bed height</td><td>9 cm</td><td></td></tr><tr><td>Bed weight</td><td>5 g</td><td></td></tr><tr><td>Bed Volume</td><td>7.23 cm3</td><td></td></tr><tr><td colspan="3">Adsorbent properties</td></tr><tr><td>Bed type</td><td>Non-impregnated AC</td><td>MEA-impregnated AC</td></tr><tr><td>Particles size</td><td>500 μm</td><td>500 μm</td></tr><tr><td>Micropore surface area</td><td>675 m2/g</td><td>65 m2/g</td></tr><tr><td>Micropore particle porosity</td><td>0.0956 cm3/g</td><td>0.020 cm3/g</td></tr><tr><td>Porosity</td><td>0.684</td><td>0.620</td></tr><tr><td>Bulk density</td><td>1.6387 cm3/g</td><td>1.6228 cm3/g</td></tr><tr><td>Bed Volume</td><td>7.2285 cm3</td><td>6.2857 cm3</td></tr><tr><td>Pseudo 1storder reaction constant (k)</td><td>-</td><td>0.004836 1/min</td></tr></table>
## ii. Mathematical Model of MEA-Impregnated AC Bed
The mathematical model was based on the $\mathrm{CO}_{2}$ molecules breaking through the adsorption bed.
The adsorption of $\mathrm{CO}_{2}$ molecules was declining and more $\mathrm{CO}_{2}$ molecules were exiting the bed.
The general equation of mass balance with first order chemical reaction for $\mathrm{CO}_{2}$ in the feed gas:
Accumulation = Input - Output + Generation As the mass balance would be conducted on $\mathrm{CO}_{2}$ molecules exiting the adsorption bed, the mass balance equation would be:
Output=Input-Accumulation+Generation
$$
v \frac {d c _ {o}}{d t} = q c _ {i} - q c _ {a c c} + v k _ {1} c \tag {14}
$$
Where:
- $K_{1}$: Pseudo first order reaction constant, 1/min.
- $C_i$: Concentration of $\mathrm{CO}_2$ entering the AC bed, mol/ml.
- $\mathrm{C_o}$: Concentration of $\mathrm{CO}_{2}$ exiting the AC bed, mol/ml.
- $C_{\mathrm{acc}}$: Concentration of $\mathrm{CO}_{2}$ accumulated in the AC bed, mol/ml.
Equation 14 is an ordinary first order linear differential equation and the final solution would be as in Equation 15.
$$
C = C _ {-} i + n e ^ {\wedge} \left(- \left(q / v - k _ {-} 1\right) t\right) \tag {15}
$$
Initial boundary condition:
$$
At t = 0, C = 0
$$
$$
n = - C _ {i}
$$
Then equation 15 would be:
$$
C = C _ {-} i - C _ {-} i e ^ {\wedge} (- (q / v - k _ {-} 1) t) \tag {16}
$$
Rearranging equation 16:
$$
C = C _ {i} \left(\frac {q / v}{(q / v) - k _ {1}}\right) \left(1 - e ^ {- \left((q / v) - k _ {1}\right) t}\right) \tag {17}
$$
The simulated results were validated by using the experimental results of the MEA-impregnated activated carbon bed. The simulated results were compared with the experimental data. The simulated data demonstrated a reasonable agreement with the experimental data, as the root mean square error (RMSE) calculated was 6.75915E-06. The simulated and experimental data of MEA-impregnated AC beds were plotted in Figure 5.
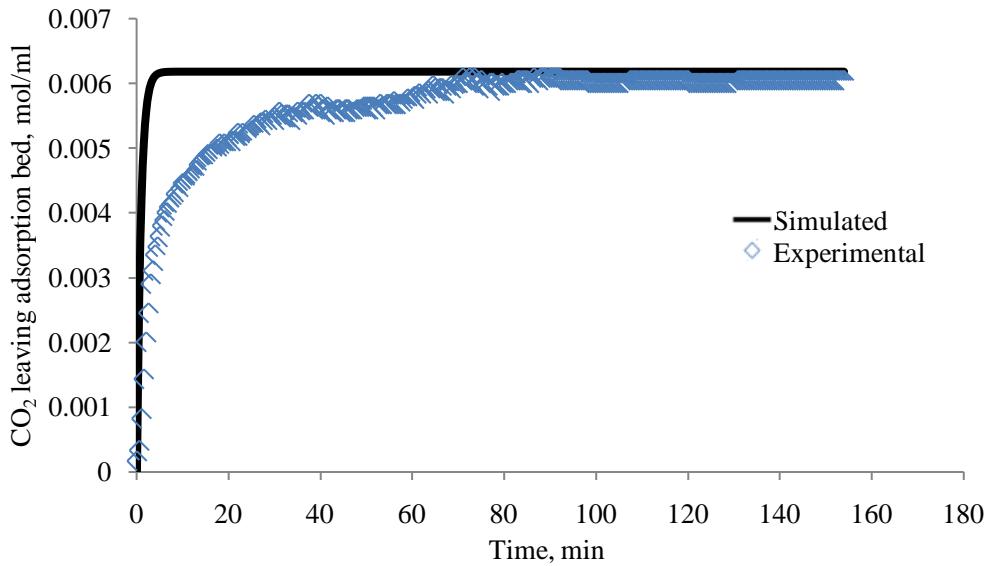 Figure 5: Comparison of
$\mathrm{CO}_{2}$ experimental and simulated breakthrough curves for MEA-impregnated AC bed (Sampled at column outlet)
## IV. CONCLUSIONS
MEA-impregnated AC particles were used to adsorb $\mathrm{CO}_{2}$ from gas mixture. Results are showing that AC particles impregnated with MEA adsorb $\mathrm{CO}_{2}$ molecules in a pseudo first order reaction manner and that the controlling step in this reaction is the mass transfer of $\mathrm{CO}_{2}$ molecules from through the $\mathrm{CO}_{2}$ gas film and not the intraparticle diffusion of $\mathrm{CO}_{2}$ molecules inside the pores of MEA-impregnated AC particles. Due to the homogeneity of the MEA-impregnated activated carbon particles the adsorption of $\mathrm{CO}_{2}$ molecules follows the Avrami model of homogenous crystallites growth. The mass balance mathematical model showed that the experimental and simulated breakthrough curves have good agreement, as the root mean square error (RMSE) was 5.7678E-09 and 3.88532E-09 for non-impregnated and MEA-impregnated beds respectively, which also proved that the adsorption mechanism of both beds is the same.
### ACKNOWLEDGMENT
The authors would like to thank University of Malay for offering the necessary fund for this research through the, University of Malaya Research grant UMRG RP15/2012A.
Generating HTML Viewer...
References
39 Cites in Article
T Rufford,S Smart,G Watson,B Graham,J Boxall,J Diniz Da Costa,E May (2012). The removal of CO2 and N2 from natural gas: A review of conventional and emerging process technologies.
R De_Richtera,T Mingb,S Caillola (2013). Fighting global warming by photocatalytic reduction of CO 2 using giant photocatalytic reactors.
B Youssef,R Serna-Guerrero,A Sayari (2009). Adsorption of CO 2 from dry gases on MCM-41 silica at ambient temperature and high pressure. 1: Pure CO 2 adsorption.
Jian-Rong Li,Yuguang Ma,M Mccarthy,Julian Sculley,Jiamei Yu,Hae-Kwon Jeong,Perla Balbuena,Hong-Cai Zhou (2011). Carbon dioxide capture-related gas adsorption and separation in metal-organic frameworks.
K Knaeble (2002). Adsorbent selection.
Grégorio Crini (2005). Recent developments in polysaccharide-based materials used as adsorbents in wastewater treatment.
K Labus,S Gryglewicz,J Machnikowski (2014). Granular KOH-activated carbons from coal-based cokes and their CO 2 adsorption capacity.
Işılay Ozdemir,Mehmet Şahin,Ramazan Orhan,Mehmet Erdem (2014). Preparation and characterization of activated carbon from grape stalk by zinc chloride activation.
Yan Tang,J Bian,Z Hu,J Liu,H (2012). Carbon Dioxide Capture by Amine-Impregnated Mesocellular-Foam-Containing Template.
Naveen Ramachandran,Ahmed Aboudheir,Raphael Idem,Paitoon Tontiwachwuthikul (2006). Kinetics of the Absorption of CO<sub>2</sub>into Mixed Aqueous Loaded Solutions of Monoethanolamine and Methyldiethanolamine.
Mohamed Aroua,Wan Daud,Chun Yin,Donni Adinata (2008). Adsorption capacities of carbon dioxide, oxygen, nitrogen and methane on carbon molecular basket derived from polyethyleneimine impregnation on microporous palm shell activated carbon.
Cheng-Hsiu Yu,Chih-Hung Huang,Chung-Sung Tan (2012). A Review of CO2 Capture by Absorption and Adsorption.
Yunda Liu,Luzheng Zhang,Suphat Watanasiri (1999). Representing Vapor−Liquid Equilibrium for an Aqueous MEA−CO<sub>2</sub> System Using the Electrolyte Nonrandom-Two-Liquid Model.
Sholeh Ma'mun,Roger Nilsen,Hallvard Svendsen,Olav Juliussen (2005). Solubility of Carbon Dioxide in 30 mass % Monoethanolamine and 50 mass % Methyldiethanolamine Solutions.
Abdelhamid Sayari,Youssef Belmabkhout,Rodrigo Serna-Guerrero (2011). Flue gas treatment via CO2 adsorption.
H Qiu,L Lv,B -C Pan,Q-J Zhang,W-M Zhang,Q-X Zhang (2009). Critical review in adsorption kinetic models.
Mayur Sravanthi Loganathan,Satyannarayana Tikmani,Aakanksha Edubilli,Aloke Mishra,Kumar Ghoshal (2014). CO2 adsorption kinetics on mesoporous silica under wide range of pressure and temperature.
S Khalil,M Aroua,W Daud (2011). Impregnation of commercial palm shell activated carbon with monoethanolamine for adsorbing CO2 from gas mixture.
Monoj Mondal,Hemant Balsora,Prachi Varshney (2012). Progress and trends in CO2 capture/separation technologies: A review.
M Caplow (1968). Kinetics of carbamate formation and breakdown.
R Littel,G Versteeg,W Van Swaaij (1992). Kinetics of CO2 with primary and secondary amines in aqueous solutions—I. Zwitterion deprotonation kinetics for DEA and DIPA in aqueous blends of alkanolamines.
S Lagergren (1898). Dangers Attending So-Called Food Preservatives.
S Loganathan,M Tikmani,S Edubilli,A Mishra,A Ghoshal (2014). CO 2 adsorption kinetics on mesoporous silica under wide range of pressure and temperature.
Zhijuan Zhang,Wei Zhang,Xiao Chen,Qibin Xia,Zhong Li (2010). Adsorption of CO<sub>2</sub>on Zeolite 13X and Activated Carbon with Higher Surface Area.
Y Ho,G Mckay (1998). Sorption of dye from aqueous solution by peat.
Weber Jr,W Morris,J (1963). Kinetics of adsorption on carbon from solution.
W Cheung,Y Szeto,G Mckay (2007). Intraparticle diffusion processes during acid dye adsorption onto chitosan.
W Cheunga,Y Szetob,G Mckaya (2007). Intraparticle diffusion processes during acid dye adsorption onto chitosan.
Hardiljeet Boparai,Meera Joseph,Denis O’carroll (2011). Kinetics and thermodynamics of cadmium ion removal by adsorption onto nano zerovalent iron particles.
G Boyd,A Adamson,L Myers (1947). The Exchange Adsorption of Ions from Aqueous Solutions by Organic Zeolites. II. Kinetics<sup>1</sup>.
Susmita Gupta,Krishna Bhattacharyya (2006). Adsorption of Ni(II) on clays.
M Aroua,S Leonga,L Teoa,C Yin,Mohd Wan,Wan Ashri,Dauda Real-time determination of kinetics of adsorption of lead(II) onto palm shell-based activated carbon using ion selective electrode.
M Avrami (1939). Kinetics of Phase Change. I. General Theory.
C Elaine,Fernanda Lopes,Eunice Dos Anjos,Antonio Vieira,Cestari (2003). An alternative Avrami equation to evaluate kinetic parameters of the interaction of Hg (II) with thin chitosan membranes.
W Christian (1975). Formal Theory of Transformation Kinetics.
M Dubinin (1989). Fundamentals of the theory of adsorption in micropores of carbon adsorbents: characteristics of their adsorption properties and microporous structures.
S Khalil (2018). Effects on Surface Area, Intake Capacity and Regeneration of Impregnated Palm-Shell Activated Carbon with Monoethanolamide and 2-Amino-2-Methyl1-Propanol Equipped for CO 2 Adsorption.
M Dubinin,H Stoeckli (1980). Homogeneous and heterogeneous micropore structures in carbonaceous adsorbents.
A Puziy (1995). Heterogeneity of Synthetic Active Carbons.
No ethics committee approval was required for this article type.
Data Availability
Not applicable for this article.
How to Cite This Article
Saad Hashim Khalil. 2026. \u201cAdsorption Kinetics and Mass Balance Mathematical Model of Monoethanolamine Surface-Modified Palm Shell Activated Carbon for Carbon Dioxide Dynamic Adsorption in Fixed Bed Column\u201d. Global Journal of Research in Engineering - C: Chemical Engineering GJRE-C Volume 23 (GJRE Volume 23 Issue C1).
Explore published articles in an immersive Augmented Reality environment. Our platform converts research papers into interactive 3D books, allowing readers to view and interact with content using AR and VR compatible devices.
Your published article is automatically converted into a realistic 3D book. Flip through pages and read research papers in a more engaging and interactive format.
Our website is actively being updated, and changes may occur frequently. Please clear your browser cache if needed. For feedback or error reporting, please email [email protected]
Thank you for connecting with us. We will respond to you shortly.
Lorem ipsum dolor sit amet, consectetur adipiscing elit. Ut elit tellus, luctus nec ullamcorper mattis, pulvinar dapibus leo.
Adsorption Kinetics and Mass Balance Mathematical Model of Monoethanolamine Surface-Modified Palm Shell Activated Carbon for Carbon Dioxide Dynamic Adsorption in Fixed Bed Column
Saad Hashim Khalil<p>National University of Singapore</p>