
I. IMPETUS
Higher levels of air pollution are a pernicious global problem affecting not only the densely populated countries, but also, countries with sparse populations, as well as regions like Arctic and Antarctica where no population exists. That global pollution is associated with atmospheric and oceanic dynamics and the resulting climate change, with a feedback loop is now accepted and understood. Air quality monitoring therefore involves the systematic collection of physical, chemical, biological, and related data pertaining to ambient air quality, pollution sources, meteorological parameters, and other factors that influence, or are influenced by ambient air quality.
Air pollution may result in huge impacts, causing different effects on human health, on the environment (e.g., ecosystem damage) and on the economy of industrialized and developing countries . For these reasons, air quality monitoring is typically required by national and international regulations to systematically and accurately assess the environmental exposure of the general population to multiple environmental contaminants .
Recent research published in April 2020 by researchers of Harvard University USA; made a startling suggestion that even an increase of level of could lead to a increase in fatality rates due to COVID -19 infections [4]. The Harvard University study amply demonstrates and underlines the urgent necessity and paramount importance of effective ambient air quality monitoring, as air quality or rather the lack of it, directly affects the nations' health, economy and security.
It is imperative therefore, to protect the air we breathe by taking actions to ensure its best possible quality. Measures to ensure good air quality demand accurate and cost effective air quality monitoring.
II. COMPLEXITIES AND CHALLENGES
From a historical perspective, it is imperative to realize that the United States Environmental Protection Agency (US EPA) was one of the first regulatory bodies to worry about air quality and pollution. Starting with the Clean Air Act of 1955 the US EPA has come up with Standards for Measurements (National Ambient Air Quality Measurement Standards – NAAQMS) in 1970 [5, 6], which were followed by the regulatory bodies of other developed and developing countries in Europe (European Union Standards)[7], Australia, Japan [8, 9, 10], World Health Organization, WHO [11, 12] and Asia. India followed suit in 2009 publishing its own standards, by and large culled from the NAAQMS of USEPA and the WHO guidelines [13].
With the advent of new technologies and a better understanding of the Science behind air quality monitoring, US EPA researchers published an important study in the reputed and peer reviewed American Chemical Society Journal in 2013. The study pointed out a number of issues and challenges faced by the existing air quality monitoring methods, the standards practised and concluded that the monitoring methods and practices have seriously jeopardized the quality and sanctity of air quality data.
Subsequently, many scientists and researchers all over the world also concluded that a paradigm shift in air quality monitoring methods and standards is essential by adopting new and emerging technologies. However, neither the regulatory bodies, nor, the industry paid any attention to the growing concerns on the quality of air monitoring systems worldwide.
In 2018, the internationally reputed, peer reviewed Scientific American Journal published startling revelations made by the Centre for Public Integrity in USA, that, for decades the USEPA was complicit in wantonly and systematically under reporting the levels of pollution, taking the general public for a ride. The study pointed out that the hazardous emissions by industries were much larger than reported and documented .
This shocked the world's scientific fraternity and all other stakeholders who realized, rather late, that the situations were similar in their respective countries. Consequently, there was a vociferous demand for a paradigm shift in the policies and attitudes of an otherwise complacent and complicit regulatory authorities for air quality/pollution monitoring.
Following the hue and cry, it is now widely accepted worldwide that proper ambient air quality assessment cannot be accomplished, without addressing the following pertinent questions:
What are the limitations of current measurements, monitoring techniques and the standards currently being employed across the world?
Do the methods of measurements involving synthetic chemicals, themselves result in pollution of air, water and soil?
As the objectives determine the degree of accuracy, sensitivity, method of monitoring and the sampling mechanism – in situ or in-vivo sampling, what are the stated assumptions and objectives of the air quality monitoring?
What is the area for which measurements are representative and reliable?
What is the proper mix and location of fixed stations, moveable stations, airborne stations, and what is the role of modelling in achieving the objectives?
What level or degree of errors are acceptable?
What is the importance of exposure monitoring as related to the pollutants that are air oriented or to those that occur in other media including the food chain?
What related collocated meteorological data must be collected with air quality data?
What is the importance of sample averaging times to the design of monitoring stations and the inferences on air pollution?
What are the effects of physical and chemical transformations at the sampling locations and network design for example, for monitoring ozone or sulphates?
What quality assurance programs are necessary to assure that data are representative and legally and scientifically defensible?
What measures need to be taken for including public participation to ensure non-obfuscation and integrity of data?
Based on the knowledge and insights gained over many decades, the world over, air quality monitoring is now expected to involve a rigorous, systematic and complex approach based on the stated objectives and therefore, should necessarily adopt newer knowledge and innovative technologies after due scientific and technical diligence[16].
III. MEASUREMENT OF AIR QUALITY WITH LOW COST SENSORS
Of late, low-cost air pollution sensors are attracting more and more attention. They offer air pollution monitoring at a lower cost than conventional methods, in theory making air pollution monitoring possible in many more locations. However, at the current stage of development, measurements with low-cost sensors (Electro-Chemical Sensors, Photo Ionization Detectors Optical Particle Counters, Optical Detectors) are often of lower and more questionable data quality than the results from official monitoring stations carried out by pollution monitoring bodies in accordance with international standards and methods . If the quality of the measurements can be improved, low cost solid state sensors could become a game changer in monitoring air pollution, traffic management, personal exposure and health assessment, citizen science and air pollution assessment in developing countries. But unfortunately there are many intrinsic constraints and limitations associated with the existing low cost solid state sensors. Studies have demonstrated that the signals from sensors not only depend on the air pollutant of interest, but also on a combination of several effects, such as other interfering compounds, temperature, humidity, pressure and signal drift (instability of signal). At high concentrations the signal from the air pollutant can be strong, but at ambient air levels the signal is weaker in comparison to the interfering effects and therefore the utility of the low cost solid state sensors would be severely limited for any real world application unless there is a paradigm improvement in the structure and sensing mechanisms of the sensors per se.
IV. STATUS IN INDIA
Interestingly in India, notwithstanding the knowledge regarding the limitations of measurements at fixed locations, and the paradigm shift suggested in the approaches to ambient air quality monitoring methods worldwide, CPCB India and the State Pollution Control Boards, are still refusing to see the woods for the trees by pigheadedly insisting on the questionable measurement methods and standards for the instrumentation -in spite of their two revised guidelines in 2013 and 2018 [18, 19].
| S. No. | Pollutant | Time Weighted Average | Concentration in Ambient Air | Methods of Measurement | Drawbacks | |
| Industrial, Residential, Rural and Other Areas | Ecologically Sensitive Area (Notified by Central Government) | |||||
| (1) | (2) | (3) | (4) | (5) | (6) | (7) |
| 1 | Sulphur Dioxide ( ), | Annual* 24 hours** | 5080 | 2080 | Improved West and Geake Method | Interference of oxides of nitrogen and ozone are well documented — concentrations of interfering oxidants should be less than that of , i.e., up to about 2 ppm. |
| Ultraviolet Fluorescence | This technique is very sensitive but other gaseous components are known to interfere. Quenching (e.g. by or ) of the excited species can lead to an underestimation of the concentration. Positive interference occurs by molecules which absorb radiation and fluoresce in the same region than (e.g. NO and HC) [3]. In exhaust gases, nitric oxide (NO) is usually the main positive interferences, while oxygen is the most important quenching species if water vapor is removed by a Nafion dryer. Filters and selective traps are often used to remove interfering gases. Scrubbers for gases are needed if it is present in high concentrations. Correction for temperature and pressure is made and calibration is made against some primary standard (guidelines). | |||||
| 2 | Nitrogen Dioxide ( ), | Annual* 24 hours** | 4080 | 3080 | Modified Jacob & Hochheiser ( ) - | This method involves the use of Sodium Arsenite, Nitric oxide (NO), Carbon Dioxide ( ) and Sulphur Dioxide ( ) interfere in the testing. |
| Chemiluminescence | Requires elaborate instrumentation and use of various chemicals. Interference from other pollutants like non reactive nitrogen species like and ambient can pose interferences.[Ref: EJ Dunlea et al, Atmos..Chem..Phys., 7, 569-604, 2007 and ibid 2691-2704]. | |||||
| 3 | Particular Matter | Annual* 24 hours** | 60100 | 60100 | Gravimetric | Manual intervention is required and may lead to personal errors. |
| TOEM | Mechanical noise and dramatic temperature fluctuations can interfere with the operation of a TEOM device [1,2]. In addition, water droplets cannot be distinguished from particle mass, so the device must adjust the incoming air temperature to cause water droplets to evaporate, [3] or contain a dryer or humidity sensor to adjust the readings [4]. Under ideal conditions, TEOM is just as accurate as the standard reference method, but its sensitivity presents complications for use for environmental monitoring in urban areas.Ref: [1](WIKIPEDIA, "Tapered element oscillating microbalance". Queensland Department of Environment and Heritage Protection. 2017-03-27. Retrieved 2017-06-28. | |||||
| [2] Gilliam, Joseph H.; Hall, Eric S. (2016-07-13). "Reference and Equivalent Methods Used to Measure National Ambient Air Quality Standards (NAAQS) Criteria Air Pollutants – Volume I". U.S. Environmental Protection Agency. pp. 10, 24, 32. Retrieved 2017-06-28.[3]"Machine-Mounted Continuous Respirable Dust Monitor". NIOSH Technology News. U.S. National Institute for Occupational Safety and Health. July 1997. Retrieved 2017-06-28.[4] Ray, Alison E.; Vaughn, David L. (2009-09-01). "Standard Operating Procedure for the Continuous Measurement of Particulate Matter" (PDF). U.S. Environmental Protection Agency. pp. 1–1, 3-1–3-2, 6-1–6-2. Retrieved 2017-06-28.) | ||||||
| Beta Attenuation | The measurement of both sizes of particles is not simultaneous (guidelines) To discriminate between particle of different sizes (e.g., between PM and PM ), some preliminary separation could be accomplished, for example, by | |||||
| specially designed inertial particle size separators like cyclones or impactors. Drawbacks: (from Thermo-Fischer website,https://www.thermofisher.com/in/en/home/industrial/environmental/environmental-learning-center/air-quality-analysis-information/beta-attenuation-technology-particulate-matter-measurement.html#:~:text=From%20the%20above%20description%20of,radioactive%20source%20also%20limits%20acceptance.)The primary drawback is that it is a non-continuous monitoring technology. Typically, only 4 PM readings per hour can be collected. The technology is also fairly expensive limiting its market acceptance. Its radioactive source also limits acceptance. | ||||||
| 4 | Particulate Matter PM | Annual*24 hours** | 4060 | 4060 | Gravimetric/TOEM/Beta- Attenuation | See above |
| 5 | Ozone(O ) | 8 hours**1 hour** | 100180 | 100180 | UV Photometric | Require chemical reagents which themselves are pollutants |
| Chemiluminescence | Presence of water vapor causes errors. | |||||
| Chemical Method | If done manually, there is always a scope for personal errors. Need chemicals as reagents which in turn are pollutants. | |||||
| 6 | Lead (Pb) | Annual*24 hours** | 0.501.0 | 0.501.0 | AAS/ICP method after sampling on EPM 2000 or equivalent filter paper | Use of argon gas is required to generate plasma. Both maintenance and purchase costs are high.Permissible limits have recently been reduced worldwide, which fall below the detection limits of the ICP AAS. ICP-MS is the preferred instrument now but it is too expensive[Ref: M. Harrington et al, Environmental Science: Processes and Impacts |
| 16(2) December 2013, DOI: 10.1039/c3em00486d] | ||||||
| ED-XRF using Teflon filter | Expensive instrumentation.LEAD standards are used. | |||||
| 7 | Carbon Monoxide (CO) mg/ m | 8 hours**1 hour** | 0204 | 0204 | Non Dispersive Infra-Red (NDIR) Spectroscopy | Can be affected by humidity and temperature.Accuracy declines at high concentrations of CORef: Trieu-Vuong Dinh et al, sensors and actuators B: Chemical, Vol 243, May 2017, 684-689.Standard CO gas needs to be stocked up (Guidelines). Any leak in the gas cylinders can have hazardous consequences. |
| 8 | Ammonia (NH ) | Annual*24 hours** | 100400 | 100400 | Chemiluminescence Indophenol blue method | Requires bubbling of the air through sulphuric acid prior to the analysis.Involves the use of chemical reagents like phenolNeed of expensive catalytic molybdenum converters (Guidelines)Operated at high temperatures 950-1000° C, (Guidelines)Filters are used to remove particulate matter. Any gases adsorbed on the particulate matter may be removed during the processConverter efficiency may be gradually lost and correctionsareto be applied during the calculations.The instrument needs to be operated in an environmentally controlled AC room (where temperature and humidity are controlled). |
In short, temperature, pressure, humidity, flow and vibration controls are required to be stringently set up at continuous ambient air quality monitoring stations, for effective functioning of the various equipment at a station. The role of interference caused by additives during the tests and the role of scrubbers employed during testing is still ambiguous. In summary, the existing methods of measurements practiced for ambient air quality monitoring are far from sacrosanct and are not problem free, having significant biases, limitations and drawbacks which remain to be addressed.
Against this backdrop a group of researchers from academia and industry undertookan elaborate and exhaustive research, during the first half of 2020 to study the status of current ambient air quality monitoring across India. Utilizing data from 233 Continuous Ambient Air Quality Monitoring Stations (CAAQMS) in India, during a period of 180 days from January 1, 2020 to June 30, 2020, highlighted the following issues and limitations which have serious implications to the validity, efficacy and sanctity of air quality/pollution monitoring [20]:
The air quality monitoring instrumentation presently being used are characterized by high costs, and a high level of maintenance.
The air quality monitoring stations provide representative data only for a very restricted area in space. This is a disadvantage because measurements at adequate spatial scales are essential for monitoring air pollution in heterogeneous environments such as those naturally found in the atmosphere [21].
To a large extent the air monitoring stations were sited at locations where sources of pollution were far away.
All air quality monitoring stations use a suction mechanism to pump air from a higher elevation and route the air through conduits to different sensors located below in an environmentally controlled container, making the measurements in vivo but not in situ.
The problems associated with in-vivo sampling vis-à-vis the preferred in situ sampling are well documented in scientific and technical literature. Most of the standards of in vivo sampling and measurements pertaining to various standalone sensors for pollutant monitoring have significant limitations.
The air samples for monitoring are taken from a location well above the height at which the general public live and breathe. The complex natural diffusion processes affecting the fluid flow patterns and the atmospheric stratification effects in the vertical direction raise serious questions regarding the validity of air quality monitoring at elevations well above the domain of human existence and relating the same data to health effects of the population. The role and degree of plausible contamination of the sampled air being routed through conduits before reaching the particular sensors for measurement are well studied and documented in scientific literature, pointing out uncertainties and undocumented errors associated with in vivo sampling techniques of the current air monitoring stations.
The non-uniform standards practised by various equipment suppliers across the stations, make Inter comparisons of degrees of pollution very difficult across the different stations.
Out of all the CAAQMS, during the study period of six-months, more than 90% of the stations reported missing data (perhaps, due to non-functional sensors) for periods longer than three to five days continuously.
All the stations were not monitoring all the required parameters responsible for computing the air quality index of a location.
In bigger cities like New Delhi where more monitoring stations are located, the spatio-temporal variations in air quality are markedly significant.
It would therefore be very difficult to determine the spatio-temporal variations in air quality, given the sparse sampling and the fixed nature of the CAAQMS locations across India.
Effects of strong and powerful natural events, like Cyclone Amphan crossing over land near Kolkata, West Bengal on the East Coast of India (May 21, 2020); and Cyclone Nisarg crossing over land near Konkan Coast, Maharashtra on the West Coast of India (June 3, 2020), were not even recorded by the CAAQMS located in the respective regions.
Air quality effects of the major industrial accidents (like in Visakhapatnam, Andhra Pradeshon May 7, 2020 when Styrene Gas leaked with its effects spreading to large spatial extent of a 10 km radius) were not even recorded by the Visakhapatnam CAAQMS station.
The effects of multiphase chemistry, need to be considered in pollution monitoring using passive sampling techniques [22].
Most of the stations indicated that all the monitored parameters were either in the Good or in Satisfactory category of the CPCB India Standards, while factual ground observations, indicated poor air quality.
The exhaustive study covering the entire geographical region of India over a statistically long period, thus raised disturbing and disconcerting questions on the validity, efficacy and sanctity of the current monitoring stations, in spite of their apparently satisfactory standards and certifications endorsed by concerned authorities.
The study has also showcased that air quality monitoring resulted in less than appropriate and adequate data, has not been cost effective, and in certain instances has resulted in implementation of costly programs which provided questionable benefits.
With the current air quality measurements getting embroiled in many serious issues and challenges, and threatening to jeopardize the primary objective of the Clean Air Initiatives of the Central Government of India as well as of the many States of India, a strong wakeup call to all the slumbering stakeholders and authorities would therefore be timely and necessary.
Hence it would be apt to summarize that given the limitations in measurements, coupled with the complexities of tropical atmospheric and oceanic dynamics associated with the Indian sub-continent, the current air quality monitoring methods, mechanisms and management needs a thorough overhaul.
V. Accurate, Cost Effective Solutions
It is high time that the concerned stakeholders realize that the solution to the air quality monitoring imbroglio lies in looking at newer and better sensors and technologies. The ability to assess ambient air quality depends heavily on the availability and applicability of appropriate sensors. Until recently, most pollutant sensors capable of providing quantitative information were of the type, where the air to be monitored should be brought to the sensor. Such sensors are restricted to measurement of a parameter at a single point in space, or, when mounted on a mobile platform, at sequential points as a function of time, but cannot be labelled as in-situ sensors.
Moreover, because of the difficulty of relating a point in space remote from the sensor to sensor data, great care must be taken in selecting the site for the sensor, and in drawing meaningful inferences thereafter.
Maximum use of new concepts and methodologies as they become available, therefore is essential. Such concepts as integrated monitoring systems, new optimization techniques and state-of-the-art measurement devices, such as those employing remote sensing techniques, are becoming operational in the sense of being available for testing and application.
Needless to say that ignoring to use them to their fullest capabilities will result in a loss of the opportunity to develop rational environmental assessment tools . As new devices become available, they should be incorporated into operational monitoring systems. There is no doubt of the ever increasing importance of remote sensing for air quality monitoring programs. These techniques can not only replace contact monitors but also will augment and improve monitoring methodology.
As newer techniques and hardware become more available and enhance our ability to monitor our environment, we will be faced with the question of, what is the most cost-effective combination of fixed, mobile contact and remote sensors for a specific monitoring problem? Hence new systems and technologies capable of spatio-temporal monitoring with high sampling frequencies, capable of large spatial areas of coverage would be advantageous and cost effective.
Another area where advances are yet to come is in the development of monitoring methods for assessing exposure-dose relationships. In the past, environmental monitoring has been carried out in response to an already existing hazardous condition. Future monitoring systems must be able to detect potential problems and monitor the appropriate parameters before they reach crisis proportions.
Some possibilities which might be explored are the use of biological exposure indicators as trend monitors to predict changes, and the development of personal exposure meters, such as biochemical measurements which integrate the total exposure of an individual to a pollutant or class of pollutants. When we achieve accurate, valid and broadly applied exposure monitoring, we then shall have made a major step toward achieving the ability to truly and rationally evaluate the management of our air resources.
In summary, air quality management requires an understanding of the type of air pollutants being emitted by various sources from on road vehicles, large industrial facilities, power plants and smaller sources such as residential heating and asphalt paving. The development of emissions inventories is critical for the states to implement accurate and effective air pollution control strategies .
These challenges can therefore only be met by portable, light weight sensors and systems which are capable of accurately monitoring all pollutants in-situ from remote location, in real time. Sensors with capabilities for simultaneous spatio-temporal monitoring, with high sampling rates would certainly be a boon in our crusade for accurate and cost effective ambient air quality monitoring.
VI. AMBIENT AIR QUALITY MONITORING-II: INDIGENOUS PHOTONIC SYSTEM AUM
a) Indigenous Photonic System for Real Time, Remote Air Quality Monitoring
With the current systems and technologies used for air quality monitoring having serious constraints, in addition to being prohibitively expensive for wider deployment - the impetus for an indigenous development of a system for real time remote monitoring of all air quality parameters becomes crucial for India not only in achieving self-reliance in high end technologies, but also in aiding the nation's health and economy.
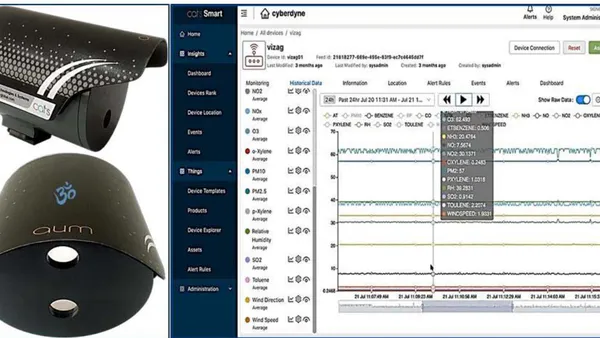
Against this backdrop Prof. Rao Tatavarti of Gayatri Vidya Parishad, designed and developed a novel innovative photonic system capable of real time remote monitoring of various air parameters simultaneously, to arrive at the in-situ air quality at a particular location or as a spatial profile with high sensitivity and accuracies by adopting COTS (commercially-off-the-shelf) technologies, thus making them significantly cheaper for wider deployment.
An indigenous photonic system, for real time remote monitoring of all air quality parameters was designed and developed, with the sponsorship by DST, Govt. of India under the Clean Air Research Initiative, and M/S CATS Ecosystems Pvt Ltd, Nashik which is the technology transfer partner for commercialization. The indigenous development is christened as AUM (Air Unique-quality Monitoring) system.
b) AUM
AUM photonic system has a modular design with interchangeable components and modules from any other system. The photonic system AUM comprises of the following subsystems:
Photonic System Source – Laser (<10 milliwatt, Wavelength 250-850nm, <2mm circular diameter beam, TEM Irradiance).
Photonic System Detector: Position Sensing Photo Detector (low SNR, 20mm × 20mm, Si-Duo Lateral Position Sensing Diode, with submicron (0.01μm)/nanometre (10nm) resolution.
Optical Filter (transmission at a narrow pass bandwidth ±10nm, centred as per selected source)
Optoelectronic Amplifier
Signal Conditioning Unit
Signal Processing Unit
Multilayer PCBs- (for protection from EMI/EMC, appropriate power electronics, signal conditioning and signal processing)
Mechanical Encapsulation Cabinet - (for housing the photonic system and providing protection from the vagaries of weather, environment and rain).
Junction Box (for housing the integrated electronics, communications interfaces, multilayer PCBs).
Power Source (rechargeable DC power source, 19V, 7.1 amps).
Wired Communication Unit (for multichannel lossless transmission of signal data to connected server)
Wireless Communication Unit (for multichannel lossless transmission of signal data to remote server, real time).
The uniqueness and novelty of AUM (patent pending), lies in an innovative application of the principles of laser back scattering, statistical mechanics, optoelectronics, artificial intelligence, machine/deep learning, and Internet of Things - resulting in a unique system capable of identification, classification and quantification of various pollutants simultaneously (of accuracies of less than one ppb) and meteorological parameters, with very high precision, sensitivity and accuracy.
AUM is a unique photonic system capable of non-intrusive monitoring in real time of all the air quality parameters of interest at one go, with very high sampling frequencies. AUM has the additional unique capability of enabling spatial profile sampling information in addition to temporal sampling. The system has embedded intelligent algorithms and software operating on a user selectable remote server with data encryption, which ensures data security as well as free flow of desired information to authorized users as per specific requirements.
AUM system comes in two configurations – standard and ruggedized. Each configuration has again two options for data communication – wired or wireless. The physical characteristics of each configuration are designed differently enabling them to withstand either normal environmental loads (standard configuration), or extreme environmental loads (ruggedized configuration).
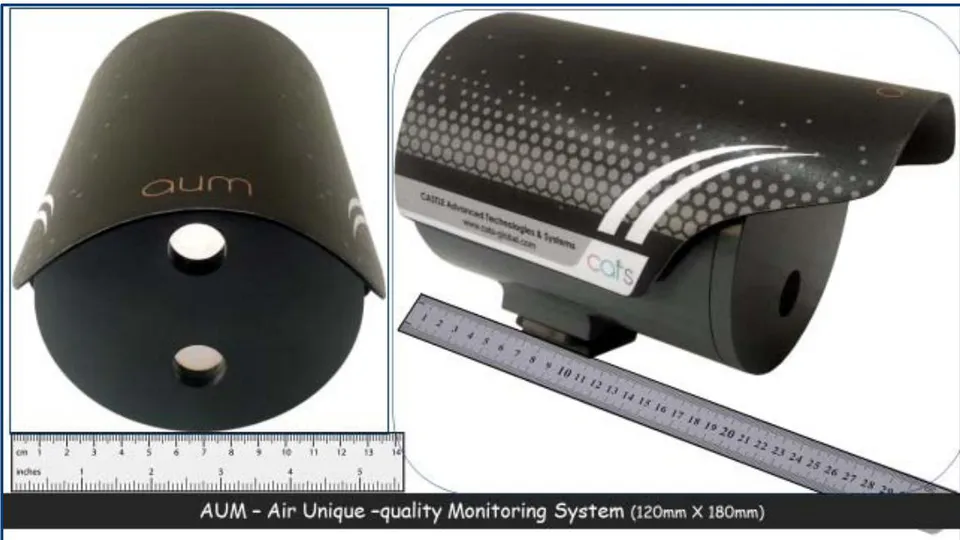
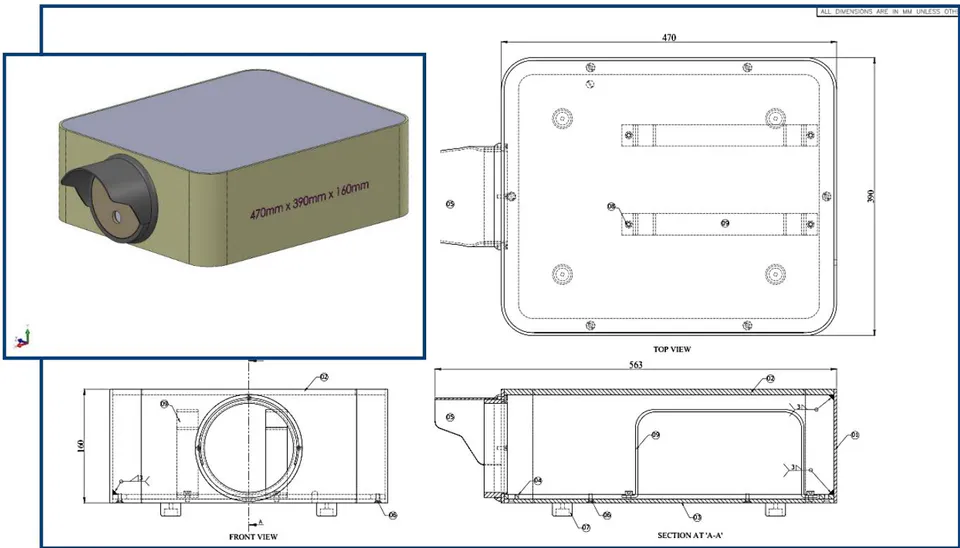
Each of these configurations have two options for data communications – a wired option or a wireless option enabling different sampling frequencies of data from system as per user requirements. All other technical details of the system are the same in both configurations. The accuracy and resolutions of the outputs are also the same for both the configurations and the data communication options.
AUM is integrated with proprietary software that can be deployed on local or cloud server. The software is developed on Apache Cassandra platform so that it can handle terra bytes of data. AUM equipment is robust and can functions day and night in harsh environment conditions. AUM is Wi-Fi enabled and can seamlessly connect to any Wi-Fi network protocols. The equipment is also supported with battery backup for 4 hours so as to provide uninterrupted operations even during power failure.
AUM comes packed in an unbreakable, watertight, airtight, dustproof, chemical resistant and corrosion-proof hard case. The external case is made of ultra-high-impact structural copolymer that makes it extremely strong and durable. The external case lid has a neoprene O-ring to ensure water proof and dust proof environment during transportation, and easy to open, double-throw latches that seal perfectly. It has a built-in automatic pressure equalization valve for changes in altitude or temperature. The case uses stainless steel hardware and has padlock protectors to provide added strength and extra security against cutting and theft. It can be carried by three comfortable rubbers over the moulded haul handles, a retractable handle and built-in wheels.
c) AUM - Photonic System - Sensor Structures, Modules, Mechanisms
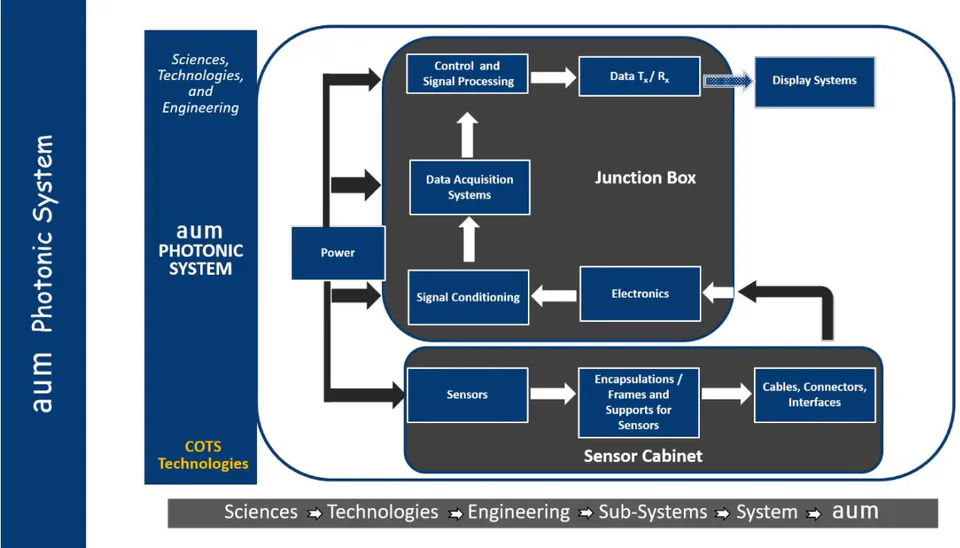
d) AUM - Sampling Protocol
AUM System has two configurations, defined by the data communication protocols (Wired and Wireless) from system to the server. AUM has an active sampling, real time remote detection capability. The sampling frequency for the wired version is 1 -10kHz, while for the wireless version the sampling frequency is ~150-200Hz.
e) AUM - Calibrations Procedure and Protocol
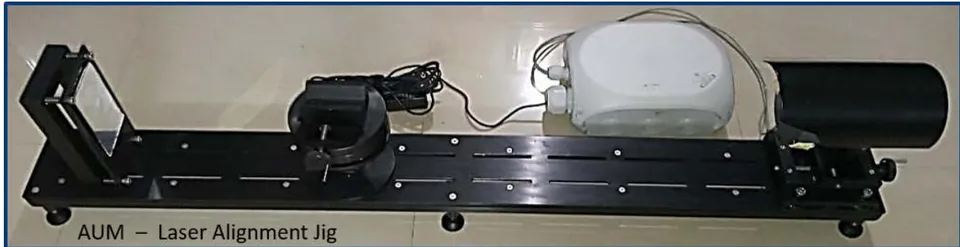
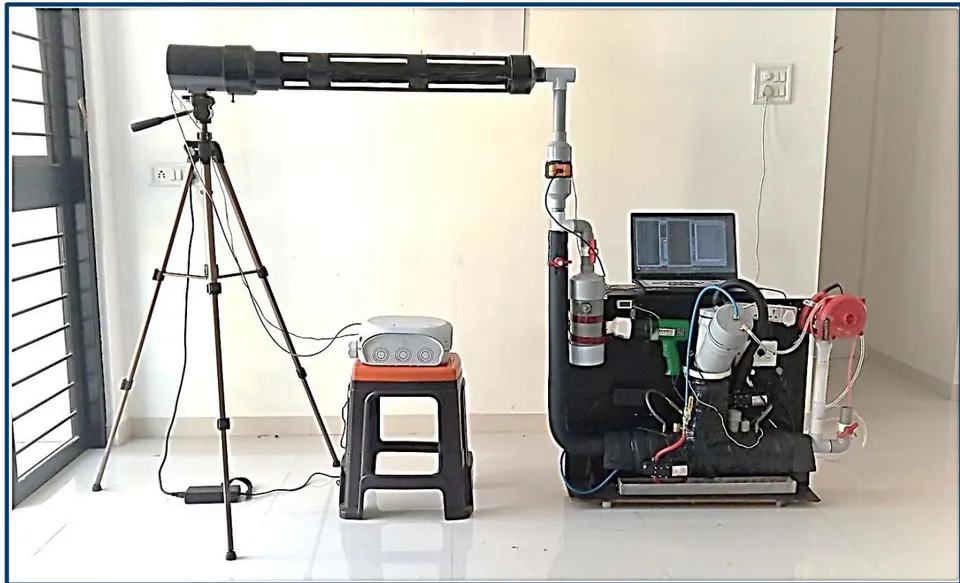
Specially designed and developed, portable, light weight Calibration Setup/Facility enables easy calibrations with standard gases, mixtures, at varying ambient environmental conditions of air temperature, air pressure, and relative humidity). The AUM's laser beam would be focussed into the environmentally controllable air chamber and calibrations completed for different standard gases under widely varying ambient air temperatures, pressures, humidity enabling effective calibrations of all pollutants. The standard gases are to obtained from ISO 17025 certified sources. The temperature/humidity/ flow sensors to be used are to meet International Standard specifications with higher accuracies and sensitivities. Once AUM photonic system is calibrated, then routine or periodic calibration is not required.
f) AUM - Laboratory and Field Evaluations
AUM was successfully evaluated during laboratory trials in a sub-sonic wind tunnel, in the laboratory with gold standards (in collaboration with Effect Tech, UK an ISO 17025 2000 International Standard Accredited Laboratory), and also compared in the field with the imported systems from Environment SA, France and Eco Tech, Australia operated by Karnataka State Pollution Control Board's Central Environmental Laboratory with ISO 17025-2005 & NABL Accreditation; under the aegis of the Central Pollution Control Board of India.
AUM was demonstrated to be very highly sensitive and accurate and capable of simultaneous detection and quantification of all air quality parameters and offers a number of merits over any of the currently available conventional systems, having the following features and characteristics:
Portable, compact, low powered and economical.
Plug and play system, requires no setting up time and no additional civil infrastructure for housing.
Provides information on all gases, and meteorological parameters simultaneously.
Non-intrusive, remote, in-situ, real time monitoring system with very high sensitivities and accuracies.
Single system capable of monitoring in both spatial and temporal domains, with high sampling rates.
Data from sensors seamlessly streamed to a cloud server, from where encrypted real time dash board information is pushed to authorized users.
System can work continuously, even under extreme weather and climatic conditions
Embedded intelligent monitoring algorithms to identify and alert impending system failures to enable preventive maintenance.
Spatial sampling as per user requirements, dictated by unhindered line of sight conditions in the field.
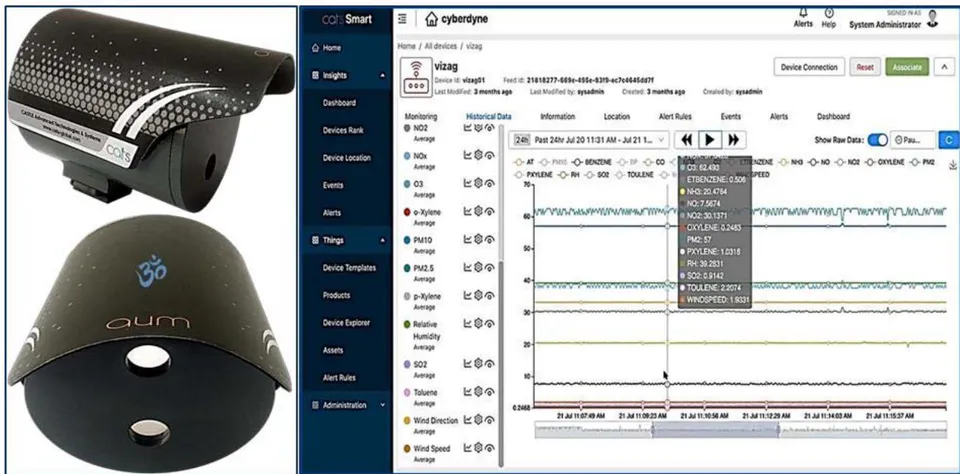
AUM System has two configurations, defined by the data communication protocols (wired and wireless) from system to the server. AUM has an active sampling, real time remote detection capability. The sampling frequency for the wired version is 1 -10kHz, while for the wireless version the sampling frequency is 150-200Hz.
AUM photonic system has built in intelligent monitoring system which is capable of performing real time diagnostics. The photonic system has an optical filter which is embedded in the system and is part of the hardware.
AUM operates on principle of backscatter of light and there are no moving components inside the system. Faults occur only if one of the components malfunctions. The only component which requires replacement is the laser source, in the AUM Photonic System. The embedded intelligent alert monitoring system would flag a degrading laser source well in advance so that replacement of the same can be planned at least a week in advance. The replacement can be accomplished by a technician/engineer having basic tools within a span of one hour. Replacement of components is easy and simple. The information related to malfunctioning will be alerted and an alarm raised by the intelligent alert monitoring system so that appropriate action can be taken to ensure smooth functioning.
AUM is integrated with proprietary software that can be deployed on local server or laptop. The software is developed on Apache Cassandra platform so that it can handle terra bytes of data. AUM equipment is robust and can functions day and night in harsh environment conditions. AUM is Wi-Fi enabled and can seamlessly connect to any Wi-Fi network protocols. The equipment can also be supported with battery backup for durations specified by user, so as to provide uninterrupted operations even during power failure.
g) AUM - Spatial Profile Monitoring Capabilities
The genesis for AUM technologies lies in the earlier development of photonic system taraNi(Technology for Air-data Reckoning for Aerial Navigational Information) for effectively monitoring molecular air data products from on-board a fast moving aircraft, supported by Aeronautical Defence Agency (ADA), Ministry of Defence, Government of India. The spatial profiling technology subsystem is an add on feature to the ruggedized version of AUM and facilitates sampling of air quality parameters at varying ranges from system (from less than 10m distance to more than 1 km distance) at sampling intervals of every 1 minute. The AUM photonic system version with spatial profiling capabilities is being commercialized under the brand name SAMIRA – Seeing Air in Motion Instrumentation for Remote Sensing Applications - an indigenous system capable of monitoring all air quality parameters and environmental parameters at different ranges (distances) from the system simultaneously. The system was extensively tested in wind tunnels, laboratories and in the field and compared to some of the commercially available systems. Real time, remote monitoring of the spatial profiles of environmental parameters were successfully demonstrated at Kayathar, Tamil Nadu in association with National Institute of Wind Energy (NIWE), Ministry of New and Renewable Energy, Government of India at the Nippon Group (Japan)'s Net Magic Data Centre at Bombay Stock Exchange, Mumbai. Please see Certificates and Testimonials attached from NIWE, Government of India and Net Magic, India.
Aum Photonic System Vis-À-Vis Conventional Ambient Air Quality Monitoring Systems
| AUM - PHOTONIC SYSTEM | CONVENTIONAL MONITORING SYSTEMS(#EcoTech, Australia; #Environment SA, France; #Thermo-Fischer, USA, etc.) | |
| 1. Single active system focusses a laser beam at the target location and detects the backscattered laser radiation from the target volume of air (location) to qualitatively and quantitatively identify various parameters at the target location which are responsible for back scattered radiation characteristics.2. Information on specificity and selectivity of pollutants is very high and uniform.3. Single photonic system capable of monitoring of all air quality (gases, VOCs, PM) parameters and meteorological parameters (temperature, pressure, density, wind speed and wind direction).4. Real time, remote, non-contact, in-situ monitoring as the probing laser beam is focussed at the target location (volume of air) to be monitored. (Eulerian measurement).5. As the laser beam can be focussed to and fro to different ranges from a single system, spatio – temporal profiling using a single system is possible facilitating spatial profiling over the entire range band (Lagrangian measurement), with a single system at high sampling frequencies of data acquisition at different ranges.6. Single photonic system can make Eulerian as well as Lagrangian measurements at high sampling frequencies at locations.7. High sampling frequencies of sensing, 150-200 Hz.8. Portable system, light weight. Even ruggedized version is <10kg in weight.9. No additional environmentally controlled housing required.10. No additional infrastructure required.11. Occupies only 0.1 m3space.12. Low power requirements.13. Low capital cost, minimal maintenance, highly economical.14. Low life cycle cost.15. One-time calibration only.System has one calibration protocol.16. Plug and play system, for immediate use, no setting up time required.17. No learning curve involved for users.18. High frequency real time encrypted data, directly streamed to a cloud server.19. Algorithms and big data analyticspost relevant digestible information to authorized users in real time, anywhere in the world.20. Predictive analytics package in real time for forecasting of pollution information for public awareness.21. Indigenous system, no constraints in technology transfer. | 1. The AAS, NDIR, Chemiluminescence, UV Photometry, Beta Attenuation, TEOS, Gravimetric, ICP-MS, GC systems are a combination of analytical equipment, electrochemical, electro thermal and optical sensors and analyzers which are connected respectively to data recording device. The suite of sensors, each monitoring a particular parameter employing separate sensing mechanism. Each sensor therefore has varying characteristics, sensitivities, limitations and accuracies.2. Information on specificity and selectivity of pollutants is sensor specific and variable in a particular station.3. Multiple sensors and analyzers are sourced from different manufacturers and therefore integration of the same by the third party integrator poses limitations and challenges, in terms of time responses, sampling rates, calibrations, maintenance and error resolution.4. Volume of air to be monitored is sucked from outside and passed through conduits to different sensors for measurements, hence measurements are not remote, and not in-situ, butin-vivo. Flow rate, temperature and humidity variations of sucked air samples routed through conduits affect measurements and introduce errors in measurements. The in-vivo measurements pose limitations and challenges.5. Only one measurement pertaining to the air sample sucked in.6. Spatial profiling information not possible.7. Low sampling frequencies of data, <0.0.1Hz.8. Bulky and heavy establishment of infrastructure. Weighs >1000kg.9. Separate robust housing and environmental control required.10. Additional infrastructure required to house the sensors/analyzers.11. Occupies >220m3of space.12. Higher power requirements.13. Very high capital costs and high maintenance costs.14. Frequent calibrations required. Each sensor needs different calibration procedures and protocols.15. Protocols to be initiated and maintained before usage.16. Setting up time of 2 to 3 weeks required.17. Users need apriori training for usage, upkeep and maintenance.18. Data acquired on a connected system is posted to local server through Wi-Fi, where data cleaning, post processing are done by intervention, and information posted to users at the end of day.19. No big data analytics, information need to be accessed from server.20. No predictive analytics in real time, no forecasting possible. Only hindcasting.21. Imported systems, no technology transfer. | |
| CHARACTERISTICS | AUM - PHOTONIC SYSTEM | CONVENTIONAL MONITORING SYSTEMS(#EcoTech, Australia; #Environment SA, France; #Thermo-Fischer, USA, etc.) |
| ACCURACY AND SENSITIVITY | 1. Temporal response of system is <10ns.2. Spatial resolution of detector is < 100mm.3. Higher orders of accuracy and sensitivity, capable of monitoring different gases even at very small concentration levels (< 1ppb) and meteorological parameters at <0.1 SI units respectively.4. Detectability range for all parameters is large (3 to 4 orders of magnitude).5. Photonic system generally has about three to four orders of magnitude higher sensitivity compared to most conventional systems. | 1. Changes in environment such as temperature, pressure, humidity, air turbulence, and airborne particles affect sensors. Temporal responses are therefore slow.2. Lower temporal responses. Lower sensitivity.3. Different detectability ranges as per individual sensors (lower detectability ranges).4. Cross sensitivity is a common problem, especially at low concentrations of gases5. Species interferences, leaks and contaminations are known problems. |
| SENSING AREA COVERAGE | 1. AUM system can cover from 10mm to 1Km in range, and unit can be rotated .2. Data of air can be collected vertically as well as horizontally at distance of every 10mm to 5km as per requirements. The laser beam travels to the targeted area/source of pollutants.3. With few nos. of installation complete city can be monitored for pollutants and weather conditions.4. Hence monitoring emission from giant chimney, duct, stack is done with utmost ease. The only limiting factor with respect to area of coverage, is clear line of sight. One single unit from its fixed location can cover a huge area in all directions.. | 1. The polluted air is sucked/pumped in using high energy consuming suction fans.2. The air has to pass in to the proximity of sensors. Hence area of coverage is the biggest limiting factor.3. The fixed station (sensor) must be located near the source of gases, which becomes a severe limiting factor.4. Pollutants, Gasses, Temperature, humidity, Air pressure etc. are measured from fixed location only. |
| CALIBRATIONS | 1. No routine calibration required.2. Calibrations performed with primary gases/gas mixtures of ISO 17025, ISO 17034 international standards. | 1. Routine calibration required, gases and chemical are required to be stored for monthly (periodic) calibration exercise. Refilling for some pollutants monitoring is periodically required.2. Reagents used for calibrations can themselves be pollutants/contaminants. |
| TEMPERATURE | 1. System can operate in extreme external environments as well as indoors. | 1. The system is required to be maintained in controlled environments of temperature and humidity and protected from the vagaries of external weather and dust. Hence environmentally controlled containers are mandatory. |
| HAZARDS | 1. Safe laser having minimal battery power requirements is used. If uninterrupted source of electric power is available, then no battery is required.2. The system is rugged and can be placed anywhere.3. The system is designed using CFD (Fluid Simulations and Thermal Analysis) to appropriately dissipate the heat. | 1. Minimum of 10kVa of UPS and battery bank is required.2. Gases like hydrogen, carbon radio isotope ( ) etc. are used by analyzers. Banks of different types of gas cylinders are required to conduct routine calibration. Hence Fire and Safety protocols are mandatory requirements.3. The complete system has to be installed in a highly protected shelter (container). The area needs to be 100% leak proof, dust proof, environmentally controlled. |
| EASE OF USE | 1. No human intervention.2. No special training required to operate and maintain. | 1. The systems require human intervention. Special training for all different types of analyzer are required. Hence most of the system sold are operated and maintained by respective vendor. |
| DELIVERY AND INSTALLATION | 1. Immediate delivery of system2. Installation is mere plug and play.3. No learning curve required. | 1. Delivery takes minimum of 90 days2. Installation is required to be done near the source due to limiting sensing distance. Installation, testing and deploying takes at least 15 days.3. Users require detailed training on protocols and practices. |
| USEFUL LIFE | 1. With miniscule maintenance, and no moving parts, the useful life shall be more than that of any conventional system. | 1. With consistent maintenance, the system has useful life of 10 years. |
| MOBILE | 1. Photonic system can be used as a handheld unit, fitted on any moving vehicle or on a fixed a platform (tripod). The unit is very light in weight. Speed of vehicle is not a constraint.2. The system can be used to monitor outdoor air as well as indoor air. | 1. Pollution station is fixed in one place. Weather monitoring can be integrated with mobile.2. Mobile unit has to be located on truck as Fixed unit. Individual analyzers are available as handheld, but cumulatively the same have to be integrated and fixed in one place. |
| SIZE | 1. City air quality and weather monitoring system size is compact, of the order of 180mm*220mm. | 1. The bulky systems are housed in containers, as big as big 40 feet × 20 feet× 20 feet. |
| MAINTENANCE | 1. Only change of laser diode required. A single laser source is designed to operate for 10,000 hours. The unit can also have a self-cleaning mechanism.2. Inventory required is of laser sources only and based on usage, replacement may be required once in a year. | 1. Routine maintenance and cleaning required. Filters need periodic changing.2. Calibration gases are required to be refilled. Batteries are required to be replaced every 3-5 years based on make and warranty clause. |
Global Journal of Science Frontier Research (H) Volume XXI Issue IV Version I
| CHARACTERISTICS | AUM - PHOTONIC SYSTEM | CONVENTIONAL MONITORING SYSTEMS(#EcoTech, Australia; #Environment SA, France; #Thermo-Fischer, USA, etc.) |
| DATA | 1. The photonic system collects data at high sampling frequencies. Hence there is all possibility to provide data per millisecond, if required.2. Huge data provides very accurate aggregation on per minute basis and makes real time data worthwhile. | 1. These systems collect only parametric driven source data per 10 seconds.2. Old installed systems collect data on hourly basis. |
| IT ENABLED | 1. Big Data ready with Cloud computing.2. Internet of Things (IoT) and Array of Things (AoT) solutions can be devised based on available data.3. GPS in built.4. Predictive, Preventive, Prescriptive and Geo Spatial Analytic is possible.5. Browser based and personal mobile app available. | 1. Most of the available system is based on thin client.2. Systems are not ready for larger data platforms that can enable solutions using IoT or AoT.3. No GPS information, fixed bulky station.4. Absence of Big Data, geo-spatial analytics is very difficult.5. Mobile apps are generally not provided by system integrator but by respective Govt.Department i.e. pollution control board, |
| REPORTING | 1. The data is centralized for all environmental effects due to weather & pollution.2. Integrated reporting of all parameters of environment can open new pathways for predicting and preventing the future hazards. | 1. Environmental Data is all decentralized.2. There is no integrated medium till date. Hence reporting is limited. |
| FINANCIALS | ||
| COST | 1. Photonic system Improves on total life cycle costs. In comparison to conferences of sensors with complex integration, the cost of photonic system is less than 30% to its conventional near to equivalent counterpart.2. The maintenance cost is also very negligible. | 1. The conferences of sensors as complete system are highly Capital intensive.2. Operating and maintain costs per year are more than 30% of CAPEX. |
| CUSTOMISE TO PAY PER USE ONLY | 1. User are open to select the pollutants from a library that they wish to monitor.2. Some of the selected gases can be deselected and other set of gases can be selected.3. This works on similar basis of DTH system. One can select TV broadcasting channel and pay for the usage.4. Photonic system is also available on rental basis. | 1. Such mechanism is not possible.2. Once an analyzer is purchased, the user is fixed with the single or dual type of pollutants for life.3. Hence huge amount of capital is blocked as multiple systems for independent pollutants are required to be installed.4. Hence financing options are limited. |
| OVERALL BENEFITS | 1. Low CAPEX and Low OPEX.2. With number of systems installed across the city, Individual are provided with interactive pattern for the kind of exposure they have with environment. This can lead to break through in early prognosis and diagnosis of health issues related esp. with and below. | 1. Based on sampling indicators from one or two locations and determining the air quality of a city, is prone with errors.2. High capital and high operating overheads. |
| APPLICATIONS | ||
| CONTINUOUS EMISSION MONITORING SYSTEMS (CEMS) | 1. , , H/C's, , , , and other oxidants.2. Can identify organic particulates.3. Volatile Organic Compounds (VOC) - such as formaldehyde, benzene, methylene chloride and per chloro ethylene | 1. , , H/C's, , , , and other oxidants.2. Cannot distinguish organic particulates.3. Volatile Organic Compounds (VOC) - such as formaldehyde, benzene, methylene chloride and per chloro ethylene. |
| CONTINUOUS OPACITY MONITORING SYSTEMS (COMS) | 1. Total Suspended Particles (TSP). Any particles less than 1μm in diameter2. Lead Particulates/Particulate Material ( ) and also classifies between lead, metal, gas etc. | 1. TSP, Lead Particulates/Particulate Material ( ).2. Classification of composition of PM at the level of single equipment is not possible. |
| CONTINUOUS | 1. Can monitor the source from far away distance, only clear line of sight is required. | 1. Independent analyzers used for monitoring. |
| PARAMETRIC MONITORING SYSTEMS (CPMS) | 2. Measures a surrogate pollutant like carbon monoxide (CO), Methane, Hydrocarbons etc. or any stationary combustion source.3. Temperature, humidity, air pressure etc. at different heights can be measured.4. Smoke, fire etc. Can differentiate between smoke and steam. | 2. Respective analyzers/Sensors are required to be located near the source. This is most limiting factor during the course of emergencies like leakage, fire etc.3. Measures a surrogate pollutant like Carbon Monoxide (CO) Methane, Hydrocarbons or any stationary combustion source.4. Smoke, fire etc. Does not differentiate smoke and steam. |
h) AUM: Technical Data and Specifications
| Electrical Power Supply | 230V, 50Hz AC, 15 amp Electrical Socket |
| Current Consumption | 135 watts |
| System Detection Range | < 10m to >1km; Configurable as per user requirements |
| Accuracy | <1ppb for gases, <0.1 SI units for temperature, wind, pressure |
| Response Time | <10ns |
| Sampling Frequency | 1-10kHz (wired), 150Hz-200Hz (wireless) |
| Cable Types | 22, 24 AWG |
| Real Time Data Recording | On Designated Computer Server, Encrypted |
| Data/Information Display | Real Time Display on PC/Smart Phone Through Internet, Encrypted |
| Operational Range of Temperature | -25 °C to +70 °C (Ruggedized), 0°C to +55°C (Standard) |
| Operational Range of Humidity | 0 to 100% |
| System Shape/Dimensions | Cuboid/563mm × 390mm × 160mm [(L×W×H) – Ruggedized Version] Cylinder/180mm × 220mm [(ø × L) – Standard Version] |
| Weight | <10.0Kg |
| Protection Class/Deployment | IP65/IP67/IP69/Field Deployable Even in Harsh Environments |
i) AUM- Measurement of Pollution Parameters, Accuracies, Detection Ranges, Resolutions
| S. No. | Parameter | Accuracy | Detection Range | Accuracy (% Full Scale) | Resolution |
| 1. | 1 ppb [μg/m3] | 0 to 103ppm | 0.1% | 0.5ppb | |
| 2. | CO | <1 ppm [mg/m3] | 0 to 103ppm | 0.1% | 0.5ppb |
| 3. | NO | 1 ppb [μg/m3] | 0 to 103ppm | 0.1% | 0.5ppb |
| 4. | 1 ppb [μg/m3] | 0 to 103ppm | 0.1% | 0.5ppb | |
| 5. | 1 ppb [μg/m3] | 0 to 103ppm | 0.1% | 0.5ppb | |
| 6. | 1 ppb [μg/m3] | 0 to 103ppm | 0.1% | 0.5ppb | |
| 7. | <1 ppb [μg/m3] | 0 to 103ppm | 0.1% | 0.5ppb | |
| 8. | 1 ppb [μg/m3] | 0 to 103ppm | 0.1% | 0.5ppb | |
| 9. | Benzene | <1 ppb [μg/m3] | 0 to 103ppm | 0.1% | 0.5ppb |
| 10. | Toluene( ) | <1 ppb [μg/m3] | 0 to 103ppm | 0.01% | 0.5ppb |
| 11. | o - Xylene | <1 ppb [μg/m3] | 0 to 103ppm | 0.1% | 0.5ppb |
| 12. | p - Xylene | <1 ppb [μg/m3] | 0 to 103ppm | 0.1% | 0.5ppb |
| 13. | Et - Benzene | <1 ppb [μg/m3] | 0 to 103ppm | 0.1% | 0.5ppb |
| 14. | 1 ppb [μg/m3] | 0 to 103ppm | 0.1% | 0.5ppb | |
| 15. | 1 ppb [μg/m3] | 0 to 103ppm | 0.1% | 0.5ppb | |
| 16. | Wind Speed | <0.01m/s | 0 to 75m/s | 0.01% | 0.005m/s |
| 17. | Wind Direction | <1° | 0° to 360° | 0.01% | 0.05° |
| 18. | Air Temperature | <0.1°C | -25°C to 70°C | 0.01% | 0.05°C |
| 19. | Relative Humidity | <0.1% | 0 to 100% | 0.01% | 0.005% |
| 20. | Air Pressure | <1kPa | 0 to 105kPa | 0.01% | 0.5kPa |
| 21. | Solar Radiation | <1W/m2 | 0 to 105W/m2 | 0.01% | 0.5W/m2 |
- Stack, Chimney
j) AUM – Certification and Appreciation from Department of Science & Technology, Ministry of Science and Technology, Govt. of India
After critical and detailed reviews by DST, Dr Harsh Vardhan, the Honourable Minister for Science & Technology, Health and Family Welfare, Government of India, tweeted that the indigenously developed photonic system AUM, having better qualities, in comparison to any known international systems, is highly economical and therefore, rests on the verge of providing a big boost to the nation's efforts towards self-reliance in high-end technologies, and also can additionally be instrumental in supporting the endeavours in improving the nation's health and economy under #AtmaNirbharBharatAbhiyan. [24, 25, 26].
h) Diverse Applications of AUM
Continuous Ambient Air Quality Monitoring System
Continuous Emission Monitoring System
Portable Emission Monitoring System
Continuous Opacity Monitoring System
Continuous Parametric Monitoring System
CONTINUOUS AMBIENT AIR QUALITY MONITORING SYSTEMS (CAAQMS)
- City, Industrial Area
CONTINUOUS EMISSION MONITORING SYSTEMS (CEMS)
, , , , , ,
Volatile Organic Compounds (VOCs) - Such as formaldehyde, benzene, methylene chloride and perchloroethylene.
PORTABLE EMISSION MONITORING SYSTEMS (PEMS)
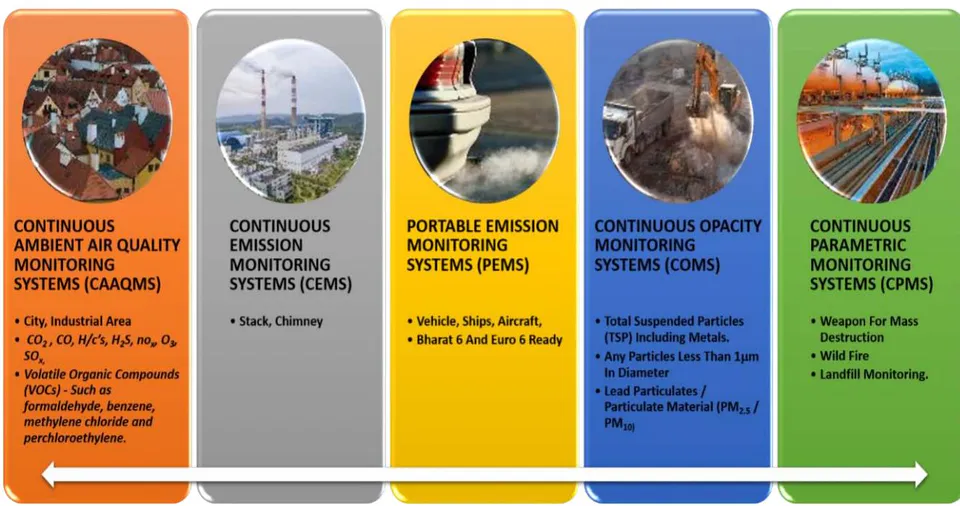
Vehicle, Ships, Aircraft,
Bharat 6 And Euro 6 Ready
CONTINUOUS OPACITY MONITORING SYSTEMS (COMS)
Total Suspended Particles (TSP) Including Metals.
Any Particles Less Than 1μm In Diameter
CONTINUOUS PARAMETRIC MONITORING SYSTEMS (CPMS)
Lead Particulates/Particulate Material (PM / PM )
Weapon For Mass Destruction
Wild Fire
Landfill Monitoring.
i) Way Forward
CATS Eco Systems Pvt. Ltd., Nashik is the technology transfer partner for commercialization of AUM. It is sincerely hoped, that the Ministry of Environment, Forests and Climate Change (CAQM,) and other central and state governmental organizations) in India and other stakeholders around the world would therefore facilitate the due recognition and acceptance of 'AUM' at the earliest, in sync with their established policies of proactively supporting innovative developments for commercialization, as it would certainly be instrumental in supporting the world wide efforts for monitoring and controlling air pollution.
VII. SUMMARY AND CONCLUSIONS
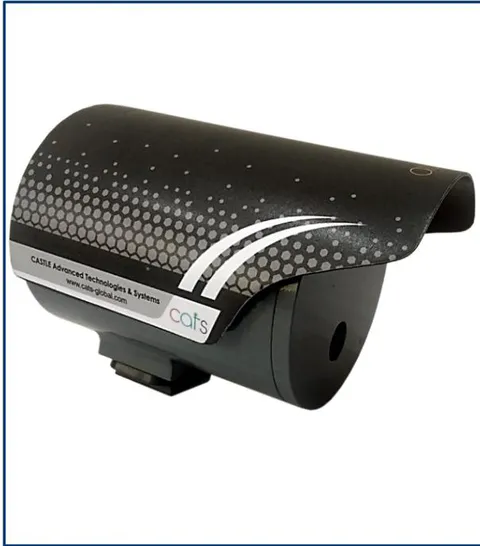
The indigenously designed and developed photonic system AUM, was successfully tested and evaluated with gold standards and also with some of the continuous ambient air quality monitoring stations of CPCB. The indigenous system was demonstrated to be having many advantages compared to the existing technologies and systems. The system is capable of monitoring all gases (with accuracy of ppb) and the environmental parameters both in spatial and temporal domains simultaneously at high sampling frequencies. The system can be deployed easily as it is light weight and portable. The system is operable in all weather conditions, and being an indigenous development is also highly economical and can certainly boost the nation's efforts towards self-reliance in high end technologies.
In conclusion, AUM is an innovative, unique, and disruptive technology with the following characteristics, unmatched by other known and established systems.
Highly Sensitive and Accurate
Plug and Play System, no setting up time, no additional civil infrastructure for housing.
Information on all gases, and meteorological parameters.
Non-intrusive, remote, in-situ, real time monitoring system. accuracies.
Single System capable of monitoring in both spatial/temporal domains.
High sampling rates.
Data from sensors seamlessly streamed to a cloud server
Sub-Sonic Wind Tunnel Calibrations for Wind, Temperature, Pressure, Density, Humidity
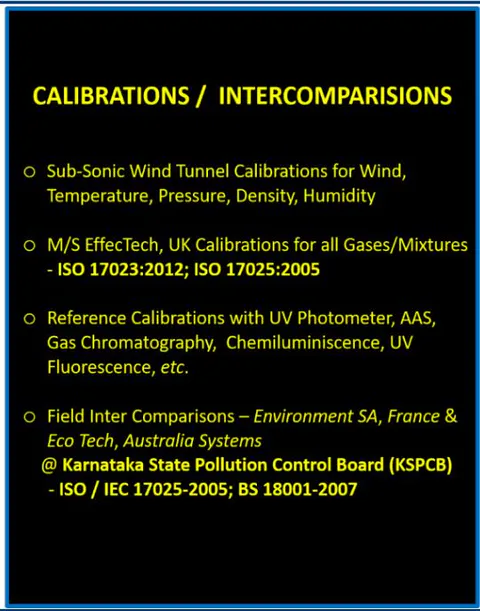
M/S EffecTech, UK Calibrations for all Gases/Mixtures - ISO 17023:2012; ISO 17025:2005
Reference Calibrations with UV Photometer, AAS, Gas Chromatography, Chemiluminiscence, UV Fluorescence, etc.
Field Inter Comparisons – Environment SA, France & Eco Tech, Australia Systems @ Karnataka State Pollution Control Board (KSPCB)
ISO/IEC 17025-2005; BS 18001-2007
Encrypted real time dash board information to authorized users.
Works continuously, even under extreme weather conditions.
Intelligent monitoring algorithms to identify and alert failures.
Spatial Sampling as per user requirements.
Unique calibration facility enabling AUM to be deployed anywhere in the world.
ACKNOWLEDGEMENTS
Many of my students, interns, colleagues and mentors have immensely contributed at various stages of the design and development of AUM, and other related systems and technologies.
The section on National Ambient Air Quality Monitoring: Existing Standards, Guidelines, Methods, and their Drawbacks, was researched by Dr. Sridevi Nadimpalli.
Author specially acknowledges Prof. Dr. Ashutosh Sharma, Secretary, DST, Government of India and his team of officers (Dr. Sanjay Bajpai and Dr. J.B.V. Reddy) for their immense support technically and financially (under the Clean Air Research Initiative, DST, Govt. of India) in the realization of this indigenous system. Prof. Mukesh Khare, Chairman, and Expert Members of DST review committee are gratefully acknowledged for their inputs and guidance.
R&D grants from DST, India (DST/TMD/CERI/Air Pollution/2018/004), NIWE, MNRE, India (CWET/MoU/2014/1), ADA, Ministry of Defence, India (ADA/AMCA/93/2012) and CATS Ecosystems Pvt. Ltd (CATS/GVP-SIRC/MoU/2016/1&2) are gratefully acknowledged.
Gratefully acknowledge the many contributions of the CATS Eco Systems Pvt. Ltd for funding, and the team of colleagues for various inputs without which this work would not have been possible.
The support of Commission for Air Quality Management (CAQM) Govt. of India in the evaluation and implementation of the indigenous technology AUM is gratefully acknowledged.