
I. INTRODUCTION
Business organizations have been continuously changing their approaches to deal with customers. Consumers now try to avoid physical hassle to purchase products but at the same time they want to purchase the best product at a reasonable price. For doing so, a large number of people have been seeking for the help of internet and trying to continue transactions through online platform. Online purchasing can be defined as a process in which consumers purchase any product or take any service from an online vendor using the internet. As long as the World Wide Web emerged, business organizations started selling their products to the consumers who normally have the internet connection. Prospective consumers get the privilege to visit web sites as per their convenience from their residences and can make purchase sitting in front of a computer or mobile device. Consumers are provided with a variety of product or service items from online vendors. The total number of internet subscribers has reached 80.829 million at the end of January, 2018. Among them, mobile internet subscribers are 75.396 million, wimax subscriber 0.088 million (BTRC, 2018). Parment (2013) said that generational cohorts have different values, preferences and shopping behaviors. The world has been changing continuously and so are the systems. As a result, the world has been turned into a digital field keeping behind the traditional brick and mortar system. New generations try to show distinctive and modern ways to perform different functions. As a result, many people in this modern era have been pursuing the help of online sites to purchase various products, and for taking numerous services. The wide use of online purchasing has really revolutionized and influenced consumers' pattern of purchase. Lifestyle has been more convenient with the blessings of the usage of technology. Consumers all over the world have been significantly motivated to purchase products online due to varieties of product availability, prompt and instant service and logical price. On the contrary, the chance of fraud and privacy violation has been evolved with the development of online shopping. Sometimes a website or total system becomes hacked and personal information are taken away and misused later on. Online vendors should keep this issue in mind with greater importance.
According to BTRC, the number of internet subscribers, who have made access to the internet at least once in the last 90 days, has reached 90.501 million at the end of August, 2018. Though the number of internet subscribers is promising in Bangladesh but only of the total population and of the users of internet in Bangladesh do online shopping. It has also been stated that Bangladesh is in the 121th position out of 137 countries in the measures of the readiness of countries to connect in online commerce (B2C UNCTAD ecommerce Index, 2016).
The overall market size for online commerce is growing at a high speed in Bangladesh. There are some reputed organizations in the online shopping sector such as Daraz, Chaldal, Bagdoom, Priyo Shop, Rokomari, Ajkerdeal etc. Considering all the prospects of ICT and e-commerce in Bangladesh, it can be added that if e-marketers know well about the factors that affect consumers' satisfaction on online purchase decisions; they can develop their own marketing strategies to convert potential customers to real ones, and also can retain current customers. Online vendors should design their system in such a way that ensures smart appearance, updated prices and reliable reviews of the products, develop an easy system to pay the price of the product or service, and also make arrangements for providing after sales service. The research problem is to find out and analyze the factors that affect online customers' satisfaction in the context of Bangladesh. This study is expected to improve the understanding of the factors that affect customer satisfaction of online purchasing in the context of Bangladesh. In addition, some valuable insights on how to craft effective strategies to excel in the demanding electronic marketplace will be presented to marketers doing business online.
II. OBJECTIVES OF THE STUDY
The general objective of the study is to find out and analyze the factors that affect the satisfaction of online customers in Bangladesh. The specific objectives are to prepare a profile of customers who purchase from online in Bangladesh, to find out the factors that affect satisfaction of online customers in Bangladesh and to find out the importance of each variable.
III. REVIEW OF LITERATURE
There are several articles on online purchasing scenario and its future in Bangladesh. But few studies have addressed the issue of customer satisfaction and various factors affecting it regarding online purchase in Bangladesh. Several studies can be found regarding the factors that affect customer satisfaction in online purchasing in different foreign countries' perspectives but this study is aimed at finding out the factors that have effects on customers' satisfaction in case of online purchasing in Bangladesh.
Sinha (2010) stated the reasons and purposes for which consumers use internet. These are investigations into product features, prices or past reviews, choosing products and services via the internet, giving order for product or service, doing payments and other issues. Online vendors should design their system in such a way that ensures smart appearance, updated prices and reliable reviews of the products, develop an easy system to pay the price of the product or service, and also make arrangements for providing after sales service. Lee and Joshi (2006) have classified the influential factors of customer satisfaction with online shopping which have been divided into three groups. These are customer traits, channel traits and web-store traits. Zhang and von Dran (2002) recognized system quality, information quality and service quality as vital elements for achieving success of e-commerce and web stores.
Tsai and Huang (2007) opined that online customer retention has recently gained much attention as a way of gaining competitive advantage. Khalifa and Liu (2007) noted that a customer satisfied with a particular internet store is more likely to shop there again. So, concept of customer satisfaction has become increasingly important to online and off-line businesses.
Devaraj et al. (2002) noted that understanding the factors that drive consumers' satisfaction and their choice of the online channels is very essential.
Customer satisfaction is a function of expectation and expectancy disconfirmation (Oliver, 1980). Alam and Yasin (2010) identified satisfaction of customer as one of the major issues in both traditional and online business environment in the study of consumer behavior. Assessing customer satisfaction and comprehending underlying dimensions of it is important from the perspective of practitioner, because it helps online sellers to standardize their performance and to find out areas that need development. On the other hand, the level of customer satisfaction with online businesses is helpful from customers' viewpoint, as it helps them to evaluate present and prospective online sellers' functions needed (Alam and Yasin2010). Oliver (1980) developed Expectation-Confirmation Theory (ECT) for studying customer satisfaction repurchases behavior. The theory says that consumers initially form an expectation before purchasing, and then construct perceptions about the execution of the used product or service after a period of initial consumption. After that, consumers make a decision on their satisfaction level depending on the extent to which their anticipation is assured by comparing the real performance of the product or service against primary expectation of the performance. Then repurchasing intentions will be created by satisfied customers. Similarly, confirmation of expectation regarding e-commerce website trustworthiness will motivate consumers to make purchase again from the previous e-commerce site. Different studies regarding the factors affecting online customers' satisfaction are presented below:
Product or service quality: Online purchasers want to get the actual quality and actual quantity of items that they order within the given time promised by the online vendors (Alam and Yasin, 2010). Santos (2003) defined e-service quality as the total customer assessments and judgments concerning the excellence and quality of e-service delivery in the virtual market place. Lee and Lin (2006) said that an equal or higher level of service quality is expected by online customers than traditional channels customers. Parasuraman et al., (1988) defined service quality as subjective evaluation of expectations of customers compared with the real service performance. When product performance fulfills a customer's expectation, then the customer normally shows the intention to buy the products again (Alam and Yasin, 2010).
Customized service: Ahn et al. (2004) found variety of products as an important factor that influence satisfaction. There is a tendency to try for new activities by innovative customers (Robinson et al. 2005).
Information availability: Li and Zhang (2002) said that potential consumers identify a need for some products or services, go to the internet and start searching for particular need-related information in the typical online shopping process. But, attractions of prospective customers are drawn by providing information about different products or services connected to the felt need in some cases instead of searching actively. Prospective customers then examine alternatives and select the option that fits their requirements the best for meeting the felt need. Lastly, a transaction happens and post-sales services are provided. Online shopping attitude implies consumers' psychological condition in terms of making purchases on the internet.
Convenience: Karayanni (2003) identified time efficiency, avoidance of crowds, and 24 hour shopping availability as the reasons for purchasing online. There are some consumers who give preference to traditional brick-and-mortar shopping over other retail channels and they do not think the online shopping as a convenience (Kaufman-Scarborough and Lindquist, 2002). Online consumers presently get more control and bargaining capacity compared to physical stores' consumers. This is because; the internet gives more interactivities between consumers and product or service providers as well as huge information availability of products and services (Alam and Yasin, 2010).
Ease of use: Consumers' trust is established by the comfort of navigation; design of interface and by guidance of user (Roy et al. 2001). Interactivity has been indicated as the main distinctive feature between marketing communication on the internet and old mass media (Hoffman and Novak, 1999). Chen (2009) said that perceived ease of use and trust are crucial factors in ascertaining online consumer behavior through behavioral attitude and perceived behavioral control. Customer satisfaction is directly affected by user interface quality because physical proof of the service provider's competence is provided and effortless use of the service is facilitated by it (Park and Kim, 2003).
Delivery quality: Yang (2001) said that the potential benefits of the internet can be realized for online customers, by high standard e-service quality. Delivery performance has major influence on the satisfaction of customer (Lee and Joshi, 2007). Ho and Wu (1999) said that internet users are the main target customers of products and services for the businesses who sell their products and services through online. Conversion of potential customers into real customers hugely depends on the services that businesses give and the level of satisfaction that consumers try to get.
Website design: Shergill and Chen (2005) found website design characteristics as the vital element that has influences on consumer perceptions of online purchasing. Alam et al. (2008) said that the design of website is one of the distinctive characteristics that affect online shopping environment. Galletta et al. (2004) said that website interfaces are a critical factor of common satisfaction attitude and that physical aesthetic features of websites can be compared with atmospheric elements of traditional shopping stores. Home page presentation and reliability have been confirmed as the important factors and online shopping is mostly affected by it (Ho and Wu, 1999). Park and Kim (2003) found that quality of information, quality of user interface and security perceptions have effects on information satisfaction and relational benefit that are significantly related to each consumer's site commitment and real purchase behavior.
Online security: Kolsaker and Payne (2002) said that security means the perceptions about the credibility of the payment methods that are used and data transfer and stock mechanism. E-commerce consumers think the lack of security as a risk and a primary impediment to the development of e-commerce (Dong-Her 2004). Flavian and Guinalyu (2006) showed that internet trust is basically influenced by the security perceived by consumers about the stirring of their private data. Privacy is defined as consumers' capacity to control appearance of other people in the environment during a market transaction or consumption behavior and the dissemination of information connected to or supplied during such transactions or behaviors to those who were absent (Goodwin, 1991). Park and Kim (2003) identified privacy as a troublesome factor for achieving probable online customers and holding present customers. The lacking of face-to-face communication can generate less trust and elevated risk may be perceived highly (Alam and Yasin, 2010). There is more chance of being shifted to brick-and-mortar shop if the perceived risk is high. Conversely, the intention of online shopping is higher if the perceived risk is lower (Tan, 1999).
After Sales Service: Kurata and Nam (2010) opined that sustainable relationships with customers can be created by providing after-sales services and it contributes prominently to customer satisfaction. Saccani, et al., (2007) defined after sales service as the set of activities that take place after the purchase of the product, expected to aid customers in the consumption of goods. Goffin and New (2001) found that after-sales services increase the value extracted by customers. DeLone and McLone (2003) noted that a satisfactory purchase experience would appear to be one requirement for the type of continued interest in a product that might lead to repeat purchasing.
IV. RESEARCH METHODOLOGY
This is a descriptive study in which quantitative data have been gathered to analyze the factors that affect online customers' satisfaction in Bangladesh. So, for this study, target populations are people who make online purchasing. The convenient sampling technique has been used in this research, because it involves the choice of subjects who are in the best position to provide the information required (Sekaran, 2000). The
size of sample for the research was 201. Responses from all divisions have been used in this study.
| 1. | Target Population | Elements | Adults (Male and Female) buying online. |
| Area | All divisions of Bangladesh have been considered | ||
| Time | The study was conducted during the period from August 2020 to September, 2021. | ||
| 2. | Sampling Technique | Non-probability Convenience Sampling. | |
| 3. | Scaling technique | 5 point Likert Scale, which is a part of Non Comparative Scaling Technique | |
| 4. | Data Used | Primary and secondary | |
| 5. | Sample Size | 201 | |
Research data have been collected from both the primary and secondary sources. In this study, a self-administered structured questionnaire has been used to gather primary data. Prior to final version of survey questionnaire, a pretest had been conducted and based on that, some minor changes were made in the wording of the questions. The questionnaire was divided into two parts. Part A included questions on demographics and part B included statements about factors affecting online customers' satisfaction in
a) Model Specification
The regression model is specified as follows:
Bangladesh. Sincere care has been given in the data collection procedure to minimize biasness and ensure validity and reliability. Secondary data have been collected from the sources like: journals, newspaper, and magazine, internet. For the study and data analysis purposes, five point Likert Scale, which is a part of Non Comparative Scaling Technique, has been used (where , , , , and ).
Where,
| OCS= Online Customers' Satisfaction D = Multiple Regression Constant AF=After Sales Service CU=Customization DQ=Delivery Quality EU=Ease of Use WD=Website Design | IA=Information Availability PQ=Product Quality CN=Convenience FP=Fair Price OS=Online Security ei = Error term |
V. DATA ANALYSIS AND FINDINGS
Research data have been analyzed by using frequency tables, factor analysis and multiple regression models. The following methods were used to analyze the collected data:
- Frequency tables
- Factor Analysis and
- Regression Analysis
a) Frequency Tables
The survey has been conducted with some demographic information of the respondents.
Respondents were asked about their gender, age, family size, marital status, income level and educational level. Their information with percentages is found out from the frequency distribution, and these are shown below:
| Gender | Frequency | Percent | Valid Percent | Cumulative Percent |
| Male | 125 | 62.2 | 62.2 | 62.2 |
| Female | 76 | 37.8 | 37.8 | 100.0 |
| Total | 201 | 100.0 | 100.0 |
This table shows gender specific type of variable and indicates the percentage of each value. As the table indicates, 201 respondents took part in the survey. Among them, 125 persons or of the respondents are male and 76 persons or of the respondents are female.
| Age | Frequency | Percent | Valid Percent | Cumulative Percent |
| 18-25 | 111 | 55.2 | 55.2 | 55.2 |
| 26-33 | 59 | 29.4 | 29.4 | 84.6 |
| 34-41 | 23 | 11.4 | 11.4 | 96.0 |
| 42-49 | 1 | .5 | .5 | 96.5 |
| 50 and above | 7 | 3.5 | 3.5 | 100.0 |
| Total | 201 | 100.0 | 100.0 |
This table contains age specific type of variable and indicates the percentage of each value. As the table shows, 201 respondents took part in the survey. Among them, 111 persons or of the respondents are between 18-25, 59 persons or are between 26-
33, 23 persons or are between 34-41, 1 person or is between 42-49 and 7 persons or of the respondents are 50 and above years old. So, it is evident that the people of young age have more tendencies to make purchasing using internet.
| Family Size | Frequency | Percent | Valid Percent | Cumulative Percent |
| 3 or below | 12 | 6.0 | 6.0 | 6.0 |
| 4 Members | 42 | 20.9 | 20.9 | 26.9 |
| 5 Members | 64 | 31.8 | 31.8 | 58.7 |
| 6 and above | 83 | 41.3 | 41.3 | 100 |
| Total | 201 | 100.0 | 100.0 |
As the table indicates, 201 respondents took part in the survey. Here, the frequency of family size with 3 or below members is 12 and it is of the total sample, the frequency of family size with 4 members is 42 and it is of the total sample, the frequency of family size with 5 members is 64 and it is of the total sample, the frequency of family size with 6 and above members is 83 and it is of the total sample.
| Marital Status | Frequency | Percent | Valid Percent | Cumulative Percent |
| Married | 102 | 50.2 | 50.2 | 50.2 |
| Unmarried | 99 | 49.8 | 49.8 | 100.0 |
| Total | 201 | 100.0 | 100.0 |
As the table indicates, 201 respondents took part in the survey. Among them, 102 respondents or of the respondents are married and 99 respondents or of the respondents are unmarried.
| Income Level (TK) | Frequency | Percent | Valid Percent | Cumulative Percent |
| Less than 20000 | 49 | 24.4 | 24.4 | 24.4 |
| 20000-30000 | 54 | 26.9 | 26.9 | 51.2 |
| 31000-40000 | 43 | 21.4 | 21.4 | 72.6 |
| 41000-50000 | 42 | 20.9 | 20.9 | 93.5 |
| 51000 and above | 13 | 6.5 | 6.5 | 100.0 |
| Total | 201 | 100.0 | 100.0 |
Source:Field Survey
The above table indicates, 201 respondents took part in the survey. Among them, 49 respondents or of the respondents have an income of less than 20000, 54 respondents or of the respondents have an income between 20000-30000, 43 respondents or of the respondents have an income between 31000- 40000, 42 respondents or of the respondents have an income between 41000- 50000 and 13 respondents or of the respondents have an income of 51000 Taka and above.
| Education | Frequency | Percent | Valid Percent | Cumulative Percent |
| Post-Graduation | 86 | 42.8 | 42.8 | 42.8 |
| Graduation | 80 | 39.8 | 39.8 | 82.6 |
| HSC | 35 | 17.4 | 17.4 | 100.0 |
| Total | 201 | 100.0 | 100.0 |
Source:Field Survey
The table indicates, 201 respondents took part in the survey. Among them, 86 respondents or of the respondents have post-graduation educational background, 80 respondents or of the respondents have graduation educational background and 35 respondents or of the respondents have HSC educational background.
b) Tests for Reliability
| Cronbach's Alpha | No. of Items |
| .736 | 11 |
The Cronbach's Alpha is a measure of reliability of the statistics. An Alpha value of 0.70 or higher is often considered the criterion for internally consistent established factors. This study has an Alpha value of 0.736 with internally consistent 11 items which is higher than the acceptable level. From this result it can be stated that the factors or variables that have been taken into consideration here that affect online customers' satisfaction in Bangladesh are internally consistent enough and indicating good reliability of data.
| KMO and Bartlett's Test | ||
| Kaiser-Meyer-Olkin Measure of Sampling Adequacy | .697 | |
| Bartlett's Test of Sphericity | Approx. Chi-Square | 568.515 |
| df | 55 | |
| Sig. | .000 | |
The adequacy of the sample can be assessed by using the Kaiser-Meyer-Olkin (KMO) (Kaiser, 1970) measure. KMO measure ranges from 0 to 1. For this study, Kaiser-Meyer-Olkin Measure of Sampling Adequacy is 0.697. So, the number of samples to identify and narrate the factors that affect online customers' satisfaction in Bangladesh is adequate enough. This measure is adequate and well-accepted for conducting Factor Analysis. Bartlett's Test of Sphericity (Bartlett, 1950) is used to make the chi-square significant. Hair, et al (1995) noted that Bartlett's Test of Sphericity verifies that correlation matrix is not an identity matrix and is significant at in Factor Analysis.
This study has an approximate Chi-Square statistics of 568.515. This is significant at the 0.05 significance level. This infers that the null hypothesis, that the population correlation matrix is an identity matrix, is rejected by Bartlett's Test of Sphericity (Malhotra & Dash, 2011). Therefore, this study finds that there is significant difference among the factors affecting online customers' satisfaction in Bangladesh.
c) Factor Analysis
| V8 | V9 | V10 | V11 | V12 | V13 | V14 | V15 | V16 | V17 | V18 | ||
| Correlation | V8 | 1.000 | .208 | .119 | .119 | .029 | .334 | .467 | .457 | -.053 | .298 | .634 |
| V9 | .208 | 1.000 | .396 | .323 | .146 | .137 | -.051 | .074 | .281 | .113 | .211 | |
| V10 | .119 | .396 | 1.000 | .270 | .071 | .202 | -.067 | -.003 | .283 | .005 | .153 | |
| V11 | .119 | .323 | .270 | 1.000 | .192 | .009 | .113 | .247 | .195 | .122 | .214 | |
| V12 | .029 | .146 | .071 | .192 | 1.000 | .149 | .315 | .109 | .351 | .119 | .167 | |
| V13 | .334 | .137 | .202 | .009 | .149 | 1.000 | .286 | .276 | .202 | .059 | .407 | |
| V14 | .467 | -.051 | -.067 | .113 | .315 | .286 | 1.000 | .322 | -.121 | .425 | .473 | |
| V15 | .457 | .074 | -.003 | .247 | .109 | .276 | .322 | 1.000 | .015 | .390 | .520 | |
| V16 | -.053 | .281 | .283 | .195 | .351 | .202 | -.121 | .015 | 1.000 | -.016 | .021 | |
| V17 | .298 | .113 | .005 | .122 | .119 | .059 | .425 | .390 | -.016 | 1.000 | .441 | |
| V18 | .634 | .211 | .153 | .214 | .167 | .407 | .473 | .520 | .021 | .441 | 1.000 | |
The above table shows the correlations among the variables. This is one of the notable conditions of Factor analysis that there should not have multicollinarity among the variables of the data set. This can be found out from the determinant value of the correlation matrix. The determinant value of the correlation matrix is 0.055. So, it is evident that there is no multicollinarity among the variables of the data set.
| Factor | Initial Eigen values | Extraction Sums of Squared Loadings | Rotation Sums of Squared Loadingsa | ||||
| Total | % of Variance | Cumulative% | Total | % of Variance | Cumulative% | Total | |
| 1 | 3.235 | 29.411 | 29.411 | 2.781 | 25.280 | 25.280 | 2.521 |
| 2 | 1.885 | 17.140 | 46.551 | 1.317 | 11.972 | 37.252 | 1.447 |
| 3 | 1.152 | 10.468 | 57.020 | .753 | 6.849 | 44.101 | 1.096 |
| 4 | 1.061 | 9.643 | 66.663 | .592 | 5.383 | 49.484 | .943 |
| 5 | .747 | 6.792 | 73.455 | ||||
| 6 | .719 | 6.532 | 79.987 | ||||
| 7 | .611 | 5.551 | 85.538 | ||||
| 8 | .496 | 4.510 | 90.048 | ||||
| 9 | .463 | 4.211 | 94.259 | ||||
| 10 | .365 | 3.320 | 97.579 | ||||
| 11 | .266 | 2.421 | 100.000 | ||||
IBM (2018) found that, the total column shows the Eigen values or amount of variance in the original variables accounted for by each component. The% of Variance column shows the percentage ratio of the variance accounted for by each component to the total variance. The Cumulative% column shows the percentage of variance accounted for by the first components.
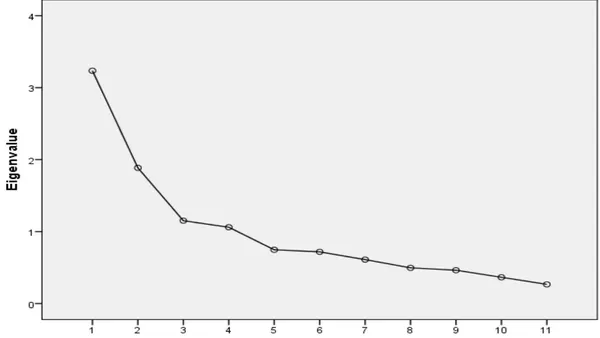
The above table shows four (4) factors have Eigen values greater than 1. This indicates that these four factors hugely affect online customers' satisfaction in Bangladesh.
The cumulative percentage for four factors is where the first factor explained of the total variance. The remaining three factors explained 17.140, 10.468 and of the total variance respectively.
Here, we can use the communalities table to know the names of those four factors.
| Initial | Extraction | |
| V8 | .504 | .563 |
| V9 | .295 | .443 |
| V10 | .251 | .374 |
| V11 | .237 | .300 |
| V12 | .290 | .698 |
| V13 | .304 | .681 |
| V14 | .485 | .564 |
| V15 | .382 | .386 |
| V16 | .293 | .382 |
| V17 | .330 | .352 |
| V18 | .564 | .700 |
Communalities table is used to identify the factors that affect online customers' satisfaction in Bangladesh. For this, we have to look at the initial value column. From the initial column, we can find five factors that affect online customers' satisfaction in Bangladesh.
The factors are V9, V10, V11, V12 and V16. From the questionnaire we get the names of those five variables. They are information availability, convenience, ease of use, attractive website design and customization of product or service.
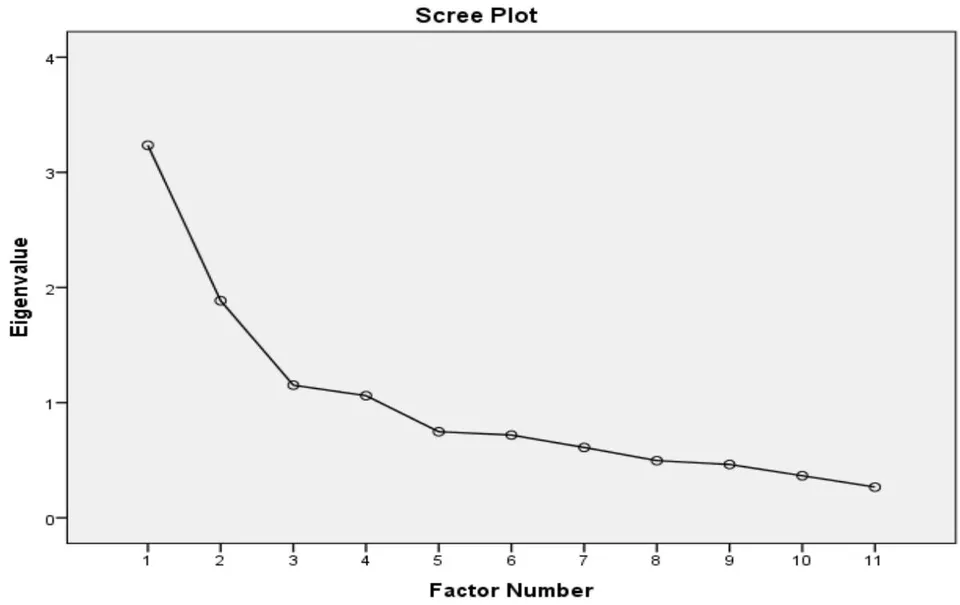
According to Cattell (1966), to Plot the visual exploration of a graphical representation of the Eigen values, a screen plot is used. A screen plot shows steep curve pattern which is followed by a bend and then a flat or horizontal line. The above screen plot indicates that four factors (information availability, convenience, ease of use, attractive website design) explain most of the variability to identify and narrate factors that affect online customers' satisfaction in Bangladesh as a distinct break happens at factor 4. The remaining factors are less considerable as it contributes very small portion of the variability to identify and narrate factors that affect online customers' satisfaction in Bangladesh.
d) Regression Analysis
Results of Regression Analysis: Given the prediction-oriented nature of the study and the relatively small sample size compared with the number of variables, the multiple regression model was used to validate the measures and test the research model. Multiple regression model has the special abilities to handle relatively small sample sizes. (Chin et al., 2003). The
Goodness of fit:
purpose of this analysis is to measure the relative influence of each independent variable on the dependent variable.
Hypothesis: : ( : ) (There is no relationship between online customers' satisfaction and after sales service, customization, delivery quality, ease of use, website design, information availability, product quality, convenience, fair price, online security).
: (There is significant relationship between online customers' satisfaction and after sales service, customization, delivery quality, ease of use, website design, information availability, product quality, convenience, fair price, online security).
Variables:
- Dependent Variable: Online Customers' Satisfaction.
- Independent Variables: After Sales Service, Customization, Delivery Quality, Ease of Use, Website Design, Information Availability, Product Quality, Convenience, Fair Price, Online Security.
Table 13: Model Summary
| Model | R | R Square | Adjusted R Square | Std. Error of the Estimate | Durbin-Watson |
| 1 | .751a | .564 | .541 | .508 | 1.945 |
Explanation
Interpretation of R: Here, the Value of . There is a high degree of positive correlation among the independent & dependent variables.
Comment on model fitting: Here, the value of or .
56.4% variation in the dependent variables can be explained by the regression model.
Interpretation of Adjusted : Here, the value of adjusted or . Adjusted suggested that, addition of the other independent variables does not make a contribution in explaining the variation in the dependent variable.
The Value of is . This indicates that a moderate correlation between dependent and independent variables. Thus, the null hypothesis ( ), that there is no relationship between online customers' satisfaction (dependent variable) and after sales service, customization, delivery quality, ease of use, website design, information availability, product quality, convenience, fair price, online security (independent variables) is rejected and alternative hypothesis , that there is a significant relationship between online customers' satisfaction (dependent variable) and after sales service, customization, delivery quality, ease of use, website design, information availability, product quality, convenience, fair price, online security (independent variables) is accepted.
The Durbin-Watson statistics value is always between 0 and 4. A value of 2 means that there is no autocorrelation in the sample. Values approaching 0 indicate positive autocorrelation and values toward 4 indicate negative autocorrelation. In our analysis, the value is 1.945 which is close to 2. Hence, it can be said that autocorrelation does not exist among independent variables or multicollinearity is unlikely a problem.
| Model | Unstandardized Coefficients | Standardized Coefficients | t | Sig. | ||
| B | Std. Error | Beta | ||||
| 1 | (Constant) | .558 | .316 | 1.768 | .079 | |
| Product Quality | .268 | .046 | .368 | 5.886 | .000 | |
| Information Availability | .037 | .050 | .042 | .746 | .457 | |
| Convenience | .055 | .058 | .052 | .949 | .344 | |
| Ease of Use | .053 | .047 | .062 | 1.129 | .260 | |
| Website Design | .047 | .051 | .053 | .932 | .353 | |
| Delivery Quality | .164 | .050 | .184 | 3.294 | .001 | |
| Online Security | .066 | .051 | .085 | 1.283 | .201 | |
| Fair Price | .124 | .043 | .174 | 2.917 | .004 | |
| Customization | -.038 | .049 | -.044 | -.766 | .445 | |
| After Sales Service | .147 | .042 | .197 | 3.480 | .001 | |
a. Dependent Variable
Regression Equation: Using the values from the given coefficients table, the regression equation becomes as follows:
Comment on Significance: Standardized coefficients calculated for each predictor variables, showing the percentage of variation in the dependent variable caused by the independent variables. It can be said that product quality (.000), delivery quality (.001), after sales
Testing the overall significance:
service (.001), and fair price (.004) are significant at level. The standardized beta coefficient of product quality is 0.368 or which means product quality is an important variable that affects online customers' satisfaction in Bangladesh. The next important variable is delivery quality. The standardized beta coefficient of delivery quality is 0.184 or satisfaction of online customers' in Bangladesh. The next important variable is after sales service, which affects 0.197 or satisfaction of online customers' in Bangladesh. And the last important variable is fair price, which affects 0.174 or satisfaction of online customers' in Bangladesh.
| Model | Sum of Squares | Df | Mean Square | F | Sig. | |
| 1 | Regression | 63.483 | 10 | 6.348 | 24.589 | .000b |
| Residual | 49.054 | 190 | .258 | |||
| Total | 112.537 | 200 | ||||
The statistical significance of the value is calculated through the value of F statistics. The value of F statistics, in this study, is calculated at 0.05 significance level and the F value has been found to be 24.589 which is highly significant at 0.000 level.
VI. IMPLICATIONS, CONCLUSION AND SCOPE FOR FUTURE RESEARCH
a) Implications of the study
Customers consider numerous things while they engage in online purchasing. In many cases, a limited number of things lead to online purchasing, but there may have some other weak factors that also affect online purchasing. The following issues can help to formulate policies for online vendors to increase online customers' satisfaction:
From the factor analysis part, information availability, convenience, ease of use and attractive website design have been found as very significant factors. Online product sellers or service providers should handle these issues with greater importance. They should ensure that adequate information about product or service is available in the website, the website needs to be convenient, they should ensure ease of use of system and they should ensure attractive website design.
Online product sellers should make sure that they are not asking higher price of a product compared to its physical stores' price as customers compare the prices of products with the prices at physical stores.
Online product sellers or service providers should increase connectivity with the customers and should contact with them in person and listen to them carefully whenever customers place any complaints. In most of the time, customers get after sales service when they purchase from physical stores. There is a perception among the customers that they will not be provided with after sales service if they purchase from online product sellers. So, online product sellers should provide after sales service to the customers if there arises any problem.
Any redundancy of information about the product or service in the website should be avoided.
Customers need to be ensured that confidentiality of their information is strictly maintained. They should be assured that their credit card and other personal information are safe and secured.
b) Conclusion
Today's era is an era of technology. A large number of people of all ages use online platforms to purchase products or to take service. Customers consider numerous factors while purchasing products online. Information availability, convenience, ease of use and attractive website design have been found as very significant factors for purchasing products online from factor analysis segment. Any problem related to these factors can create bad impacts on the minds of customers while purchasing products online. So, the online product sellers should try to monitor these factors and take corrective measures whenever something goes wrong. The research findings can provide a thorough understanding about the variables that affect the satisfaction of online buyers in Bangladesh.
c) Limitations and Scope for Future Research
This study worked with limited number of variables only. Addition of some new variables may generate few more factors that might affect online customers' satisfaction in Bangladesh. Thus the findings cannot be generalized. Therefore, future research should be conducted on a larger scale by considering more online products purchasers from all over Bangladesh to authenticate the findings of the study. It was not possible for the current researcher to adapt more advanced statistically accepted techniques, as it requires a lot of monetary and non-monetary resources. The author recommends that more studies may be viable in this field.