
I. INTRODUCTION
Rainfall continues to be the most important climatic parameter with the highest spatial and temporal variability over most part of the world. The distribution of precipitation over the earth is considerably more complex than of insolation or air temperature (Oguntoyinbo, et al., 2015).
Rainfall is an element of weather. Other elements of weather include temperature, humidity, wind, cloud and sunshine. It is the collective pattern of expression of these elements overtime that becomes described as the climate of a place. Climate is the synthesis of the weather in a given place over a period of at least 30 years. Thus climate is the "average weather" together with the variability from the average.
Apart from precipitation, temperature is probably the most talked about weather element. Temperature can be defined in terms of movement of molecules such that the more rapid the movement the higher the temperature. More usually, it is defined in relative terms on the basis of the degree of heat a body has. Temperature is the condition that determines the flow of heat from one substance to another. Heat moves from a body having higher temperature to a body lower temperature. The temperature of a body is therefore its degree of hotness as measured by the thermometer. Various scales are used to express temperatures, these include the Fahrenheit, centigrade and Kelvin or absolute temperature scale is used. In most countries temperatures are now measured in centigrade or Celsius scale and in some applications the Kelvin or absolute temperature scale are used. Temperatures on Fahrenheit (F) scale can be converted to Celsius (C) using the simple equation of the form. C =5/9(F-32) (Ayoade, 2004, p.29).
Climate refers to the characteristics condition of the atmosphere deduced from repeated observation over a long period. It includes considerations of departures from average (i.e. variability's), extreme conditions and the probabilities of occurrences of a given weather condition (Ayoade, 2013).
Rainfall is an important aspect in both climatic and geomorphologic studies. Amount of rainfall in a given region is influenced by many factors; among them are relief, wind and direction (relative to coastal orientation) and distance from the ocean. For instance, where humid air masses moving across a region are forced to rise over highlands/plateau, it tends to bring about instability resulting in heavy rainfall (Ayoade, 2013). The geographical local of Nigeria, its topographical variations and latitudinal extent dictate the behaviour of the climatic types and its characteristics in the region.
Rainfall in Nigeria is the most variable climatic element both in its spatial and temporal distribution as areal-precipitations which is the average depth of precipitation over a specific area calculated on timescales on a storm, seasonal, or annual basis vary from place to place in the country.
David (2010) observed in southern Nigeria that at the onset and end of rainy season, the rains are in the form of heavy showers of short duration, staring with maximum intensity of up to 75mm/hour and more, declining the intensity after about 30 minutes when the sun gives way to a steady downpour with a lower intensity of about 12.5mm/hour and less. The amount of rainfall has also been show to be at variance with intensity. For instance, David (2010) found that rainfall intensity is not associated with amount or number of raindrop size. The intensity and time period of the rainfall event determine the amount of rainfall in an area at a time and the average amount of rainfall in an area over years, sum up to the mean annual rainfall of the area. Also with the spread of rainfall characteristics, the productivity of the area may be determined. The nature of rainfall over northern Nigeria is highly variable and the variability includes rainfall amount, time and duration, intensities and spatial coverage.
According to the Nigeria Meteorological Agency (NIMET, 2012), Nigeria's climate is characterized by strong latitudinal zone with which becomes progressively drier as one moves northwards from the coast. Rainfall is the key climatic variable and there is a marked difference between the wet and dry seasons in most areas. Rainfall characteristics in Nigeria have been examined for dominant trend notably by (IPCC, 2014).
II. MATERIALS AND METHODS
a) Types and Sources of Data
The types of data required and used were mostly secondary data. The annual rainfall and temperature data of Lafia station for the period of 2001 to 2015 covering a 15 years period. The data was obtained from Nigeria Meteorological Agency (NIMET, 2015) in Lafia. The data on crop yield were data collected from documented crop output by the Nasarawa Agricultural development Project (NADP) Lafia for the period of 2001 to 2015.
b) Method of Data Analysis
The study employed the annual rainfall variability and annual temperature patterns and annual yam yield were analyzed using Pearson correlation, linear regression, ANOVA, and coefficients Beta for the period of 15 years (2001-2015).
III. RESULTS AND DISCUSSION
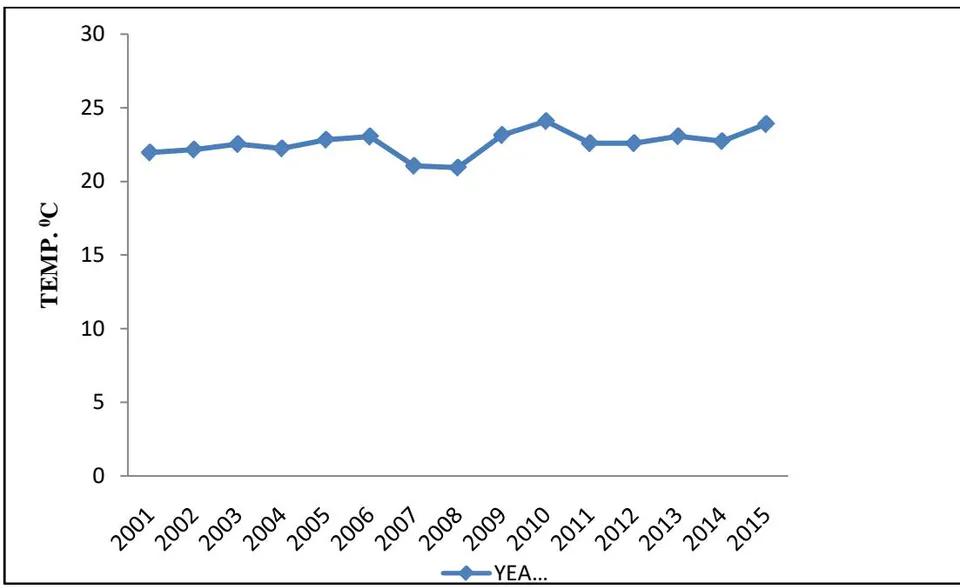
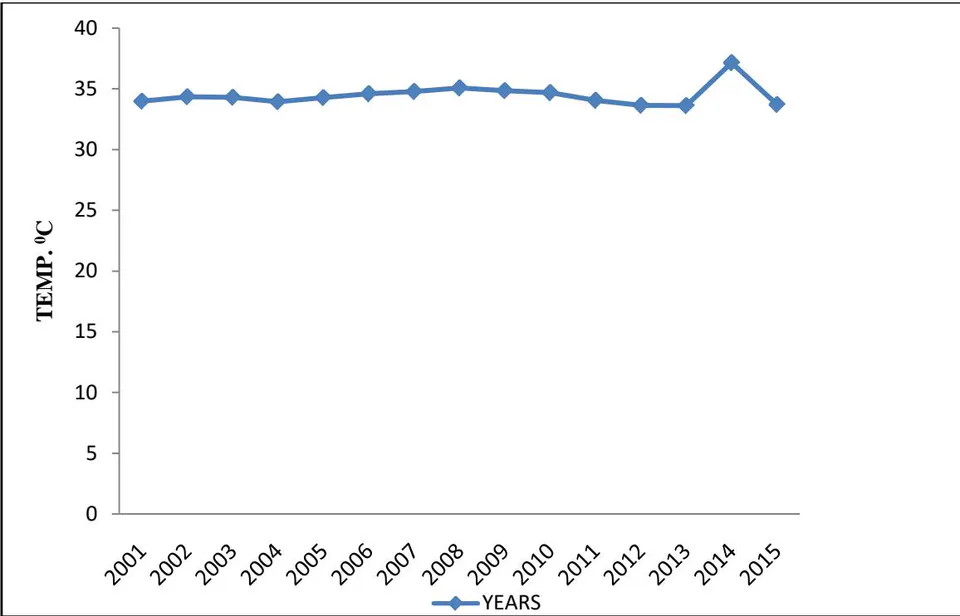
a) Mean Rainfall, Average Minimum And Maximum Temperature Trend In Nasarawa State Table 1: Annual rainfall data, average minimum and maximum temperature data (2001-2015)
| S/No. | Average Min. Temperature | Average Max. Temperature | Mean Rainfall (Mm) | Years | Total Rainfall (Mm) |
| 1. | 21.96 | 33.97 | 117.86 | 2001 | 1414.1 |
| 2. | 22.16 | 34.34 | 99.39 | 2002 | 1192.7 |
| 3. | 22.52 | 34.3 | 117.23 | 2003 | 1406.8 |
| 4. | 22.24 | 33.93 | 108.75 | 2004 | 1305 |
| 5. | 22.83 | 34.27 | 107.55 | 2005 | 1290.7 |
| 6. | 23.03 | 34.58 | 109.99 | 2006 | 1319.9 |
| 7. | 21.05 | 34.76 | 132.97 | 2007 | 1595.7 |
| 8. | 20.93 | 35.06 | 94.83 | 2008 | 1138 |
| 9. | 23.13 | 34.84 | 132.97 | 2009 | 1595.7 |
| 10. | 24.09 | 34.67 | 110.16 | 2010 | 1322 |
| 11. | 22.58 | 34.03 | 104.46 | 2011 | 1253.6 |
| 12. | 22.58 | 33.63 | 110.39 | 2012 | 1324.7 |
| 13. | 23.06 | 33.61 | 104.91 | 2013 | 1259 |
| 14. | 22.73 | 37.13 | 111.00 | 2014 | 1332 |
| 15. | 23.88 | 33.71 | 105.08 | 2015 | 1261 |
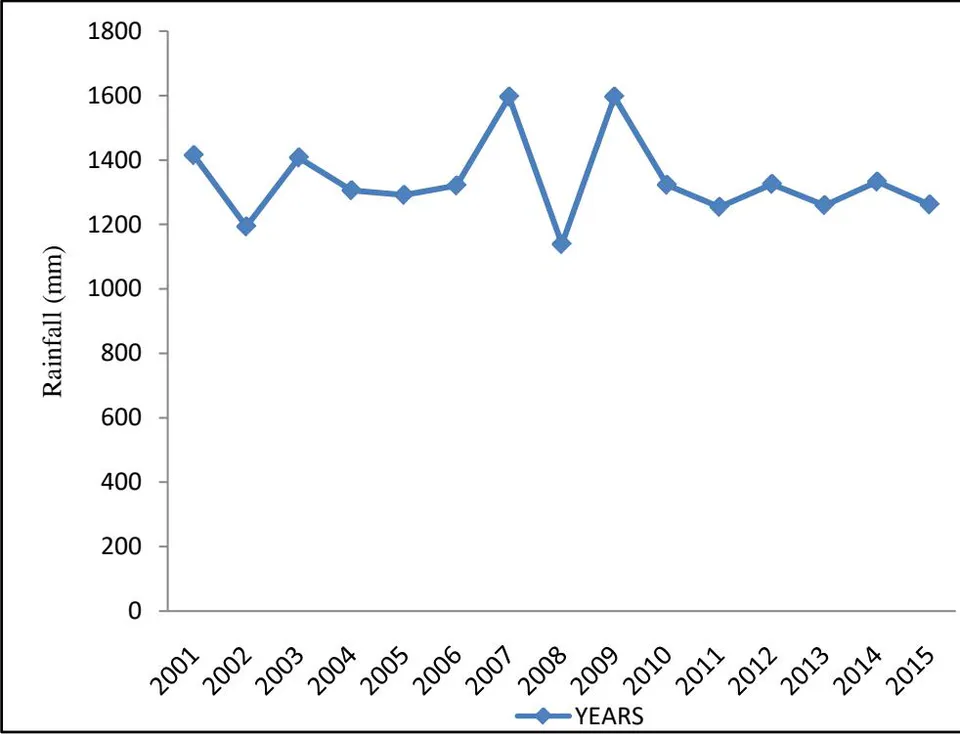
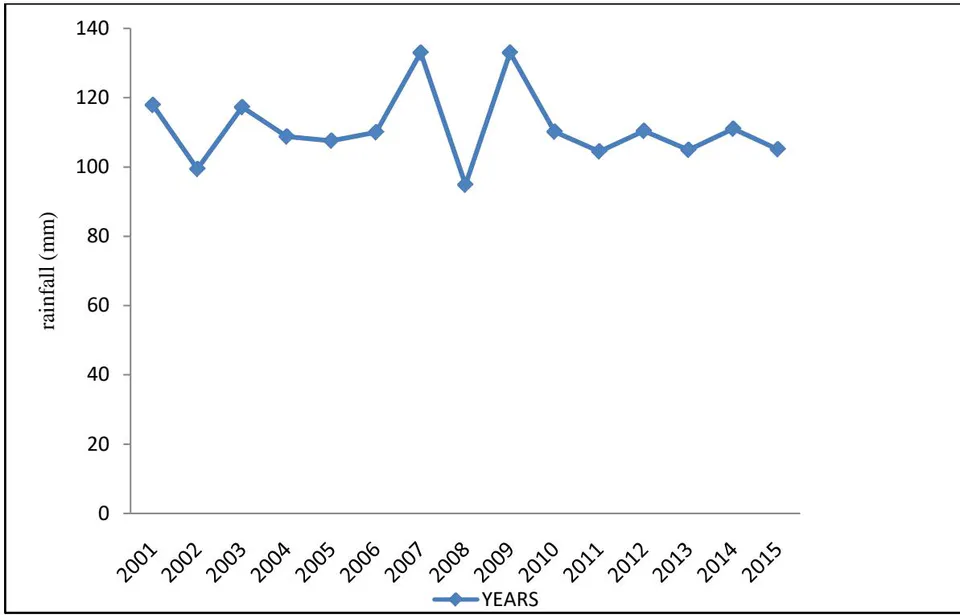
Table 1 give the detailed account of the rainfall variability trend in Nasarawa State. The annual rainfall amount portrays an increasing trend at the first year and a decreasing trend in the second year. There was an increase in annual rainfall from 2000 to 2010 followed by a slight decrease in 2002 of 1192.7mm. An increase in the amount of annual rainfall in Nasarawa state was then recorded in 2003. Then a decrease is recorded between 2004 and 2005 respectively. The amount of rainfall increase again in year 2006 and 2007 from 1319.9mm to 1595.7mm respectively. In the second decade, the amount of rainfall increase again in year 2009 while a fall occurred in 2010. The annual rainfall experience increase as from 2014-2015.
It is obvious from the graph, that rainfall indeed experienced a number of variations over the period under consideration (2001-2015) with the highest rainfall (1595.7mm) occurring in 2009. This means that even though rainfall seems to be increasing over the period, the trend of increase is generally, gradual. This gives an indication of an increase in rainfall in the stud area. The implication of the inter-annual rainfall analysis shows that the increase in rainfall in the district has the potential to affect crops which do not need abundant rainfall.
The general increase in annual rainfall may be due to the fact that, some years recorded very high rainfall which might have generally influenced the overall trend. For instance, from the graph the annual rainfall recorded in the area showed the following figure; 2003 (1406.8mm), 2007 (1595.7mm), 2009 (1595.7mm). This means that even though annual rainfall increase over the period, the rate of increase was gradual. The high recordings of rainfall in some periods of the years may be detrimental to crop production especially those which do not need excessive rainfall. It is also important to note that the high amount of rainfall in the area as observe by the study is related to temperature which invariably increase evapo transpiration rates.
b) Trend in Yam Yield (Mt/Ha) in Nasarawa State
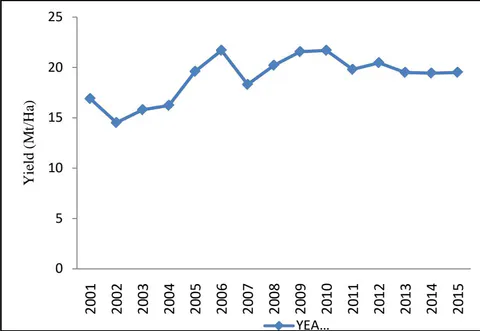
Figure 1 shows the yam yield (Mt/Ha) trend in the state. The yam yield shows increasing trend in production over the periods under consideration from (2001-2015). From the result, the yearly yam yield shows an increase yield in 2010 and 2009, 21.69 and 21.56 respectively a slight drop of yield was recorded in the year 2002 of 14.52 (Mt/Ha). There was an increase in annual yam yield again in 2012 of 2015 (Mt/Ha) follow by a decrease in 2013. An increase in the quantity of yam yield was recorded in 2008, 2009, and 2010 respectively; there was a drop in yield of yam in 2011. Increase was recorded in the annual yam yield in Nasarawa state in 2012 of 20.46 (Mt/Ha). In the second decade, the amount of yam yield increase in 2012, then a steady yield of 19.46-19.51 which increase 2014 to 2015 with a slight variation between them.
It is clear from the yam yield of Nasarawa state over the period (2001-2015), there was a steady increase, with 21.69 being the highest recorded trend of the annual yam yield, also shows a steady increase from 2007 (18.31), 2008 (20.21), 2009 (21.56) and 2010 (21.69). This means that the annual yam yield in Nasarawa state is gradual over the years in view.
It may also mean that the high and favourable rainfall recorded, might be a reason for the increase of the yam yield in the study area.
| S/N | Year | Annual Rainfall | Yield (Mt/Ha) |
| 1. | 2001 | 1414.1 | 16.90 |
| 2. | 2002 | 1192.7 | 14.52 |
| 3. | 2003 | 1406.8 | 15.80 |
| 4. | 2004 | 1305 | 16.23 |
| 5. | 2005 | 1290.7 | 19.60 |
| 6. | 2006 | 1319.9 | 21.69 |
| 7. | 2007 | 1595.7 | 18.31 |
| 8. | 2008 | 1138 | 20.21 |
| 9. | 2009 | 1595.7 | 21.56 |
| 10. | 2010 | 1322 | 21.69 |
| 11. | 2011 | 1253.6 | 19.80 |
| 12. | 2012 | 1324.7 | 20.46 |
| 13. | 2013 | 1259 | 19.50 |
| 14. | 2014 | 1332 | 19.43 |
| 15. | 2015 | 1261 | 19.51 |
| Total = 285.21 | |||
| S/N | Area (000ha) | Years | Yield (Mt/Ha) | Production (000mt) |
| 16. | 79.48 | 2001 | 16.90 | 1343.21 |
| 17. | 62.00 | 2002 | 14.52 | 900.00 |
| 18. | 61.75 | 2003 | 15.80 | 975.66 |
| 19. | 67.79 | 2004 | 16.23 | 1235.74 |
| 20. | 68.67 | 2005 | 19.60 | 1315.64 |
| 21. | 76.49 | 2006 | 21.69 | 1657.23 |
| 22. | 96.85 | 2007 | 18.31 | 1773.39 |
| 23. | 79.77 | 2008 | 20.21 | 1612.15 |
| 24. | 95.41 | 2009 | 21.56 | 2057.11 |
| 25. | 118.46 | 2010 | 21.69 | 2568.99 |
| 26. | 203.96 | 2011 | 19.80 | 4039.06 |
| 27. | 205.40 | 2012 | 20.46 | 4203.66 |
| 28. | 219.70 | 2013 | 19.50 | 4283.98 |
| 29. | 225.00 | 2014 | 19.43 | 4370.60 |
| 30. | 223.70 | 2015 | 19.51 | 4365.20 |
| Year | Rainfall (mm) | Max. Temperature (°C) | Min. Temperature (°C) | Yam Yield (Mt/Ha) |
| 2001 | 1414.1 | 407.7 | 263.5 | 16.90 |
| 2002 | 1192.7 | 412.1 | 265.9 | 14.52 |
| 2003 | 1406.8 | 411.6 | 270.2 | 15.80 |
| 2004 | 1305 | 407.1 | 266.9 | 16.23 |
| 2005 | 1290.7 | 411.2 | 273.9 | 19.60 |
| 2006 | 1319.9 | 414.9 | 276.3 | 21.69 |
| 2007 | 1595.7 | 417.1 | 252.6 | 1.31 |
| 2008 | 1138 | 420.7 | 251.1 | 20.21 |
| 2009 | 1595.7 | 417.1 | 252.6 | 18.31 |
| 2010 | 1322 | 416 | 289.1 | 21.69 |
| 2011 | 1253.6 | 408.3 | 270.9 | 19.80 |
| 2012 | 1324.7 | 403.5 | 270.9 | 20.46 |
| 2013 | 1259 | 403.5 | 276.7 | 19.50 |
| 2014 | 1332 | 445.6 | 272.7 | 19.43 |
| 2015 | 1261 | 404.5 | 286.6 | 19.51 |
Pearson Correlations Table 1 Table 5: Correlations
| Yam yield | Rainfall | Max temperature | Min temperature | ||
| Yam yield | Pearson Correlation | 1 | |||
| Sig. (2-tailed) N | 15 | ||||
| Pearson Correlation | .079 | 1 | |||
| Rainfall | Sig. (2-tailed) N | .779 | |||
| Pearson Correlation | 15 | 15 | |||
| Max temperature | Correlation | .168 | .131 | 1 | |
| Sig. (2-tailed) N | .551 | .642 | |||
| Pearson Correlation | 15 | 15 | 15 | ||
| Min temperature | Correlation | .413 | -.053 | -.129 | 1 |
| Sig. (2-tailed) N | .126 | .851 | .646 | ||
| 15 | 15 | 15 | 15 | ||
IV. CORRELATION ANALYSIS
Table 4.5 shows a weak positive correlation between rainfall and yam yield in Nasarawa state, to examine these two variables, the Pearson correlation analysis was used. The result of the correlation was established to be 0.079 which connote a weak positive relationship between rainfall and yam yield in Nasarawa state this accounts for 10% to 20% of relationship between rainfall and yam yield, while that of maximum temperature was established to be 0.168 which connote a weak positive relationship between maximum temperature and yam yield but it's a bit higher than that of rainfall, this means that rainfall does not have a direct effect on yam yield but it could be considered with other factors as soil type, seed, soil pH etc, that of minimum temperature was established to be 0.413, which connote a weak positive relationship, but in this case the value is higher than that of both rainfall and maximum temperature. This is to say yam yield require little rainfall and minimum temperature to produce a bountiful harvest, or it could also require a high amount of rainfall and a high or maximum temperature in order to be balanced and produce high yield of crops (yam). Note that too much rainfall and minimum temperature can cause the decay of yams as well as seeds on the farm.
a) Test of Hypothesis
We reject the Null hypothesis and accept the alternative hypothesis from the above it was found that there was a weak positive relationship between rainfall, temperature and yam yield in Nasarawa state. Hence, the Null hypothesis was rejected and the alternative hypothesis accepted.
: Null hypothesis rejected
: Alternative hypothesis accepted
b) Effect of Rainfall and Temperature on Yam Yield in Nasarawa State
To assess the effect of some of the climatic variables (rainfall and temperature) on crops (yam yield) linear regression analysis was used to investigate the ability of the two climatic variables (rainfall and temperature) to predict yam yield.
| Model | Unstandardized coefficients | Standardized coefficients | t | Sig. | |
| B | Std. Error | Beta | |||
| (Constant) | -27.411 | 30.049 | -.912 | .381 | |
| Rainfall | .001 | .005 | .075 | .279 | .785 |
| Max temperature | .046 | .057 | .215 | .799 | .441 |
| Min temperature | .095 | .057 | .445 | .662 | .125 |
Table 6 show the effects of rainfall and temperature variations on yam yields in Nasarawa state for the period of 2001 to 2015. The table revealed that rainfall variation has a weak positive effect of on yam production within the period investigate.
The major variable responsible for huge variation in yam yield was minimum temperature, it had a highly positive significant relationship in the production of yam in the study area between 2001 and 2015. Table 6.6 shows the standardized coefficients Beta of 0.445 for minimum temperature as the highly weak positive significant relationship with a t' value of 1.662 which is approximately 2.062.
Coefficients: that of the coefficients, the standardized coefficient beta for mini temperature is 0.445, while the t=1.662 which is approximately 2.062 so as you can see it's a good one and it is very high. This means there is high production of yam (crops) with minimum temperature and rainfall.
c) Relationship between Rainfall and Yam Yield in Nasarawa State
The relationship between rainfall and yam yield in Nasarawa state were examined using correlation analysis shown in table 4.5 and 4.6 the result of the analysis revealed that rainfall has the weakest positive significant relationship with yam yield in the study area. The implication of this is that the higher the rainfall and temperature, the higher the yield of yam. The possible reason for the fairly correlation between rainfall and yam production may also be attributed to nature of soil, fertility rate some times.
d) Yam Yield
Figure 3 shows the yield over the period (2001-2015) of Lafia, Nasarawa state with a steady increase, and 21.69 being the highest recorded of the trend annually which shows an increase in the yam yield in the study area; it also portrays a combination of factors favourable, which may have positive effect on yam yield example (temperature, soil, fertility, soil, porosity level and moisture content amongst others) this means that these factors at equal and favourable condition have a positive effect on yam yield, in the state. Therefore this support the study of Kalibbala (2011) who asserts that favourable climatic and nutrient value have a positive effect on yam yield. However we observed a decrease in yam yield in the wake of high soil temperature and pH of the soil.
V. CONCLUSION
The study has established that, there is slight variability in rainfall which translates into variability in some year as indicated by the rainfall data in Lafia, Nasarawa state. Data were collected for a period of 15 years from the Nigeria Meteorological Agency (NIMET) and Nasarawa Agricultural Development Program (NADP), Lafia. The data also shows a steady increase in yam yield in the study area with an variance within the years under review (2001-2015). The results from the study showed a weak positive significant effect in rainfall with unreliable rainfall distribution over the investigated period (2001-2015). The study identified poor yield as a major negative effect of rainfall variability on yam yield, though a weak significant amount. The effect of rainfall on yam yield may also vary depending on types of yam species and seasonal properties and length of days in which the crop is permitted.