The Paris Agreement, signed in 2015 during the 21st Conference of the Parties (COP21) of the United Nations Framework Convention, was an important milestone for the establishment of ambitious and concrete climate goals, especially with regard to the reduction of greenhouse gas emissions effect and energy security. To this end, several countries committed to achieving the goals established by the Paris Agreement are in the energy transition phase from a carbon-based matrix to a cleaner, low-carbon matrix. In this context, green hydrogen emerges as a clean energy alternative, being a favorable option to move towards the current process of decarbonization of global economies (in particular, industries and the mobility sector) and to achieve the goals established in the Agreement. Brazil, in turn, prepared an energy expansion plan to compose its matrix with a 45% share of clean energy by the year 2030, however, with regard to the use of green hydrogen as a direct source of energy or energy vector, the country is still in the incipient stage of research and development (R&D).
## I. INTRODUCTION
Several countries are in the process of transitioning from a carbon-based matrix to a low-carbon matrix, in response to the Paris Agreement, which set an ambitious goal of limiting global temperature rise below $2^{\circ}\mathrm{C}$ above pre-industrial levels, with the intention of limiting it to $1.5^{\circ}\mathrm{C}$. Faced with this challenge, green hydrogen (GH2) emerges as a clean energy alternative, being a favorable option to advance in the current process of decar bonization of global economies (especially in the industrial sector). Countries with ambitious goals have shown interest in green hydrogen, produced from electricity generated through renewable sources, based on the electrolysis process (Delgado and Costa, 2021).
The European Union (EU) strongly supports the implementation of a hydrogen-based energy system as one of the main tools to achieve the European Green Deal and the COP21 Paris Agreement. With this, it aims to help the EU reach the carbon neutrality target by 2050, in addition to limiting dependence on hydrocarbons (Díaz-Cuevas et al., 2021). Germany, which consolidated its National Hydrogen Strategy in June 2020, has reinforced funding of more than €1 billion to be applied to research into the use of hydrogen under the German Decarbonisation Programme.
Elsewhere in the world, China is emerging as a hydrogen-producing powerhouse, expecting hydrogen to make up $10\%$ of the energy share by 2050 in order to meet its ambitious climate targets: zero carbon by 2060 and "peak carbon" by key sectors by 2030. Australia is investing significantly in the development of the hydrogen industry, implementing a range of policy initiatives and funding R&D projects. In 2018, the CSIRO Organization (Commonwalth Scientific and Industrial Research Organisation) published the National Hydrogen Roadmap, which set out the blueprint for the development of the Hydrogen industry in Australia and outlines numerous actions across the hydrogen value chain. Soon after, in 2019, the COAG group (Council of Australian Governments - Energy Council Hydrogen) of the Government of Australia publishes the National Hydrogen Strategy report, which also establishes an action plan to develop the hydrogen industry. Numerous countries have recently implemented or are initiating and developing hydrogen strategies in order to satisfy their considerable energy demand.
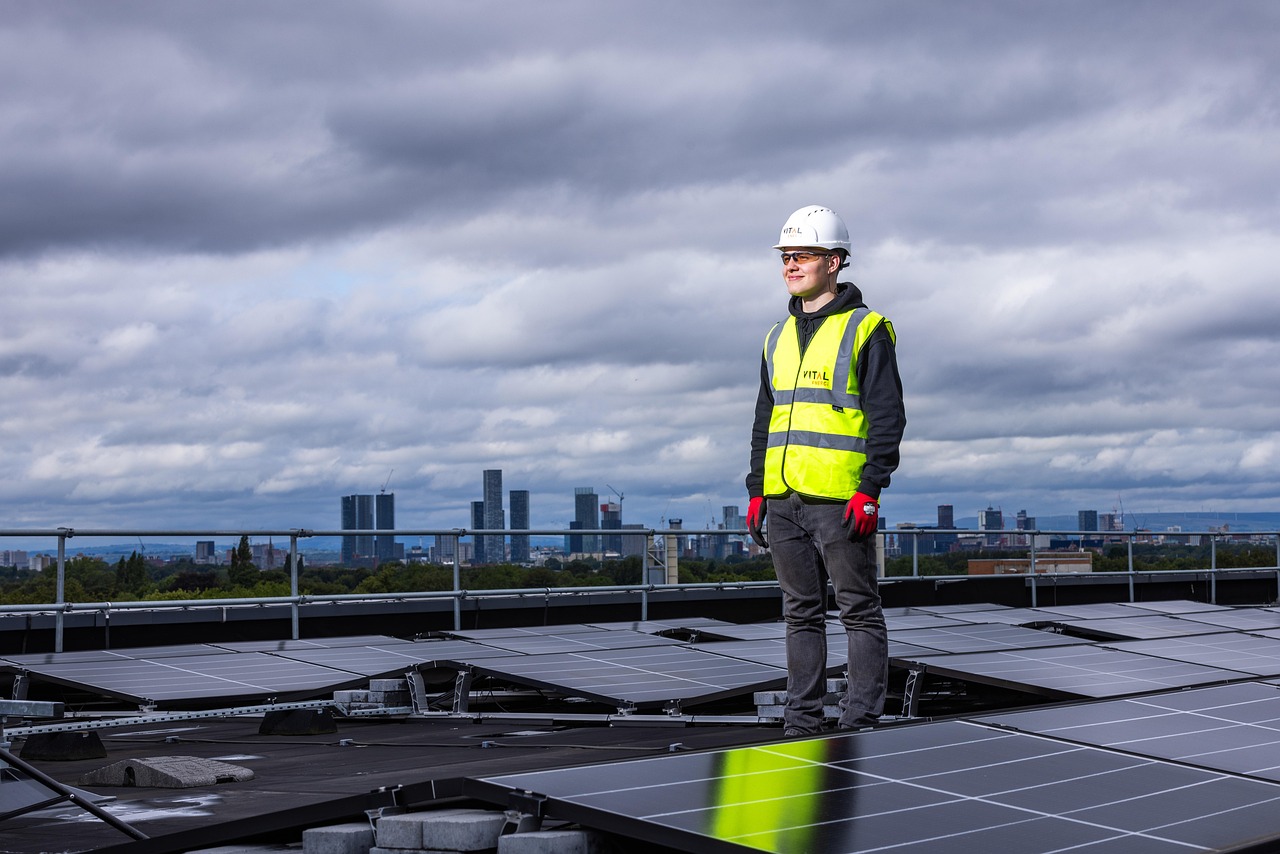
Brazil does not demand, nor does it have current plans to replace fossil fuels, however, its role is extremely important for the GH2 transition in other countries, since multinationals such as Engie and Shell have been creating pilot projects in the Complexo do Pecém (Ceará) and Porto de Açu (Rio de Janeiro), precisely because of the contribution of renewable energies (such as wind and solar photovoltaics) in the country - a key point for understanding Brazil's role in the GH2 production chain. The country has large areas with high solar irradiation and favorable wind speeds that help make wind and solar photovoltaic energy viable economic alternatives for the world stage. Other factors include lower investments and lower cost of grid integration relative to the global average due to the large share of hydropower (De Lara and Richter, 2023).
In this scenario, European countries gain access to the renewable energy that projects need for GH2 production, and Brazil, in addition to exporting sustainable fuel to other countries, expands a wide range of economic opportunities, as it will open a new market with global suppliers, and may in the future be a leader in GH2 exports due to the energy matrix of renewable origin, also being a new source of employability and income for Brazilian citizens (Matos and Bitencourt, 2023).
For this reason, it is of great importance to develop studies on GH2 in Brazil, as it is a clean energy alternative, but still with challenges to be overcome, especially those related to the supply chain (transport and storage). In this context, this article aims to evaluate the conditions and viability of Port Terminals for the storage and disposal of hydrogen, knowing that the production of its "green" form will occur in the near future and that developing the mapping of the port environment it is fundamental. For this purpose, qualitative and quantitative criteria will be considered, thus identifying the resistance to the flows that make up the green hydrogen supply chain.
## II. GREEN HYDROGEN SUPPLY CHAIN
Supply chain is defined as the management of a network of organizations connected from the point of origin (upstream) to the point of consumption (downstream), in the different processes and activities that produce value in the form of products and services for the final consumer (Asgari et al., 2016). Chopra (2011) explains that the supply chain encompasses all stages involved, directly or indirectly, in fulfilling a customer order. That is, it does not only include manufacturers and suppliers, but also transport, storage of products, productive assets, forwarding to distributors and availability to retailers where the final customer will make the purchase.
The supply chain of the GH2 industry encompasses the activities of receiving (raw material - RM), production (with the manufacture of the main raw material, GH2 and inputs, renewable energy and catalysts), storage and distribution of the produced hydrogen. The hydrogen chain is analyzed in three stages, namely: Upstream stage, Midstream stage (intralogistics - "producer") and Downstream. The Upstream stage comprises renewable energy sources, energy generation equipment such as wind turbines and solar photovoltaic systems, water treatment systems and energy distribution networks. The Downstream stage constitutes the transport of H2 and, finally, the Midstream stage is characterized by being the production and storage stage of GH2.
According to Donato (2012), the same analysis is carried out on the supply chain of the oil, gas and biofuels industry and which should be used to define the green hydrogen supply chain, and as a proposal cites the same classification of logistics for oil, gas and biofuels:
i. Upstream Stage: it concerns the inputs, the way in which the raw material and inputs arrive at the company. In this sense, it involves issues such as the relationship with suppliers, crucial for an assertive purchase of raw materials, aiming to meet the customer's needs. ii. Midstream Stage: It is the stage where the raw material is transformed into a finished product, encompassing activities such as preparation, packaging, production line supply, maintenance support, removal of packaging residues from the line and the like. iii. Downstream Stage: it is how the product or service will reach the customer, such as defining the means of storage, displacement and delivery. At this point, it is essential to value punctuality, quality and adequate quantity.
An important factor that should characterize the GH2 Supply Chain is that it be a chain centered on low carbon emissions, not just in the production of H2, but throughout the chain, especially in means of transport. Caglayan et al. (2021), employs a green approach for the fully renewable use of the European energy system by 2050, for which he foresees the use of gas pipelines to transport liquid hydrogen. This approach is being considered in defining the GH2 chain in Europe. Lamb et al. (2019), present the possibility of transporting and storing H2 in ammonia (NH3) and identify advantages of this method such as the absence of carbon, high efficiency of ammonia production and use of existing infrastructure around the world.
## III. PORT ENVIRONMENT
Ports are defined by Valentine and Gray (2002) as complex organizations with a variety of inputs and outputs, embodied in different physical, logistical, access and legal aspects. This makes analysis and direct comparison between apparently homogeneous ports difficult. For Bichou and Gray (2005), ports are multipart and complex organizations in which institutions and functions normally intersect at several levels.
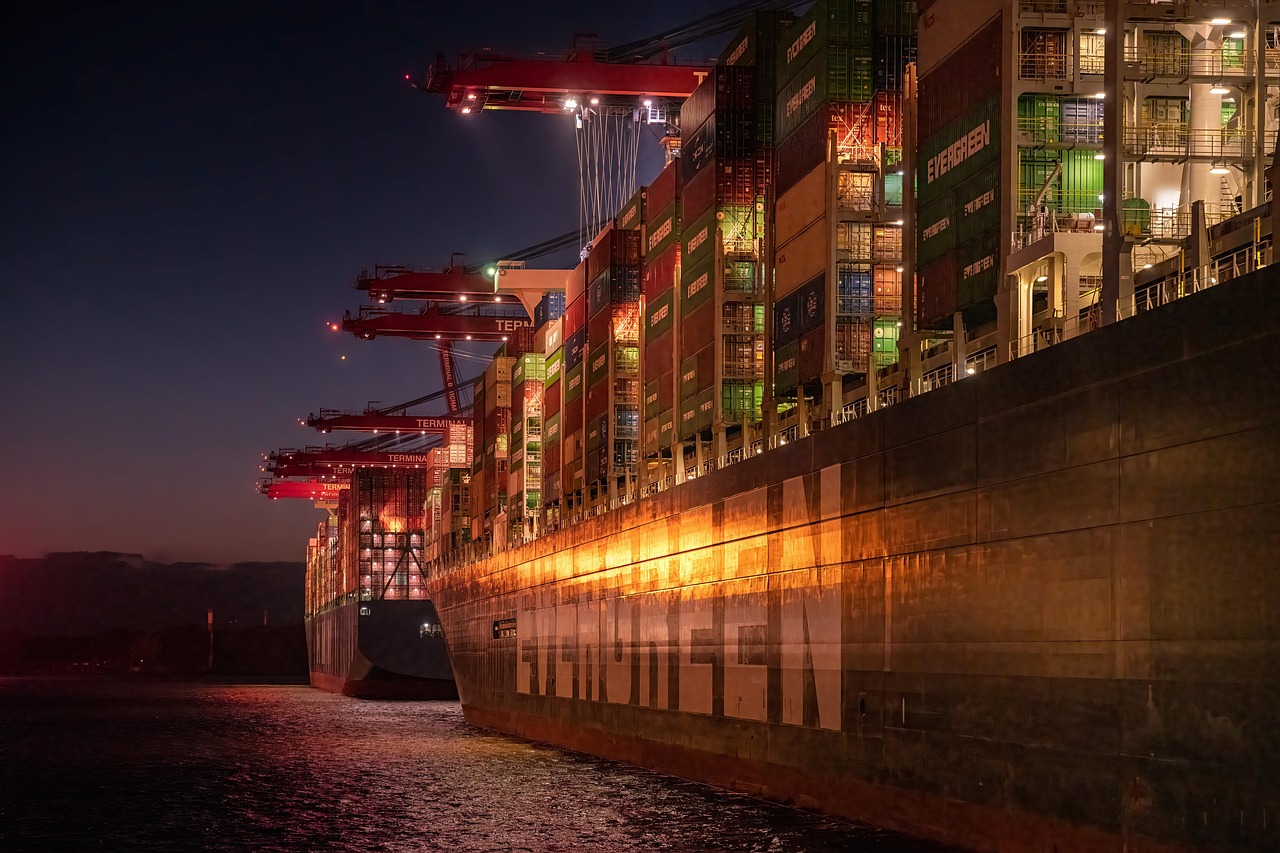
According to Tolley and Turton (1995), ports are a component of the physical distribution of goods and offer a sea-land interface for export and import activities. This sea-land interface is directly related to the port environment analysis process, which involves different actors in the logistics chain, such as: i) shipowners - define the ports of call on each route; ii) shippers (exporters/importers) - define the ports of loading and unloading in their operations; iii) cargo agents - support and assist exporters and importers in the port process.
With regard to export and import criteria, the analysis of the port environment takes into account the "green mode" agreed between the parties and it is clear that the analysis varies according to the perspective of the actor to be considered.
The original port sites, commonly located adjacent to city center areas, have become obsolete. This was also marked by changes in the spatial relationships between Porto and the urban core. Numerous opportunities for converting port facilities to other uses (seaside parks, housing and commercial developments) have been created.
In the current stage of increasing specialization of cargo handling, both in export and import, the increase in the size of ships and the growing demand for space for cargo handling and storage in port areas, resulted in the implementation of port activity in places far from the urban coastal facilities. From the initial port location, the ports were modernized, as a result of the evolution of maritime technology and improvements in cargo handling technology.
In this context, three major phases identified so far in the port development process involve reconfiguration, expansion and specialization. Colonetti (2017) mentions that the port environment can be analyzed in four phases: Hinterland, Umland, Vorland and Foreland.
For the purposes of this work, the analysis of the port environment will be carried out, classifying it in criteria. The criteria considered are diverse and can be classified into two types: quantitative criteria and qualitative criteria. Quantitative criteria are those that can potentially be measured and compared objectively, and are grouped into three major phases: Hafen Stadt; Umland and the Vorland. Qualitative criteria include subjective influences, such as Hinterland, Foreland, Inland and Gotland that can be developed between users and ports. All will be detailed below:
### a) Quantitative Criteria
Hafen stadt: is the proximity of a city to a port (urban port). In this case, the road distance is considered.
Umland: it is the physical environment of the Port, that is, its facilities, infrastructure and other factors that characterize its operation (quality of services, tariffs, etc.). In this case, the number of operational installations is considered.
Vorland: it is related to a greater or lesser distance of Porto from the main shipping routes. Considering that the main commercial maritime routes are in the Northern Hemisphere, it can be assumed that the ports in the Northeast of Brazil have a higher Vorland than the other national ports. In this case, the nautical distance is considered.
### b) Qualitative Criteria
Hinterland: it is the region that surrounds a port center, from which cargoes come, that is, the port's business potential generator (the area of influence is a subjective criterion as it depends on the radius to be considered).
Foreland: it is the scope of commercial relations of a Port. It is the ease and competence of a Port to relate with its partners.
Inland: this term refers to the location of a Port in relation to the coastal region, that is, if it is located inland (located in a river region) or on the sea coast.
Gotland: this is the concept where a direct land connection is established between a land cargo terminal (related to inland areas, also known as dry ports) and the coastal port.
## IV. RESISTANCE TO LOGISTICS FLOWS
According to Ammer (2013), the path of least resistance to a flow is the easiest method, way, or course of action. The path of least resistance is described as the physical path that provides the least opposition to the movement of a given object or entity, among a set of alternative paths (Neto, 2004). In physics, the path of least resistance is preferably taken by objects moving in a system. For example, water flowing downward follows the path of least resistance, since it is pulled downward by gravity.
In the early 20th century, the first works on the study of flows of goods began to appear, and in the thirties, more precisely in 1927, Ralph Borsodi published the book "The Distribution Age", in which he addressed the topic of physical flows of materials, under the name "distribution". For Rogers and Tibben- Lembke (2001), physical transport flows can be either forward or reverse. There is, therefore, an interesting parallel between the flows studied by physics and the flows of product distribution.
The load driving systems are accelerated by the driving force of the conveyor units, but due to flow resistances, they eventually reach an average speed that is inversely proportional to the channel resistances. As mentioned by Neto (2004), resistance to logistical flows in transport channels is the set of restrictions or inhibitions, both physical, economic, and legal, that affect the performance of the logistical flow and that occur during circulation on transport routes.
In attempts to implement an export flow of GH2, companies are running into logistical difficulties. Scholars call these difficulties in implementing a flow as resistance to logistical flows. The more steps the chain needs for its development, the greater the resistance to flows.
The number of levels in the supply chain defines the resistance to the logistical flows of the chain under analysis, as shown in Table 1.
Table 1: Number of levels x level of resistance to flows
<table><tr><td>Number of Chain Levels</td><td>Resistance Level</td><td>Description</td></tr><tr><td><= 3 levels</td><td>Low Resistance</td><td>Chain with a low number of levels greater operational ease.</td></tr><tr><td>> 3 < 5 levels</td><td>Medium Strength</td><td>Chain with a medium number of levels, attention to communication between the links in the chain.</td></tr><tr><td>> 5 levels</td><td>High Resistance</td><td>Highly resistant chain, provision must be made for communication between the links in the chain.</td></tr></table>
Source:Marinho et al.,2023
What will classify the level of resistance to logistical flows will be the fluidity of communication between the links. Thus, the greater the number of levels identified, the greater the number of contacts between the links, therefore, the greater the resistance to flows.
This happens because the restrictions or inhibitions, both physical, economic, and legal, that affect the performance of the logistic flow, and that occur during the circulation in transport routes, tend to increase according to the number of actors that are involved in commercial negotiations within the chain. As a consequence, a delay in inter-network communication occurs, and thus, promotes a reduction in the flow speed of logistics channels. Thereby, the fewer steps the chain needs for its development, the lower the resistance to flows.
## V. METHODOLOGY
Port environment analysis is the exercise of evaluating each stage of the process, assuming the premise that the Port is a business environment and not a non-profit state enterprise. This process can be analyzed from the perspective that a series of products is being delivered to customers. The analysis process requires an evaluation of each step, from the analysis of the potential load generator in the region, to the moment the company buys the product (port service) to the moment the company receives/ships the loads.
From the traditional port, with side piers adjacent to the city center, the ports adequacy for export/import of H2 becomes a product of the evolution of port technology with improvements in loads handling and safety. After carrying out the analysis of the port environment, three main conclusions can be identified in the Port under analysis: reconfiguration, expansion and/or specialization. The three conclusions portray well the stage that the Port is in, especially the traditional ones. However, the proposed model presents some weaknesses to explain the adequacy of the contemporary port environment.
The analysis of the port environment begins with the mapping of the process steps that should not be reduced or neglected, in order to reduce the time needed to perform the analysis without sacrificing product quality or service level. A conceptual perspective on the port environment for H2 exports could be made by analyzing the seven criteria for the port environment analysis.
### a) Criteria for the Analysis of the Port Environment
## i. Hinterland
When analyzing the port hinterland for the GH2 industry, one must analyze the scope of load generation in the region where the Port is installed, taking as an example the generation of similar products such as petrochemicals, petroleum products, natural gas production, grains, cellulose and other products that, if produced in large scale, make the hinterland of a region viable.
In the analysis of a port's hinterland, the verification of how the loads will be received must also be taken into account. The analysis of the land coverage, the rail connections, and the availability of good roads and pipelines are fundamental for the development of the port hinterland.
## ii. Hafen Stadt
This criterion analyzes whether a city effectively has an urban port in operation. It defines the interaction, safety, proximity, and interconnection of the city with the Porto. In the stadthafen analysis, the risk that the loads may exert on urban settlements must be considered.
## iii. Umland
The better structured a region is, the higher the quality of the service provided tends to be. To this end, the physical environment of the region must be analyzed, i.e., the facilities and infrastructure of other factors that characterize logistics operations (quality of services, tariffs, etc.). This criterion considers the infrastructure (roads, railroads, pipelines, airports, docks, draft, etc.), the superstructure (handling equipment, terminals, warehouses, etc.), the operation costs (tariffs and transport expenses), and the quality of the services provided. It is necessary to verify the existence of this logistical infrastructure, since it will act in the flow of the final product.
## iv. Vorland
The vorland is related to the logistics coverage area, that is, it is related to a greater or lesser distance from the main transportation routes. When planning a certain supply or flow route, the closest points that have the capacity to receive/offload the loads are chosen as the stopping point. Considering that the main trade routes are close to the coastal region, we can assume that the metropolitan region of Salvador has a higher vorland than the other regions.
## v. Foreland
It is the scope of commercial relations in a region, that is, the projection in which the region maintains commercial ties, it is the set of markets reached through connections and partnerships. The foreland represents the commercial coverage area of a micro-region in relation to the others. This aspect is related to the set of markets reached, through installed companies, with which there are regular commercial exchanges.
## vi. Inland
This criterion analyzes the location of a port in relation to the coast, i.e., if it is in a fluvial region, located located inland. This argument takes advantage of the advantages of intermodal transport and the improvements in transhipment efficiency of port terminals. These inland ports are integrated with the hinterland services of coastal ports through transport services by land, barges, or smaller ships. This is particularly the case along the Rhine/Scheldt delta, where fluvial barge ports act as feeders to delta ports such as Rotterdam and Antwerp.
## vii. Gotland
This is the concept where a direct land connection is established between a land load terminal and the coastal port. These are the inland areas, also known as dry ports. Land terminals tend to have more space available where it can provide a variety of logistics services, such as consolidation and deconsolidation, for load shipped from coastal ports that are normally congested. The developed hinterland favors Port to havea good gotland.
### b) Analysis of the Port Environment
Logistics for the oil, gas and biofuels industry classifies the stages of transport, storage and distribution into upstream, midstream and downstream stages. Table 2 brings an analysis through a framework, carried out in the logistical stages of the H2 production chain.
In Table 2, it is evident that the transport only occurs in the upstream step. Storage, on the other hand, occurs in three stages and distribution is a process that occurs only in the downstream stage.
Table 2: Framework for Analyzing the Logistical Complexity for H2 Production
<table><tr><td>logistical steps</td><td>Location</td><td colspan="3">Upstream</td><td>Midstream</td><td colspan="2">Downstream</td></tr><tr><td colspan="2">Acquisition</td><td>Selection of suppliers</td><td>Transport selection</td><td>Route selection</td><td>Receipt and conference</td><td>Storage</td><td>Preservatio n</td></tr><tr><td colspan="2">Transport</td><td>Transport selection</td><td>transport of raw material</td><td>Transportof inputs</td><td>Internal</td><td>-</td><td>-</td></tr><tr><td colspan="2">Storage</td><td>Selection of suppliers</td><td>Raw material</td><td>Inputs</td><td>intermediate storage</td><td>GH2 Storage</td><td>-</td></tr><tr><td colspan="2">Distribution</td><td>-</td><td>-</td><td>-</td><td>pipeline</td><td>Pipeline</td><td>Transporte long haul</td></tr></table>
Table 3: Framework for Analyzing the Port Environment: Analysis Criteria x GSC Levels
<table><tr><td colspan="2">Green Supply Chain Levels</td><td>Level 3 (physical)</td><td>Level 2 (physical)</td><td>Level 1 (physical)</td><td>Level 0 (physical)</td><td>Level 1 (physical)</td><td>Level 2 (Physical)</td><td>Level I 3 (virtual)</td></tr><tr><td rowspan="7">Analysis of the port environment</td><td>Hinterland</td><td>Proximity to the RM supplier</td><td>Proximity to the supplier of inputs</td><td>stock management</td><td>Buffer need</td><td>customer proximity</td><td>-</td><td>Use of SCM software</td></tr><tr><td>Hafen Stadt</td><td>access leadtime</td><td>Risk inloading</td><td>storage risk</td><td>Risk of keeping a buffer</td><td>Risk in loading</td><td>Trans. risk.</td><td>Use of risky software</td></tr><tr><td>Umland</td><td>Infrastructure for RM</td><td>Infra. for inputs</td><td>Infra. to store PM and Supplies</td><td>Infra. For buffer</td><td>Infra. for storing GH2 in port area</td><td>Infra. to drain the GH2</td><td>Use of ERP software</td></tr><tr><td>Vorland</td><td>Lead Time for accessing RM and Inputs</td><td>Lead Time, obtaining RM</td><td>Lead time inputs</td><td>Infra. for Port</td><td>Lead Time to store</td><td>Transport Lead Time</td><td>Use of ERP software</td></tr><tr><td>Foreland</td><td>Supplier management</td><td>Relationship with suppliers</td><td>Relationship with transp.</td><td>Relationship with port partners</td><td>Relationship with the consumer market</td><td>Relationship with transporter</td><td>Use of SCM software</td></tr><tr><td>Inland</td><td>-</td><td>Infra. for access</td><td>Distance from the port to the urban center</td><td>Port</td><td>ease of movement</td><td>-</td><td>Use of ERP software</td></tr><tr><td>Gotland</td><td>-</td><td>Infra. for access</td><td>Land connection between Porto and the customs area</td><td>coastal port</td><td>Land connection between coastal port and customer</td><td>-</td><td>Use of ERP software</td></tr></table>
Table 4, on the other hand, shows the resistance to existing flows in the movement of GH2 in relation to each criterion of analysis of the port environment.
Table 4: Framework for Analysis of CS Resistance Levels for GH2
<table><tr><td rowspan="2">Resistance to Flows</td><td>Location</td><td colspan="3">Upstream</td><td></td><td colspan="3">Downstream</td></tr><tr><td>Chain Level</td><td>Level 3 RM supplier</td><td>Level 2 RM Transport</td><td>Level 1 Supply inputs</td><td>Level 0 Port</td><td>Level 1 GH2 Storage</td><td>Level 2 GH2 Transport</td><td>Level 3 Virtual</td></tr><tr><td colspan="2">CO2 emission</td><td>yes</td><td>yes</td><td>yes</td><td>yes</td><td>yes</td><td>yes</td><td>No</td></tr><tr><td colspan="2">Use of fossil fuel in transportation</td><td>yes</td><td>yes</td><td>yes</td><td>yes</td><td>yes</td><td>yes</td><td>No</td></tr><tr><td colspan="2">NON-renewable energy consumption at SC</td><td>yes</td><td>yes</td><td>yes</td><td>yes</td><td>yes</td><td>yes</td><td>No</td></tr><tr><td colspan="2">congestion</td><td>yes</td><td>yes</td><td>yes</td><td>yes</td><td>No</td><td>yes</td><td>No</td></tr><tr><td colspan="2">legislation</td><td>yes</td><td>yes</td><td>yes</td><td>yes</td><td>yes</td><td>yes</td><td>No</td></tr></table>
## VI. RESULTS AND DISCUSSION
The supply chain for GH2 must be mandatory green, as it makes no sense to define a product that will be classified as green in a conventional supply chain.
### a) Green Logistics Chain Analysis for a Port Environment
To analyze the port environment for the export of green hydrogen, a framework was developed that simultaneously correlates the following concepts:
- Criteria for analyzing a Port: evaluation of the following criteria: Hinterland, Stadthafen, Foreland, Umland, Vorland, Inland and Gotland.
- Analysis of resistance to flows: identification of bottlenecks and other impediments to GSCflows.
- Green supply chain analysis: identification of GSC levels by stage: Upstream, Midstream, and Downstream.
The complexity of the GSC is analyzed at each stage of the production process and presented in Table 2. With the information displayed in Table 3, it is possible to classify the length of the chain according to the number of existing levels (the more levels, the longer the chain), within each criterion related to the Port environment.
The analysis criteria for the port environment must vary according to the perspective of the actor (link in the chain) to be considered. In this way, with the Framework, the user will carry out quantitative analyzes on the route factors; of cost; and of service; and qualitative such as flexibility and ease of use, marketing efforts of the port, commercial maturity of the port, personal contacts and level of cooperation that can be developed between the user and the port.
In the end, the analysis of the various frameworks that make up the port environment will present the user with a more comprehensive view of the flows that offer resistance to the export of H2 in a given port, identifying the dimension of the physical environment (related to the infrastructure for the storage of H2 and cargo handling, the potential area of greatest influence, the commercial scope and the most optimized routes, in relation to distance (shorter supplier-port and port-customer mileage) and logistical costs (which is influenced by the commercial maturity of the technologies used in the transport and storage of H2).
The analysis model proposed for the green hydrogen supply chain, presented in Table 3 and Table 4, demonstrates that this chain has seven levels, with an intermediate level. The model also proposes that the user use Table 4 to compare the levels of carbonization present along the chain under study.
The user must fill in the framework according to the possibility of using carbon at each level and infer whether it meets the total or partial environmental requirement, or if the item does not fit. From there, it is possible to identify the level of carbonization of the chain under study and infer whether this chain is in the process of being decarbonized.
### b) Influence of the Concepts used in the Analysis of the Port Environment
First, the concepts used seek to explain the recent increase in port terminals that act mainly as transshipment centers in extensive hub-and-spoke maritime and collection and distribution networks. The increase in the availability of loading has triggered changes in the size of ships, in the schedule of regular services and in the structure of liner shipping. The carriers and alliances have redesigned their liner shipping networks by introducing new types of end-to-end services, round-the-world services and pendulum services, especially on major east-west trade routes. As a result, a new generation of terminals has emerged along east-west shipping routes in unlikely places, far from the immediate hinterland that has historically guided port selection. These locations were selected to serve the market flow of the continents and for transshipment at transit points on trade routes.
The port terminal depends heavily, sometimes completely, on traffic flows that are generated at a distance by the interaction of widely places separated and stimulated by the location or intermediation of the port en route. The model does not provide a basis for explaining the emergence of hub terminals in 'offshore' or island locations with limited or non-existent site hinterlands.
## VII. CONCLUSION
This work aimed to analyze the validity of the analysis model of the Port environment for the export of H2. That is, to verify the opportunity to carry out the export of a new fuel in order to allow an energy transition at a lower cost or with less environmental impact, given the elimination of carbon emissions in CS, as this chain is green.
The logic behind the analysis of the port environment is that the more flexible a port is, the more likely it is to respond to customer needs. Several other benefits can be identified with companies that undergo an analysis of the port environment. These benefits include the analysis of whether the Port environment generates enough load to supply large ships.
The analysis of the port environment through the mapping of the port process, through the upstream, midstream and downstream stages, allows the identification of resistance to logistical flows, since a Port with resistant logistical flows implies high management costs, which can make operations unfeasible. Another way to identify resistance to flows is by measuring the length of the supply chain, and the longer the length (number of levels) the greater the resistance to flows in this chain.
With the process mapping, a graph is assembled that identifies all the participants in the chain, including the suppliers of inputs and raw materials that the company uses to manufacture or produce the product. Participants' interactions are also mapped, such as how raw materials arrive at the H2 production process.
An assessment of the three frameworks and the interactions between the players helps the evaluator determine where changes can be made to improve flow. Port environment analysis works hand in hand with supply chain management as product or information flows from one point in the process to another. Logistic analysis and analysis of the port environment allow business managers or owners to determine how to speed up the transfer of goods and information at each point in the
Generating HTML Viewer...
References
23 Cites in Article
C Ammer (2013). O Dicionário Americano de Expressões Idiomáticas.
R Ballou (2011). Logística Empresarial: Transportes, administração de materiais e distribuição física.
K Bichou,R Gray (2005). A critical review of conventional terminology for classifying seaports.
D Caglayan (2021). Concepção robusta de um futuro sistema europeu de aprovisionamento energético 100% renovável com infraestruturas de hidrogénio.
Sunil Chopra (2011). Gestão de cadeia de suprimentos: estratégia, planejamentoe operações.
A Colonetti R (2017). Unknown Title.
D De Lara,M Richter (2023). Hidrogênio verde: a fonte de energia do futuro.
Fernanda Delgado,Agnes Costa,Da (2021). Os caminhos do país na construção da economia global do hidrogênio.
D' Este,G Meyrick,S (1992). Seleção de transportadores em um comércio de balsas ro/ro, parte 1 -fatores de decisão e atitudes.
P Díaz-Cuevas,B Haddad,M Fernandez-Nunez (2021). Energy for the future: Planning and mapping renewable energy. The case of Algeria.
V Donato (2012). Logística para a Indústria do Petróleo, Gás e Biocombustíveis.
K Korpela,J Hallikas,T Dahlberg (2017). Transformação da cadeia de suprimentos digital em direção à integração blockchain.
K Lamb,M Dolan,D Kennedy (2019). Amônia para armazenamento de hidrogênio; Uma revisão da decomposição catalítica de amônia e separação e purificação de hidrogênio.
C Marinho,V Donato,C Vieira,M Andrade (2022). Analysis of the port environment for the export of green hydrogen.
J Matos,C De,G Bitencourt (2023). Os investimentos em hidrogênio verde no mundo e o papel do Brasil nesta cadeia produtiva.
V Neto (2004). Transportes na América do Sul: desenvolvimento e integração continental, ligação ferroviária Atlântico-Pacífico.
D Rogers,R Tibben-Lembke (2001). Um exame das práticas reversas.
N Salmão,R Bañares-Alcántara Amônia verde como vetor energético espacial: uma revisão.
Evane Menezes (2021). GESTÃO SUSTENTÁVEL DE ENERGIA: ESTUDO DA CAPTAÇÃO DE ENERGIA SOLAR POR MEIO DE PAINÉIS FOTOVOLTAICOS COMO FORMA ECO SUSTENTÁVEL NO CONSUMO DE ENERGIA NO FÓRUM DO RECIFE.
B Silva,Szekely (2005). Sistemas de informação logística: uma análise de soluções de software para coordenação da cadeia de suprimentos Gestão Industrial & Sistemas de Dados.
R Tolley,B Turton (1995). Sistemas de transporte, política e planejamento: uma abordagem geográfica.
V Valentine,R Gray (2002). Uma abordagem organizacional para a eficiência portuária.
No ethics committee approval was required for this article type.
Data Availability
Not applicable for this article.
How to Cite This Article
Chrislaine do Bomfim Marinho. 2026. \u201cAnalysis of the Port Environment for the Export of Green Hydrogen\u201d. Global Journal of Science Frontier Research - G: Bio-Tech & Genetics GJSFR-G Volume 23 (GJSFR Volume 23 Issue G1).
Explore published articles in an immersive Augmented Reality environment. Our platform converts research papers into interactive 3D books, allowing readers to view and interact with content using AR and VR compatible devices.
Your published article is automatically converted into a realistic 3D book. Flip through pages and read research papers in a more engaging and interactive format.
Our website is actively being updated, and changes may occur frequently. Please clear your browser cache if needed. For feedback or error reporting, please email [email protected]
Thank you for connecting with us. We will respond to you shortly.