## I. INTRODUCTION
In recent decades there has been an increase in chronic non-communicable diseases (CNCDs), such as cardiovascular diseases (CVD), cancer, diabetes, and chronic respiratory diseases, being the leading causes of death today, responsible for just over $70\%$ of deaths worldwide. Among the main risk factors, these share behaviors that can be modifiable, such as tobacco use, physical inactivity, poor diet, and harmful alcohol consumption, which in turn contribute to overweight, increased blood pressure, altered plasma lipids, and, finally, diseases (1). Moreover, CVD is the leading cause of death in Brazil and worldwide, accounting for about one-third of these deaths (2).
The association between blood pressure and weight gain has been reported, with a higher prevalence of arterial hypertension (AH) in obesity, representing a public health problem. Another consideration involving overweight is the arrangement of fat cells that, when concentrated in the abdominal region, has a vast association with cardiovascular events, and abdominal adiposity measurements can be used as a complementary approach to determine the risk of premature death (3).
It is also noteworthy that the presence of abdominal adiposity implies the development of metabolic alterations, among them, glucose intolerance and hypertriglyceridemia, considered important factors in the emergence of metabolic syndrome (MS). These increase morbidity and mortality due to atherosclerotic disease and its consequences, such as coronary artery disease (4).
The evaluation of adiposity is necessary for cardiometabolic risk assessment and prevention of obesity comorbidities. Although the diagnostic imaging technique is the most efficient method to evaluate adiposity, it becomes limited due to its high cost and methodological difficulties, which justifies the use of alternative, low-cost methods with greater clinical applicability. In this context, anthropometry stands out, in which adiposity is evaluated by means of isolated measurements, such as waist circumference (WC), or associated, from the construction of other anthropometric indicators such as body mass index (BMI), waist-to-height ratio (WHtR) and conicity index (CI) (5).
The anthropometric indicators of adiposity can establish important relationships with cardiometabolic diseases, namely, the AH and MS (6). Both anthropometric indicators of total obesity (BMI) and central obesity (WHtR and Cl) are predictors of AH (7), but in metabolic abnormalities, the indicators of abdominal obesity stand out, such as a classic measure, WC (8). The correlation between the anthropometric indicators is also observed, such as between WC and BMI, these being the indicators that were most associated with the other anthropometric variables and also with alterations in plasma lipids (9).
Studies aiming to understand and diagnose more easily and reliably the possible relations of adiposity indicators with health problems are of utmost importance. Moreover, CVD and metabolic diseases are of great concern in developing countries. Considering the importance of adiposity in cardiometabolic risk and the verification of the accuracy of anthropometric indicators in this context, the objective of this study was to evaluate the capacity of anthropometric indicators in the identification of adiposity and MS in patients with AH.
## II. MATERIALS AND METHODS
### a) Study design
This is a cross-sectional study, with nonprobability sampling design and convenience sampling, with patients seen at the nutrition, cardiology, endocrinology, and metabolism outpatient clinics of the University Hospital of the Federal University of Grande Dourados, in the state of Mato Grosso do Sul, Midwest region of Brazil.
Patients who attended the outpatient units in that period and met the selection criteria for the study were invited to participate, and were included upon agreement and signing of an informed consent form. The individuals who were not participating in the study had ample and unrestricted access to care. The present study was approved by the Research Ethics Committee for human beings of Anhanguera-Uniderp, opinion number 838.813 (CAAE 35187214.8.0000.5161), according to Resolution No. 466/2012 of the Health Council - Ministry of Health.
### b) Sample
Inclusion criteria were age $\geq 20$ years, overweight, BMI $\geq 25\mathrm{kg} / \mathrm{m}^2$ in adults (10) and $\geq 28$ kg/m2 in the elderly (age $\geq 60$ years) (11), diagnosis of AH under drug treatment. Pregnant and puerperal women, indigenous patients, those whose anthropometric measurements were not possible, patients unable to communicate verbally, and those who did not present complete medical records with the data necessary for the study were excluded.
Initially 313 patients were selected in the research period, and after checking the eligibility criteria, 208 patients were invited to participate, with refusal of 27 patients. In total, 181 patients aged between 20 and 80 years were evaluated.
### c) Data collection
Data was collected through personal interview and from electronic medical records of outpatient care. Socio-demographic (age, gender, marital status, education, race/color), economic (monthly income), lifestyle (physical activity, tobacco and alcohol use), clinical (diagnosis of chronic diseases and medication use) and anthropometric (weight, height and waist circumference) data were collected. The practice of physical activity was assessed according to personal reports: "no physical activity" (no/sedentary), "physical activity" (yes), when individuals exercised, according to recommendations of the Institute of Medicine/Food and Nutrition Board (12).
To collect anthropometric measurements we used the methodology recommended by the Food and Nutrition Surveillance System - SISVAN (13), which is an information system that aims to monitor the nutrition and feeding conditions of the Brazilian population. For the measurement of height (m), the patient was positioned barefoot and with head free of adornments, in the center of the equipment (stadiometer). He stood upright, with arms extended along his body, head up, looking at a fixed point at eye height. The individual placed his heels, calves, buttocks, scapulae, and the back of his head (occipital region) against the Alturexata® precision multifunctional portable stadiometer, whose maximum height is $200\mathrm{cm}$, with a $0.5\mathrm{cm}$ interval.
To measure the weight (kg), the individual was standing in the center of the base of the scale, barefoot and with minimal clothing. Balmak Actilife® digital scales were used, with a capacity of up to 200 kg. The WC (cm) was measured with the individual standing, with the tape positioned at the midpoint between the last rib and the iliac crest. For this measurement the Sanny "Starret® tape measure was used, inelastic and flexible, with an accuracy of 0.1 cm.
### d) Anthropometric indicators of adiposity and metabolic syndrome classification
The anthropometric indicators analyzed were BMI, WC, WHtR, and CI. BMI, obtained by dividing weight by squared height $(\mathrm{kg} / \mathrm{m}^{2})$, was classified for the adult population (20-59 years) into pre-obesity (BMI between 25 and $29.9~\mathrm{kg} / \mathrm{m}^2$ ) and obesity $(\mathrm{BMI} \geq 30\mathrm{kg} / \mathrm{m}^2)$ (10). For the elderly (60-80 years) different BMI cut-off points were used, and in this population the values proposed by the Pan American Organization were considered (11): pre-obesity $(\mathrm{BMI} \geq 28$ and $< 30~\mathrm{kg} / \mathrm{m}^2)$ and obesity $(\mathrm{BMI} \geq 30\mathrm{kg} / \mathrm{m}^2)$. WC was classified as high when greater than $80~\mathrm{cm}$ for women and greater than $90~\mathrm{cm}$ for men (14).
To calculate the WHtR, we used the WC divided by height - both in centimeters - with a result ranging from values close to zero (0) to one (1). The cut point considered was 0.5, a single cut point for both sexes, used in the evaluation of excess abdominal fat and risk of obesity comorbidities (15).
The CI was determined by means of weight, height and WC measurements, expressed in meters, using the following mathematical equation: $\mathrm{CI} =$ waist circumference
#### 0.109 $\frac{\sqrt{weight}}{Height}$
The cut-off point considered was 1.25 for men and 1.18 for women, which configures a high risk for CVD and metabolic diseases (16).
The presence of two or more of the following components was considered for the diagnosis of MS: WC ( $>90$ cm for men and $>80$ cm for women); triglycerides $\geq 150\mathrm{mg/dL}$ and/or men HDL-c $< 40\mathrm{mg/dL}$ and women HDL-c $< 50\mathrm{mg/dL}$ or use of hypolipemians; blood pressure $\geq 130/85\mathrm{mmHg}$ or use of anti-hypertensives; serum glucose $>100\mathrm{mg/dL}$ (including type 2 diabetes mellitus (DM), as suggested by the International Diabetes Federation (IDF) (14).
### e) Statistical Analysis
The IBM SPSS (Statistical Package for the Social Science) Statistics®, version 22 and MedCalc Statistical®, version 17.4, software was used for statistical analysis. To test the best fit for normal distribution the Kolmogorov-Smirnov test was applied. Categorical data in percentages were analyzed by the chi-square test or Fisher's exact test. Continuous data were described as mean and standard deviation and analyzed by the t-student or Mann-Whitney test. The capacity of anthropometric indicators in the identification of adiposity, as well as their sensitivity and specificity, was evaluated by the ROC curve (Receiver Operating Characteristic), using BMI as the test index. Furthermore, the ROC curve was applied to analyze the capacity of anthropometric indicators in predicting MS, applied to the groups of patients with and without MS. The predictive power of anthropometric indicators regarding adiposity and MS was tested in subgroups consisting of gender (men/women), age (adults/elderly) and race/color (white and non-white individuals). Significant differences were considered to be values of $p \leq 0.05$.
## III. RESULTS
A total of 181 patients were evaluated, most of them female $(69.6\%)$, with a mean age of $53.3 \pm 12.6$ years. As for socio-demographic characteristics, patients were predominantly adults $(69.1\%)$, non-white $(58.6\%)$, had attended elementary school or were not literate $(67.9\%)$, had a monthly income of 1 to 3 minimum wages $(80.1\%)$, and had a partner $(65.2\%)$. Regarding lifestyle habits, most were nonsmokers $(61.3\%)$, did not consume alcoholic beverages $(75.7\%)$, and did not practice physical exercise $(79.0\%)$ (Table 1). When assessing the presence of diseases, $47\%$ had DM, $44.2\%$ had dyslipidemia, and $71.8\%$ had MS. MS was associated with increasing age $(p = 0.003)$ and male gender $(p = 0.002)$ (Table 1).
The mean BMI was $36 \pm 6.4\mathrm{kg} / \mathrm{m}^2$, $81.2\%$ were classified as obese, and all patients had increased WC and WHtR. The mean values of WC $(p = 0.014)$, WHtR $(p = 0.047)$ and CI $(p < 0.001)$ were higher in the group of patients with MS, while the BMI value $(p = 0.721)$ did not differ between these groups. High cardiometabolic risk, according to the CI, was observed in $93.9\%$ of patients, being present in $97.7\%$ of those with MS $(p = 0.001)$ (Table 2).
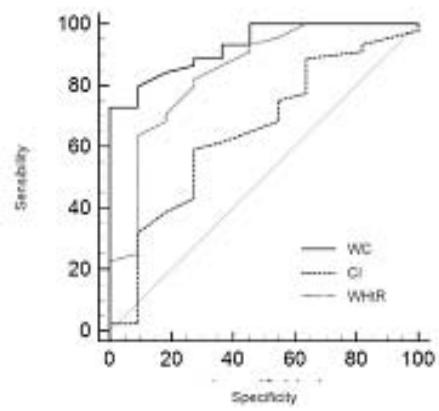
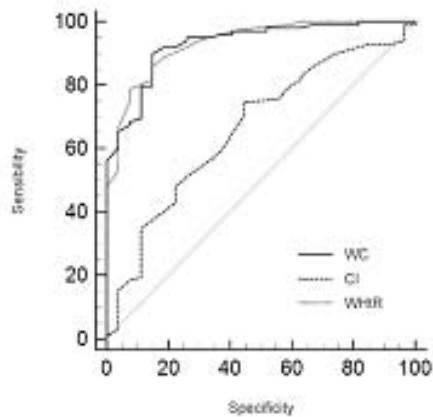
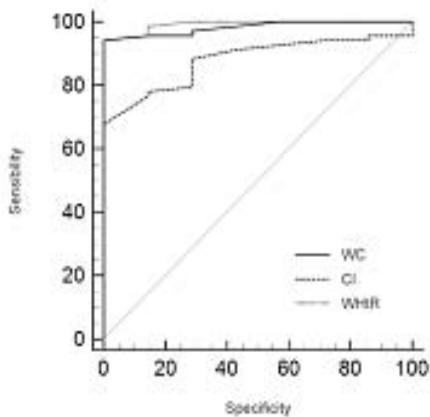
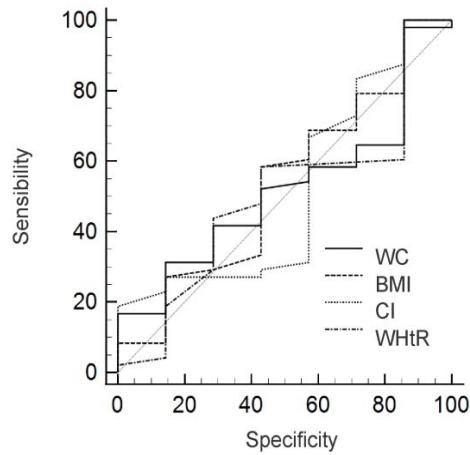
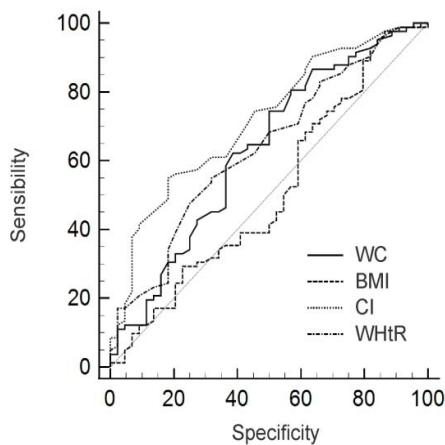
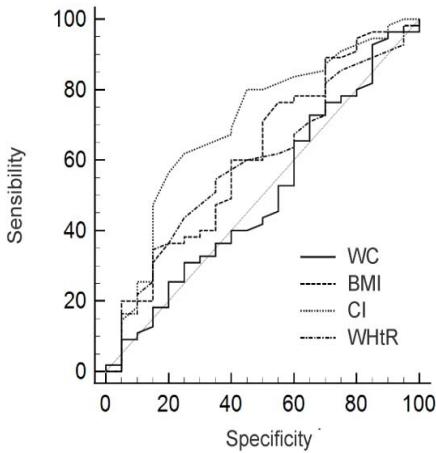
The AUC values, cutoff points, sensitivity, specificity, and positive and negative predictive values of the anthropometric indicators (WC, WHtR, CI) evaluated in the identification of adiposity in patients with AH are shown in Table 3. Among the indicators, WC was a good discriminator both in men (AUC 0.92; 95%CI 0.82-0.98; p\<0.001) and in women (AUC 0.91; 95%CI 0.85-0.95; p\<0.001), with cutoff points of 111 cm for men and 98 cm for women. It was possible to observe that WC showed $100\%$ specificity in men, while in women CC showed higher sensitivity $(87.4\%)$. The positive predictive values were $80.0\%$ and $81.8\%$ for men and women, respectively. The WHtR showed AUC of 0.84 (men) and 0.90 (women), therefore a good discriminator, especially in women.
Considering only the adults, the WHtR (AUC 0.93; $95\% \mathrm{CI} 0.87 - 0.97$; $p < 0.001$ ) followed by WC (AUC 0.92; $95\% \mathrm{CI} 0.86 - 0.96$; $p < 0.001$ ) were good discriminators. In the elderly, WC (AUC 0.82; $95\% \mathrm{CI} 0.82 - 0.98$; $p < 0.001$ ) was the best discriminator, with $100\%$ specificity and $63.3\%$ sensitivity, and a positive predictive value of $87.5\%$. As for race/color, in whites, WC and WHtR were the best predictors of adiposity, with similar results for sensitivity and specificity, but in non-whites, the sensitivity of WC was higher. Figure 1 shows the ROC curve in relation to the ability to identify adiposity in the subgroups evaluated.
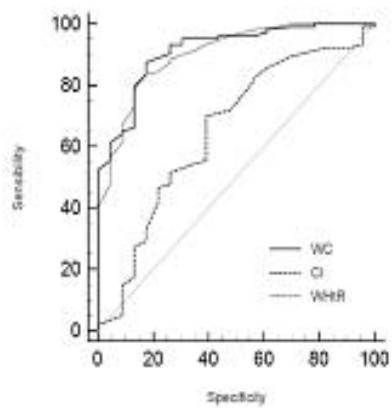
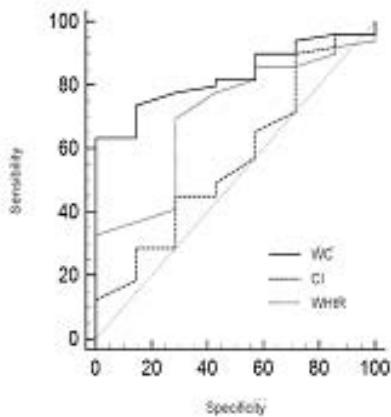
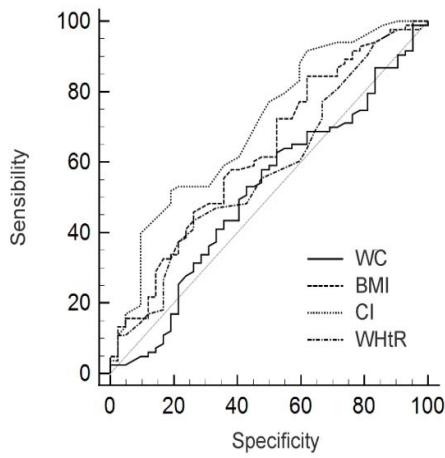
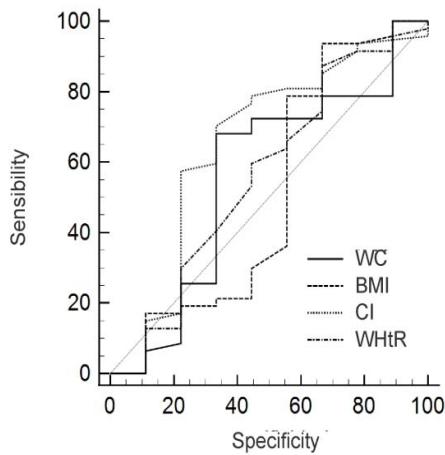
The areas under the ROC curve to evaluate the capacity of anthropometric indicators (BMI, WC, WHtR, CI) to identify MS, as well as cutoff points, sensitivity, specificity of the indicators and positive and negative predictive values are shown in table 4. In men, BMI and WHtR showed higher values for sensitivity, $64.6\%$ and $60.4\%$, respectively, with a positive predictive value of $87.3\%$, and WC had the highest AUC and specificity. In women, CI had an AUC of 0.71 ( $95\%$ CI; 0.63-0.79; $p < 0.001$ ), and was also the most specific indicator ( $81.8\%$ ), while BMI was more sensitive ( $97.6\%$ ). In both adults and the elderly, WC was more sensitive ( $84.3\%$ and $93.6\%$, respectively), but in adults, CI had an AUC of 0.70 ( $95\%$ CI; 0.61-0.78; $p < 0.001$ ), being the best discriminator of MS in this subgroup. When analyzing race/color, both groups showed CI with better AUC. Figure 2 shows the ROC curve of the anthropometric indicators able to identify MS in the subgroups studied.
## IV. DISCUSSION
The findings of this study show that WC showed the best discriminatory power of adiposity in patients with AH of both sexes, which reinforces the role of WC in the identification of obesity in this population. WC is a traditional anthropometric measurement, with a simple measurement technique and low cost, which provides clinical practicality in its use, besides the solid association with cardiometabolic abnormalities, as observed in the study by Dominguez-Reyes et al. (8), who also elected WC as the best discriminator of adiposity for both sexes in a Latin American population.
Anthropometric indicators are presented in a clear, objective and easy-to-apply way, however they suffer some influences such as gender, age and race (17), being extremely relevant the evaluation of the indicators behavior in the identification of adiposity in different subgroups of patients, as presented in this work.
Another point that draws attention in the current investigation is that only patients diagnosed with AH participated, but the majority presented MS, an undiagnosed and consequently untreated disorder in this population. MS configures the presence of combined cardiometabolic risk factors that are responsible for worsening the health of patients with AH (4). It is also noteworthy that, differently from women, who presented as the best indicator to discriminate MS the CI, in men the WC had the highest AUC. This may be explained by the larger number of female participants or by the distribution of abdominal fat in this population.
The study by Camhi et al. (18) makes it evident that fat distribution between men and women is different. Study only with women, the clinically useful indicators to discriminate coronary risk were WC, WHtR and CI (19). Another study brought that the CI has contributed to the stratification of cardiovascular risk in women (20), data that are similar to the current study, since the CI was the best predictor of MS in this group.
With the aim of having some anthropometric indicator capable of easily and quickly notifying MS in clinical/outpatient care, in order to promote treatment to this subclinical portion of patients, the most sensitive indicators in the identification of MS in this study were obtained as BMI (according to sex) and WC (age, race/color), but the best discriminators of MS were WC (men) and HF (other subgroups), and in other studies, BMI, WC and WHtR, besides attributing the strong relationship of these indicators with visceral fat deposition (21, 22).
Studies report that, among the indicators, WC is a good parameter of visceral fat and can be used as an alternative marker. The WHtR is an index to measure obesity and predict metabolic risks, being more sensitive than BMI, especially in the older population. Another good predictor of metabolic disorders is the CI (23-25), which in the current study was the anthropometric indicator that best identified MS, except in men, whose best discriminator was WC. That said, and in view of the vast literature on alternative methods and indicators to predict or diagnose metabolic disorders, this study has as a weak point the failure to explore a method that has been much commented on in the current literature, the neck circumference and abdominal volume index, which has proven to be very accurate in relation to BMI (26, 27).
Results obtained from a systematic review indicate that WHtR is the best anthropometric index when used alone, while WHtR and WC showed better discriminatory power in predicting cardiovascular risk factors compared to the other indices (28).
The WHtR has shown to be efficient in the discrimination of adiposity in most subgroups (women, adults, whites and non-whites), and it has been placed as a practical advantage the use of a single cut point, and even though there is still no consensus about the best cut point, the most commonly used is the value of 0.5 (15). In the present study, the cutoff point for WHtR was 0.62 in men and 0.64 in women, agreeing with the findings of Rezende et al. (7), regarding a cutoff point higher than 0.5 and different between genders, and Oguoma et al. (2021) (21), who identified in the presence of cardiometabolic diseases a higher cutoff point for WHtR.
The possible relationship between abdominal adiposity and MS was evident, because all anthropometric parameters of fat tissue deposition were increased in patients with MS. Moreover, it is clear the importance of comparing the anthropometric methods, especially because in the present study there was no difference in BMI between patients with and without MS, corroborating the statements that BMI may not be a good indicator to determine cardiometabolic risk by not considering the distribution of body fat (29).
In this study it was observed that among the anthropometric indicators, WC and WHtR were the best discriminators of adiposity in the presence of AH. These results converge with other studies, such as Milagres et al. (30), who conclude that the increase in body fat, diastolic blood pressure, triglycerides, glycemia, and the reduction in HDL-cholesterol are associated with an increase in the cutoff points of these anthropometric indices, with a greater association of WHtR with cardiometabolic risk factors.
Moreover, studies with the Brazilian population also suggest that anthropometric indicators of total (BMI) and central (WC and WHtR) obesity are predictors of hypertension, as well as the CI (31, 7). And for other populations, both WHtR and WC were the best predictors of MS (32-34). It is worth emphasizing the need for population-specific cut-off points, given the existence of differences in an individual's body composition due to sex, age, race, and the occurrence of height loss in the elderly (35).
A limiting factor of the study was the larger number of women (69.6%) and adults (69.1%) in the sample, besides the significant number of patients with MS (71.8%), which may have impaired the identification of anthropometric indicators that predict MS in the subgroups, especially in men and the elderly.
In conclusion, this research allowed us to warn about the need to evaluate anthropometric indicators in overweight patients in the presence of comorbidities, such as hypertension, the most prevalent condition associated with obesity today. Adiposity in the studied population was better discriminated by WC and WHtR, considering the different subgroups, culminating in the identification of greater abdominal accumulation of body fat, which in itself already predicts risk in the development of cardiometabolic diseases. The high prevalence of MS in this population portrays an undiagnosed condition, which in the light of anthropometric indicators of adiposity can be identified in a practical and fast way by the CI, especially in adult, female patients of different races (white and non-white).
Sponsorship
This study was sponsored by Federal University of Grande Dourados.
### ACKNOWLEDGMENTS
The authors thank the support of the Federal University of Grande Dourados and the permission of all participants.
 (A)
 (B)
 (C)
 (D)
 (E)
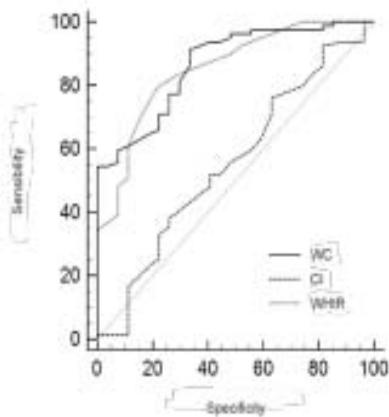 (F) Figure 1: ROC curve of anthropometric indicators in relation to the ability to identify adiposity in men (A) and women (B); adults (C) and elderly (D); whites (E) and non-whites (F).
 (A)
 (B)
 (C)
 (D)
 (E)
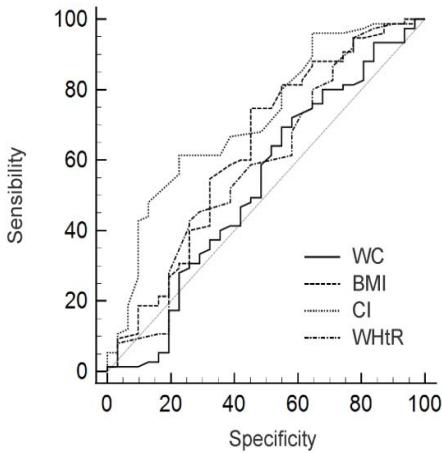 (F) Figure 2: ROC curve of anthropometric indicators in relation to the ability to identify MS in men (A) and women (B); adults (C) and elderly (D); whites (E) and non-whites (F).
D Malta,Ssca Andrade,T Oliveira,L Moura,R Prado,Mfm Souza (2019). Probabilidade de morte prematura por doenças crônicas não transmissíveis, Brasil e regiões, projeções para 2025.
A Jayedi,S Soltani,M Zargar,T Khan,S Shab-Bidar (2020). Central fatness and risk of all cause mortality: systematic review and dose-response meta-analysis of 72 prospective cohort studies.
A Engin (2017). The definition and prevalence of obesity and metabolic syndrome.
Jia Liu,Wei Li,Shelly Tse,Yang Wang,Lu Yin (2019). A4242 Associations between obesity-related anthropometric indices and cardiometabolic risk factors in China.
Y Zhang,Y Gu,N Wang,Q Zhao,N Ng,R Wang (2019). Association between anthropometric indicators of obesity and cardiovascular risk factors among adults in Shanghai, China.
A Rezende,L Souza,T Jardim,N Perillo,Ycl Araújo,S De Souza (2018). Is waist-to-height ratio the best predictive indicator of hypertension incidence? A cohortstudy.
Teresa Domínguez-Reyes,Irma Quiroz-Vargas,Aralia Salgado-Bernabé,Lorenzo Salgado-Goytia,José Muñoz-Valle,Isela Parra-Rojas (2017). Las medidas antropométricas como indicadores predictivos de riesgo metabólico en una población mexicana.
Aaw Mendes,E Sérgio,P Pinho,Acm Silva,Lmm Machado,M Araújo (2012). relação de variáveis antropométricas com os perfis pressórico e lipídico em adultos portadores de doenças crônicas não transmissíveis.
World Health Organization (2000). Obesity: preventing and managing the global epidemic. Report of a WHO consultation.
Opas (2002). XXXVI Reunióndel Comitê Asesor de Ivestigaciones em Salud -Encuestra Multicêntrica.
(2000). Dietary Reference Intakes for Vitamin C, Vitamin E, Selenium, and Carotenoids.
Idf (2006). Global Guideline for Type 2 Diabetes: recommendations for standard, comprehensive, and minimal care.
Margaret Ashwell,Shiun Hsieh (2005). Six reasons why the waist-to-height ratio is a rapid and effective global indicator for health risks of obesity and how its use could simplify the international public health message on obesity.
R Valdez (1991). A simple model-based index of abdominal adiposity.
S Khosravian,M Bayani,S Hosseini,A Bijani,S Mouodi,R Ghadimi (2021). Comparison of anthropometric indices for predicting the risk of metabolic syndrome in older adults.
S Camhi,G Bray,C Bouchard,F Greenway,W Johnson,R Newton,E Ravussin,D Ryan,S Smith,P Katzmarzyk The Relationship of waist circumference and BMI to Visceral, Subcutaneous.
No ethics committee approval was required for this article type.
Data Availability
Not applicable for this article.
How to Cite This Article
Flávia Andréia Marin. 2026. \u201cAnthropometric Indicators as Predictors of Adiposity and Cardiometabolic Diseases\u201d. Global Journal of Medical Research - K: Interdisciplinary GJMR-K Volume 23 (GJMR Volume 23 Issue K1): .
Explore published articles in an immersive Augmented Reality environment. Our platform converts research papers into interactive 3D books, allowing readers to view and interact with content using AR and VR compatible devices.
Your published article is automatically converted into a realistic 3D book. Flip through pages and read research papers in a more engaging and interactive format.
Our website is actively being updated, and changes may occur frequently. Please clear your browser cache if needed. For feedback or error reporting, please email [email protected]
Thank you for connecting with us. We will respond to you shortly.