I. INTRODUCTION
In fact, the fastest growing source of global emissions is considered the transport sector in world. They are also expected to grow at faster rate than not only due to dependence on vehicles, but also due to grows urban mobility and goods transportation services. Global emissions are related to traffic congestions and have serious negative effects on an environment and human health. Traffic congestion causes the increasing of travel time, emission, air pollution, delay, long queue of vehicles, higher vehicle operating cost and so on. A city with traffic congestion has a lot of problems. Public transportation system plays a major role for the achievement of a sustainable and development of a city in the near future. Improving the operational performance of road intersection is considered one of the solutions regarding the decrease in traffic congestion and negative impacts of emissions. The transportation system has a large effect on social, environmental and economic aspects of the city.
Tashkent is a fast-growing city which is population over than 2.5 mln. It is the largest city in Central Asia. Motorization rate is approximately four times faster than population growth rate. Population growth rate is 1.5%. Motorization rate is potential to cause traffic congestion and significantly increase vehicle queues at road intersections. The past decade number of vehicles has significantly increased twice. So, traffic congestion is an effect of a growing city, a city which grows has a higher urban mobility, and sometimes at the during peak hours road capacity do not balance up to the actual demand causing congestion. Cost of loses of Tashkent city was an average of $ 138.2 million per year in 2011[1]. One of the major challenges in the city is proper traffic management and efficient organization.
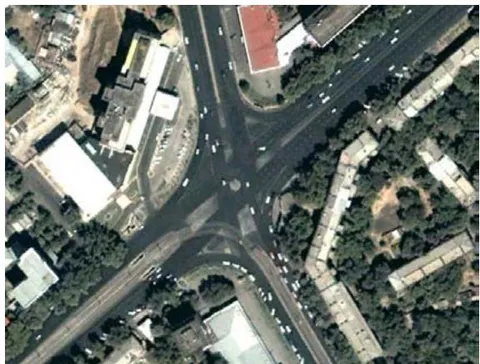
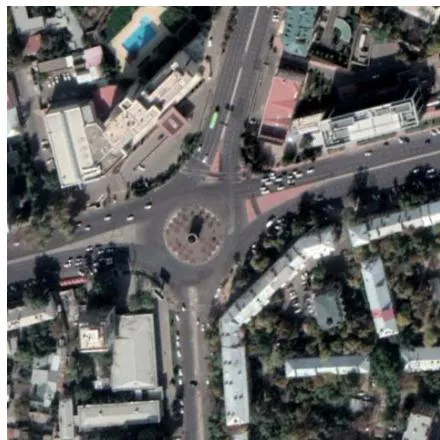
In recent years, traffic signals, geometric shape and design of the road intersection has been changed several times in Tashkent for reducing traffic congestion. For instance, the intersection is shown in Figure 1 that it was changed from conventional (x-type) intersection to roundabout (o-type), from roundabout to conventional intersection. Such kind of infrastructure changes will require additional construction costs, as well as influence to safety, environmental issues and operational performance of the intersections.
Therefore, purpose of this study is to analyze the performance of intersection and in an aim regard specific improvement of the road intersection by using PTV traffic suite simulation models and to determine the occurred traffic congestion in case study of Mirabad-Shahrisabz-Mirabad-Shota Rustaveliat Tashkent as well as providing technical recommendations for improving a level of service and reducing traffic congestion. Objectives are focused on the importance of the intersection design, signal controls and operational performances and compared to the existing conditions.
Often, insufficient research has been conducted on how the efficiency of a roundabout or a conventional intersection on urban streets can affect the road network. For this reason, a systematic assessment is required to justify the most optimal alternatives when implementing long-term projects for a particular location.
In recent years, roundabouts equipped with traffic lights have been widely used, but in developing countries, as well as in Uzbekistan, there is no clear design or standard for the construction of roundabouts. We can calculate an efficient intersection design using PTV vissim software and based on develop practical recommendations. We will be able to assess and select alternative options for effective traffic management.
II. LITERATURE REVIEW
Despite of extensive research works on traffic congestion during the past decades have focused on reducing traffic congestion and traffic safety at signalized and unsignalized intersections, and analyzing traffic emissions. These questions are directly related to the design of intersection and characteristics.
Several studies have been discussed traffic emission modeling at intersections. Computer model was developed for estimation traffic emissions for two kinds of intersections. This study presents a detailed analysis and modelling traffic flow emissions using PTV vissim software and methodology with reasonable solutions to plan a road intersection. From the analysis of the studied sources, very few researches have focused on the study of conventional and roundabout intersections.
Some studies[17-22] have studied the effects of factors such as bus travel time and travel time variability and vehicle fuel consumption at the intersection, bus delay and focused on finding solutions to minimize delays. The impact of scheduled and unscheduled stops related to bus delays was studied using a linear multivariate regression model based on the collected automatic vehicle location data.
There are many factors influencing to emission. The exhausted emissions are a product of this combustion process by burning fuels. Other significant input considered by the road emissions is street geometry, meteorological conditions, operation conditions, energy efficient vehicles and characterize the mechanical activities in the transport process, they are also related to emissions , , – . The studies showed that potential affects to minimize traffic negative impacts, reduce fuel consumption and emission using transport technology measures, shifting new type of fuels in power train system, technological improvements and optimal engine operation conditions, pollutant emissions per unit of length traveled have been significantly studied. Emissions are estimated by traffic data with vehicle traveled distance, speed and traffic flow data.
However, they conclude that operation conditions are a special case, where collected data can be used to general total traffic volume, but it is not necessarily true for other areas. The collected data is used to obtain traffic volume as input to the emission calculation, but only for specific vehicles and road intersections.
III. RESEARCH METHOD
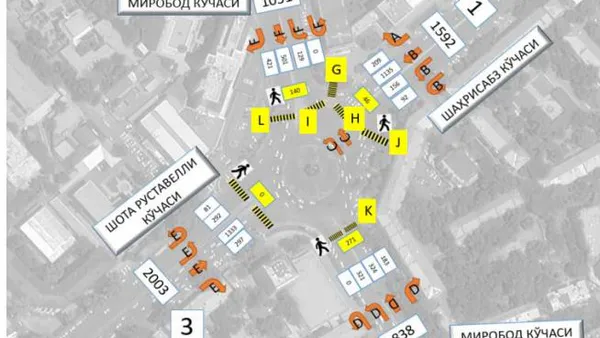
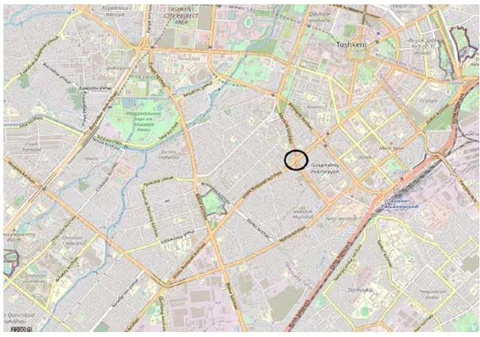
This study used a quantitative method to assess the signalized intersection of Mirabad-Shahrisabz-Mirabad-Shota Rustaveli streets crossing in Tashkent, by considering delay, traffic queue, fuel consumption, and as well as level of service (LOS). Map showing the location of the studied intersection is shown in Figure 2. The location of study was selected for research purpose which is described as one of the congested intersection and potential to traffic congestion, Tashkent city and the intersection was four arm signalized intersection with fixed signal time. In this study data collection conducted in normal working day on November 12, 2020 and included data that traffic volume, cycle times and signalized phases, vehicle queue length and average vehicle speed. Data collection was carried out on Thursday for 12 hours including the peak of the morning, afternoon, and evening.
Secondary data were for input values in PTV vissim 20 software and to calibrate the model based on the actual road conditions in Tashkent.
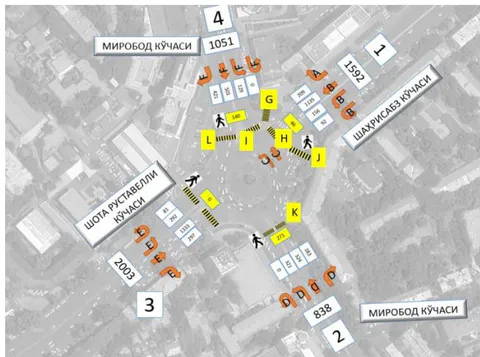
Based on the analysis, traffic volume was in the period of 07.00-20.00. The traffic data are provided in Figure 3 which consists of trucks (2%), buses (3%), cars (95%).
Traffic congestion is related with increased emission rate and fuel consumption at the intersection. Therefore, the obtained traffic data for emission modelling usually relies on the traditional approaches. Emissions are functional relationships of the traffic condition, expressing the quantity of a pollutant vehicles, distance, time or mass of fuel burned. The vehicles give an important contribute to air pollutions, overall in respect of Carbon Dioxide (CO2), Hydrocarbons (HC), Carbon monoxide(CO), Nitrogen oxides (NOx) and volatile organic compounds (VOC). Emission data is expressed in grams of pollutions per kilometer. In general, exhausted emissions from vehicle can estimated following equation:
Where, — relative emission factor and d-vehicles traveled distance.
Traffic signal is accepted the traffic control for the congested intersections and using this form of queueing with an arrival rate ( ) and a departure rate ( ). Maximal number of vehicles in queue can be found as .
Queue can be computed following formula:
Where, – Time for queue to empty, r – red time and .
Delay can be found with perception of arrival rate, departure rate and red time. Total delay is product of all queues in the time period and maximum delay is equal to red time. Average vehicle delay per cycle can be found such as:
Average delay per vehicle due to uniform arrivals can be calculated as:
Where C-cycle length, X= Volume/Capacity (v/c) ratio.
Level of service of the intersection is estimated based on the methods of HCM [30] as shown in Table 1.
| LOS | Signalized | Unsignalized |
| (second) | ||
| A | ≤ 10 | ≤ 10 |
| B | >10 – 20 | >10 – 15 |
| C | >20 – 35 | >15 – 25 |
| D | >35 – 55 | >25 – 35 |
| E | >55 – 80 | >35 – 50 |
| F | >80 | >50 |
IV. RESULTS AND DISCUSSIONS
a) Existing condition
Details of the design of the intersection is presented, two major streets (Shota Rustaveli and Shakhrisabz streets) have 4 lanes in each direction, Mirabad minor streets have 3 lanes in each direction, and the circular island in the central part of the intersection has a diameter of 42 m. The maximum allowed speeds of vehicles on the roads of the city is 70 km/h. Based on the analysis the observations result of the phase timing and signal phase can be given in Table 2 and Figure 4. Signal cycle length is 90 seconds.
| Phase | Green period (sec) | ||
| Start time | End time | Duration | |
| A | 3 | 44 | 41 |
| B | 3 | 44 | 41 |
| C | 56 | 82 | 26 |
| D | 56 | 82 | 26 |
| E | 3 | 44 | 41 |
| F | 56 | 82 | 26 |
| G | 49 | 82 | 33 |
| H | 49 | 82 | 33 |
| I | 3 | 42 | 39 |
| J | 56 | 82 | 26 |
| K | 3 | 42 | 39 |
| L | 87 | 42 | 45 |
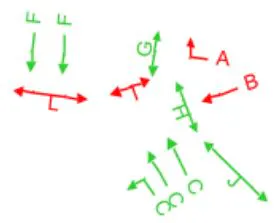
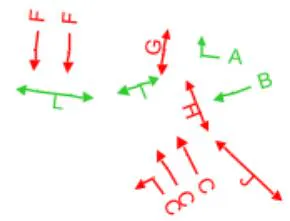
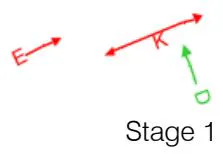
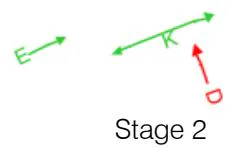
Figure 5: The existing signal phases in vissim
| No | Группа сигналов | Signal sequence | 0 | 10 | 20 | 30 | 40 | 50 | 60 | 70 | 80 | ||||
| 1 | A | Kpa | -4 | 44 | 3 | 44 | |||||||||
| 2 | B | Kpa | -4 | 44 | 3 | 44 | |||||||||
| 3 | C | Kpa | 55 | 80 | 54 | 80 | |||||||||
| 4 | D | Kpa | 55 | 80 | 54 | 80 | |||||||||
| 5 | E | Kpa | -4 | 44 | 3 | 44 | |||||||||
| 6 | F | Kpa | 55 | 80 | 54 | 80 | |||||||||
| 7 | G | Kpa | 48 | 80 | 47 | 80 | |||||||||
| 8 | H | Kpa | 48 | 80 | 47 | 80 | |||||||||
| 9 | I | Kpa | -4 | 42 | 3 | 42 | |||||||||
| 10 | J | Kpa | 55 | 80 | 54 | 80 | |||||||||
| 11 | K | Kpa | -4 | 42 | 3 | 42 | |||||||||
| 12 | L | Kpa | 1 | 43 | 0 | 43 |
The simulation using PTV vissim for the existing conditions were obtained a level of service (LOS) C with a delay of 21.61 seconds/vehicle. Major significant parameters were shown in Table 3. The level of service was similar with the existing condition however the congestion time increased 23 percent in 2022 and 275 percent in 2025.
| No | Parameters | 2020 | 2022 | 2025 |
| 1 | Level of service (LOS) | C | C | E |
| 2 | Vehicle delay (sec) | 21.61 | 26.68 | 59.25 |
| 3 | Queue length (m) | 16.55 | 28.28 | 93.9 |
| 4 | Maximum queue length (m) | 83.35 | 119.23 | 231.42 |
| 5 | All stops | 0.74 | 0.94 | 2.65 |
| 6 | All vehicles | 5509 | 6245 | 7155 |
| 7 | Emission CO (gram) | 7993.22 | 10019.28 | 20583.15 |
| 8 | Emission NOx (gram) | 1555.19 | 1949.39 | 4004.73 |
| 9 | Emission VOCs (gram) | 1852.506 | 2322.067 | 4769.884 |
| 10 | Fuel consumption (liter) | 423.1 | 530.35 | 1089.52 |
Currently, more than 0.5 mln vehicles are registered at Tashkent and an average of several hundred vehicles are coming and leaving the city per day. Dynamic relations of daily traffic are unknowable. The analysis shows that an average more than 55,000 vehicles are observed at the intersection daily. Traffic engineers use projection of future traffic to make recommendations and decisions on transportation investments each year. Most traffic projection models rely on linearprojections of past traffic counts. By the traffic modeling using a PTV vissim model is to be analyzed the performance of parameters of the intersection. Separate analysis and evaluation are required in cases where traffic flows may vary significantly during rush hour in the morning and afternoon. The linear increment (cumulative) method was used to predict traffic flow. It was calculated traffic flow projection with 7% growth rate per year in Table 4.
| Йил | Hourly traffic volume(with growth rate 7%) |
| 2020 | 5500 |
| 2022 | 6200 |
| 2025 | 7700 |
| 2030 | 10800 |
b) First alternative for improving intersection performance
The intersection improvement by applying the first alternative was carried out by redesigning the green time interval and optimization with computer PTV vissim simulation. The results areas shown in Table 5. The modelling results of the first alternative were defined a level of service B with a delay of 16.06 seconds/vehicle. The level of service was not similar with the existing condition and vehicle delay time decreased 25 percent.
In general, there was an improvement for the intersection performance to the existing condition. In 2030, Travel time cannot be predicted that traffic flow with same 7% growth rate, in which the traffic volume approaching exceeds capacity, LOS F is characterized by stop and go, low comfort and convenience.
| No | Parameters | 2020 | 2022 | 2025 | 2029 | 2030 |
| 1 | Level of service (LOS) | B | B | C | E | F |
| 2 | Vehicle delay (sec) | 16.06 | 16.76 | 20.13 | 72 | 89 |
| 3 | Queue length (m) | 10.91 | 13.43 | 22.42 | 125.82 | 146.3 |
| 4 | Maximum queue length (m) | 66.06 | 84.81 | 132.46 | 231.46 | 231.5 |
| 5 | All stops | 0.56 | 0.59 | 0.74 | 3.56 | 4.58 |
| 6 | All vehicles | 5518 | 6295 | 7607 | 9202 | 9198 |
| 7 | Emission CO (gram) | 7130.6 | 8225.4 | 10890.8 | 32002.5 | 38512.9 |
| 8 | Emission NOx (gram) | 1387.4 | 1600.4 | 2118.9 | 6226.5 | 7493.2 |
| 9 | Emission VOCs (gram) | 1652.58 | 1906.3 | 2524.1 | 7416.9 | 8925.8 |
| 10 | Fuel consumption (liter) | 377.4 | 435.4 | 576.5 | 1694.1 | 2038.6 |
c) Second alternative for improving intersection performance
The improvement of intersections for the second alternative was carried out by redesigning from roundabout to channelized intersection in same conditions such as traffic volume, number of right and left turn vehicles at intersection, number of lanes, number of pedestrians and traffic signal length.
The analysis results of the redesigning intersection performance are shown in Table 6. Based on the results of the second alternative, the LOS was obtained B with a delay of 12.08 seconds/vehicle. It means there was an improvement of the intersection performance results from the second alternative solution.
| No | Parameters | 2020 | 2022 | 2025 | 2026 | 2027 |
| 1 | Level of service (LOS) | B | B | D | E | F |
| 2 | Vehicle delay (sec) | 12.08 | 17.04 | 42.55 | 75.86 | 81.1 |
| 3 | Queue length (m) | 6.13 | 11.18 | 36.48 | 61.49 | 69.66 |
| 4 | Maximum queue length (m) | 80.89 | 107.28 | 193.45 | 257.35 | 257.42 |
| 5 | All stops | 0.49 | 0.71 | 1.81 | 3.5 | 3.6 |
| 6 | All vehicles | 5486 | 6236 | 7122 | 7176 | 7150 |
| 7 | Emission CO (gram) | 6064.1 | 8263.1 | 17111.2 | 28497.6 | 29399.6 |
| 8 | Emission NOx (gram) | 1179.8 | 1607.7 | 3329.3 | 5544.5 | 5720.1 |
| 9 | Emission VOCs(gram) | 1405.4 | 1915.1 | 3965.7 | 6604.6 | 6813.7 |
| 10 | Fuel consumption (liter) | 321 | 437.3881 | 905.7452 | 1508.457 | 1556.2 |
d) Comparison of the results
Based on the analysis performance parameters of intersection, the first alternative is the best option for improving intersection performance. It reduced delay, shortened vehicle queue time, reduced queuing volume of vehicles, thereby reduced the traffic congestion as well as increased the LOS at the signalized intersection. The result also showed that the delay was reducing from
21.61 seconds/vehicle to 16.06 seconds/vehicle, vehicle queuing length from 83.35 seconds to 66.06 meters, and intersection LOS increased from C to B. It means that the second alternative can reduce the traffic congestion by 25 percent and then improve the intersection performance significantly. Fuel consumption can also decreased by 25 percent. A detailed comparison of the results is shown in Table 7.
| No | Parameters | Existing condition | alternative | alternative |
| Level of service (LOS) | C | B | B | |
| Vehicle delay (sec) | 21.61 | 16.06 | 12.08 | |
| Queue length (m) | 16.55 | 10.91 | 6.13 | |
| Maximum queue length (m) | 83.35 | 66.06 | 80.89 | |
| All stops | 0.74 | 0.56 | 0.49 | |
| All vehicles | 5509 | 5518 | 5486 | |
| Emission CO (gram) | 7993.22 | 7130.6 | 6064.1 | |
| Emission NOx (gram) | 1555.19 | 1387.4 | 1179.8 | |
| Emission VOCs(gram) | 1852.506 | 1652.58 | 1405.4 | |
| Fuel consumption (liter) | 423.1 | 377.4 | 321 |
V. CONCLUSIONS
The assessment of the intersection was performed by important parameters such as considering delay, queue, fuel consumption, amount of pollutants and level of service. The analysis showed the existing condition at the intersection was stable flow with average delay of 21.61 second/vehicle and LOS -C. Two alternatives to improve the intersection performance were investigated using Vissim 20: Alternative 1 and Alternative 2. The first alternative was re-designing green time of traffic light and the second alternative were consisted of re-designing green time and changed type of intersection. The alternative obtained LOS of F in 2030 year, average delay of 89 second/vehicle, queue 231.5 meters. The alternative resulted in performance was increasing with average delay of 81.1 second/vehicle, maximum vehicle queue 257.42 meters and LOS of F in 2027 year. Alternative 1 is considered the best solution, this option will reduce delay by , queue by , decrease the congestion cost by , and increase LOS. In general, the 1st alternative improves the intersection performance significantly for long period of time. Based on the computer modeling results in all three conditions, the second scenario is the best option with optimization of traffic signals with the PTV vissim simulation software.