I. INTRODUCTION
Floods are anticipated to happen more frequently in the future because of climate change, unplanned rapid urbanization, change in land use pattern, poor watershed management and decline in recharge of groundwater by extension of impermeable surfaces particularly in urban areas (Hajar, Mohd and Thamer. 2016). This follows that, many communities living close to rivers and on wetlands (urban or rural communities) globally are at the risk of flood disasters with attendant adverse impacts resulting from varying degrees of vulnerability (Hajar, Mohd and Thamer. 2016; Ali, 2018, Ali, Onah, Mage, Yiyeh, Tarzoho, and Iorhuna, 2022).
Managing floods with the objectives of ensuring safety and wellbeing of people, and reducing risks and impacts on livelihoods would require adequate knowledge of vulnerability. This is because flood vulnerability is defined in probability terms which shows the degree of susceptibility and exposure to damage resulting from disaster in an area or population, as well as the human ability to resist or adapt. In other words, against a flood occurrence, the amount of damage depends on the area's characteristics and demographic makeup (Mohammad, Hesam, Mohsenand Hossein, 2020), which is defined by the level of exposure and susceptibility and the resilience capacity.
The need to assess flood vulnerability is further underscored by the fact that it is usually location dependent since vulnerability to flood disaster varies over time in places due to environmental conditions, human activities, and the culture of affected society (Ahmad and Simonovic, 2013; Ali, Onah, Mage, Yiyeh, Tarzoho, and Iorhuna, 2022).
Over the last 20 years, Flood Vulnerability Index (FVI) has proven to be a useful tool in assessing or analysing vulnerability to flood disasters by households and communities. This is because Flood Vulnerability Index (FVI) indicates the extent of harm, which can be expected under certain conditions of exposure, susceptibility and resilience (UNESCO-IHE, 2022). Also, according to UNESCO-IHE (2022), human population worldwide is vulnerable to natural disasters, and in recent years, the impacts of floods have gained importance because of the increasing amount of people who are exposed to its adverse effects. Therefore the aim of vulnerability studies is to recognize correct actions that can be taken to reduce vulnerability before the possible harm is experience. FVI is a powerful tool for policy and decision-makers to prioritize investments and makes the decision making process more transparent. Identifying areas with high flood vulnerability and understanding the extent of vulnerability may guide the decision making process towards a better way of dealing with floods by societies.
Oweto is an important agrarian community in Agutu Local Government Area of Benue State, Nigeria and is reputed for massive production of rice due to its location on vast floodplains of the River Benue. Inspite of its agricultural significance in terms of rice production and fishing, floods of varying magnitudes and severity have been a yearly event which underscores the need to assess the extent of vulnerability. This will no doubt help in targeted interventions that would reduce flood risks and impact in the study area. Moreover, efforts have not been made in determining the extent of household vulnerability to flood disasters in this area. Previous studies on flood in Benue State focused on flood damage; rainfall pattern and its implication on flood frequency; and social impact and people's perception of flooding all in Makurdi town (Ali, 2018, 2006; Ologunorisa and Tersoo, 2006; Ocheri and Okele, 2012). Similarly Ali, Onah, Mage, Yiyeh, Tarzoho, and lorhuna, (2022) assessed household vulnerability to flood also in Makurdi town which suggests that flood studies in this area are concentrated in urban areas, while little is little has been reported in the literature on vulnerability of households to flooding in flood prone rural communities of Benue State including Oweto. It is in view of the above that this study assessed household
vulnerability to flood disasters in Oweto, a rural area in Agatu Local Government Area of Benue State.
II. MATERIAL AND METHODS
a) Study Area
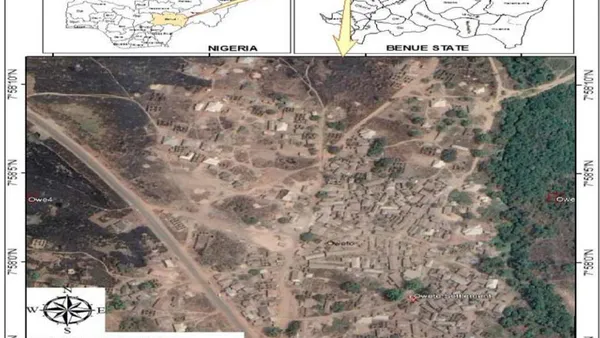
Oweto is an agrarian community in Usha Council Ward in Agatu Local Government Area of Benue State. Oweto is located between Latitudes and and Longitudes and at the Lower Benue River floodplains (Figure 1). Oweto shares boundary with the River Benue to the North, Utugolugwu village to the East, Olegada'Akolo village to the West and Ugba village to the South, all in Agatu Local Government Area.
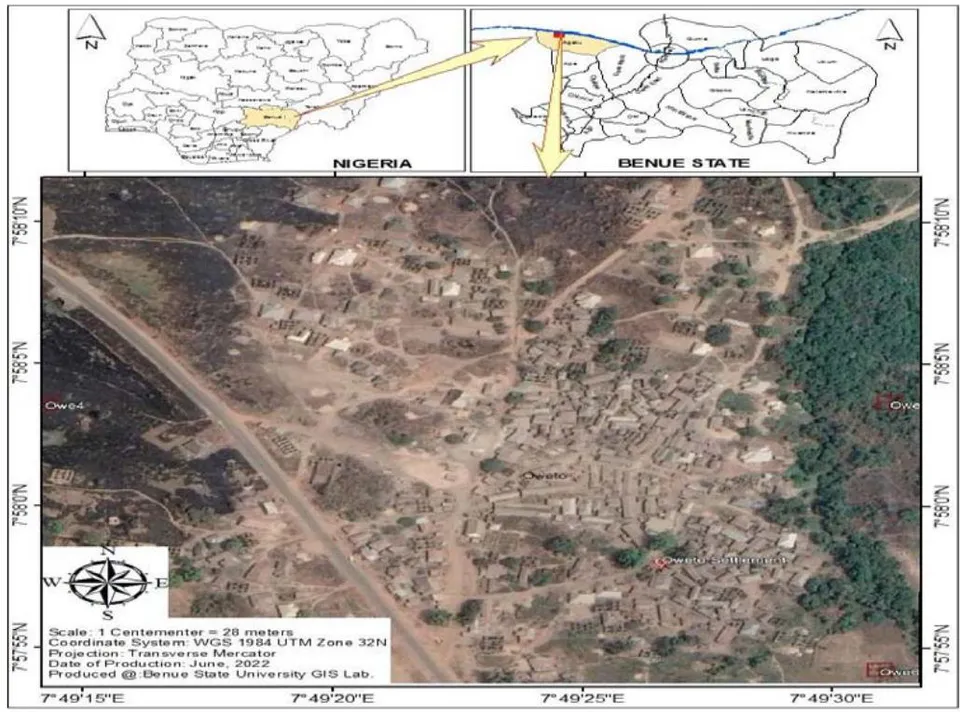
The relief is generally low-lying averaging 92 metres above sea level, while the geology of the area is basically composed of sedimentary rocks, with sandstones as the dominant rock type. This area is mainly cretaceous of fluvio-deltaic sediments with well - embedded sandstone which are of hydrological significance in terms of ground water yield and exploitation. (Ali, (2018, 2006; Uchua and Nduke, 2011; Ocheri, Ali and Eba, 2014; Ocheri and Onah, 2015). Oweto is situated completely on one side of the river and the Ajiba river flows into it and drains into the River Benue as tributary.
Oweto has an average temperature of and a rainfall average of 1370mm (Moro and Onoja, 2006). Temperatures are high throughout the year with February and March occurring as the hottest months.
Though the vegetation of the area is generally classified as the guinea savannah type with scattered woodland, shrubs and grasses, Oweto also has a riverine forest vegetation, a remarkable vegetation similar to that of a typical rain forest belt of Nigeria. This unique vegetation within the Savannah was home to buffaloes, elephants, gorillas and different species of monkeys. There was preponderance therefore of tall trees and luxuriant vegetation.
b) Methods
i. Sampling
The study employed both direct field measurements and questionnaire for data collection on vulnerability factors and indicators. For the purpose of questionnaire administration, a total of 400 sample size was determined using Yamane (1967) formula. The study sampled 400 households using simple random sampling technique. Respondents were selected based on the criteria of being household members of the community and on their ability to respond to questions put to them appropriately. In doing this priority was given to the heads of the households in responding to questions as contained in the questionnaire, however, where the household head was indisposed, the most elderly with the ability to respond to questions was selected.
ii. Computation of Flood Vulnerability index (FVI) Using PCA
The following steps were followed in determining FVI using PCA.
Step 1: In computing FVI, the first step was to quantify the various vulnerability indices as specified on Table 1.
Step II: The weights of these indicators were determined using PCA and the component loading of the first component was used. This was consistent with the method used by Akukwe and Ogbodo (2015) Ali 2018 and Ali, Onah, Mage, Yiyeh, Tarzoho, and Iorhuna (2022). In their studies, PCA was run on the variables, and the weights were attached to the indicators using the first principal component scores of the indicators. The reason for assigning the weights determined by PCA to indicators was to avoid the uncertainty of equal weighting given the diversity of indicators used (Akukwe and Ogbodo, 2015; and Deressa, Hassan and Ringler, 2008; Ali, 2018, Ali, Onah, Mage, Yiyeh, Tarzoho, and lorhuna, 2022). Thus, for the determination of the vulnerability indices, the selected indicators of sensitivity and exposure were negatively associated with their first principal component because it was assumed that areas with higher frequencies of flooding were subjected to higher sensitivity due to the adverse effects of flooding as well as being more exposed (Ali, Onah, Mage, Yiyeh, Tarzoho, and lorhuna, 2022). On the other hand, adaptive capacity was positively associated with the first principal components because it is assumed that people with higher adaptive capacity were less sensitive to damages caused by flooding, holding exposure level constant. Thus, higher values of the vulnerability indices show less vulnerability and vice versa (Akukwe and Ogbodo, 2015; Deressa et al., 2008; and Madu, 2011; Ali, Onah, Mage, Yiyeh, Tarzoho, and lorhuna, 2022).
Step III: Consequently, vulnerability to flood was computed according to Deressa et al., (2008); and Akukwe and Ogbodo, (2015) as follow:
Ali, 2018, Ali, Onah, Mage, Yiyeh, Tarzoho, and Iorhuna, (2022) explained the adoption of this formula, maintaining that this equation was adopted because flooding is one of the consequences of climate.
Equation (1) was expanded as follows:
Where is vulnerability index, are weights of first components scores, are adaptive capacity variables, are sensitivity Variables, and are the exposure variables.
Note: AC = Adaptive Capacity; S = Sensitivity; and E = Exposure
| Determinant of vulnerability | Vulnerability indicator | Description of each indicator | Units of Measurement | Relationship between indicator and Vulnerability |
| Adaptive or Resilience Capacity | Wealth | Average Annual incomeReceipt of assistance/relief | % of total population who earned more than N500,000.00 per annum compared with those who receive, who are educated, who are employed outside primary production sector like farming, and who is less vulnerable | The higher the% of total population, the higher the% of total population in the N500,000.00 per annum, who receive, who are educated, who are employed outside primary production sector like farming, the lesser the vulnerability. |
| Literacy rate | Educational qualification | % population who are educated | ||
| Employment status | Occupation | % of population that are less vulnerable | ||
| Sensitivity or Susceptibility | Flood characteristics | Length of stay - The number of years of residence | % of population that have stayed longer than 10 years | The higher the frequency, the more the vulnerability. The higher the numbers the higher the vulnerability. |
| Frequency of Flood occurrence | Frequency of Flood occurrence in a year | The higher the extent of coverage/magnitude, the higher the vulnerability | ||
| Period of flood occurrence in a year | Number of months with flood in a year | |||
| Severity | Extent of coverage | |||
| Flood perception | Pre-flood awareness | % of population with pre-flood awareness | ||
| Flood experience | Past flood experience | % population who had experience flood | ||
| Exposure | Proximity to water body | Average Distance from River | The average distance to flood prone areas | The shorter the average distance to water body, the higher the vulnerability The longer it takes for flood to recede the higher the vulnerability |
| Flood duration | Number of days it takes for flood to recede | Number of days with flood water |
III. RESULTS AND DISCUSSION
a) Flooding Vulnerability Level at Oweto Community
The results of the flooding vulnerability level as shown by PCA and composite vulnerability index for study area are presented in Tables 2 and 3. The result of the PCA is presented in Table 2. The shows that first principal component explained most of the variation in the flood vulnerability indicators with an eigen value of 10.450 and the percentage variance explanation of . This component shows high loadings on the adaptive capacity indicators such as nature of source of assistance; impact on businesses and sensitivity indicators such as pre-flood awareness, past flood experience and flood duration. Since more factors loaded were on adaptive capacity indicators, the first component is named Adaptive Capacity Component, which is an indication that the study has relatively moderate to high resilience capacity to cope with flood disaster.
The second component which has an eigen value of 6.154 with percentage explanation of is named Socio-economic Component. This is because the second component is highly loaded on socioeconomic variables such as nature of business, annual income, sex and educational attainment which are part of adaptive capacity factors.
The third component with an eigen value of 4.139 accounted for explanation in the variation in the flood vulnerability indicator. The component is highly loaded in the period of flood occurrence and frequency of flood occurrence. Therefore the component is named Sensitivity Indicators Component. This suggests that even though the study area has relatively highly adaptive capacity, the sensitivity factor is relatively high thereby making households highly vulnerable.
In the same vein, the fourth component with an eigen value of 3.048 and explanation is highly loaded on variables such as relocation, flood losses and other source of income. Therefore the component is called flood adaption and impact component. Overall, the total percentage explanation of substantially accounted for the variation in the vulnerability indicators of adaptive capacity, sensitivity and exposure factors.
| Variable | Component | |||
| 1 | 2 | 3 | 4 | |
| Sex | .162 | .879 | .162 | .130 |
| Length of stay | .862 | .444 | .021 | .001 |
| Ethnic group | .700 | .176 | .460 | .418 |
| Age | .508 | .451 | .324 | .587 |
| Educational qualification | .513 | .774 | .255 | .189 |
| Occupation | .831 | .409 | .132 | .224 |
| Marital status | .461 | .398 | .566 | .492 |
| Distance from river | .493 | .758 | .269 | .330 |
| Period of flood occurrence | .300 | .002 | .819 | .158 |
| Frequency of flood occurrence | .126 | .231 | .933 | .341 |
| Extent of coverage | .677 | .501 | .169 | .392 |
| Days flood water recede | .712 | .537 | .212 | .303 |
| Nature of business | .203 | .784 | .422 | .362 |
| Keep you from business | .855 | .295 | .111 | .007 |
| If yes how long | .831 | .230 | .164 | .384 |
| Quantify your annual income | .503 | .814 | .131 | .078 |
| Flood loss in momentary terms | .439 | .458 | .504 | .511 |
| Flood render you homeless | .678 | .644 | .011 | -.159 |
| How long do your relocate | .702 | .189 | .458 | .407 |
| Why have you not relocated | .912 | .233 | .007 | .563 |
| Other source of income | .399 | .471 | .322 | .630 |
| Coping strategy | .750 | .486 | .278 | .159 |
| Assistance by groups | .216 | -.021 | -.104 | .596 |
| Nature of assistance | .837 | .346 | -.024 | .232 |
| Who has helped you | .891 | .351 | .113 | .212 |
| Pre-flood awareness | .881 | .128 | .164 | .256 |
| Past flood experience | .809 | .251 | .103 | .469 |
| Total Eigenvalues | 10.450 | 6.154 | 4.139 | 3.048 |
| % of Variance | 38.705 | 22.793 | 15.328 | 11.290 |
| Cumulative% | 38.705 | 61.498 | 76.826 | 88.117 |
Extraction Method: Principal Component Analysis.
Rotation Method: Varimax with Kaiser Normalization a. Rotation converged in 9 iterations.
The first principal component which explained the majority of the variation in the data set as shown in Table 2 was taken (that is, it served as the weight) and used in the computation of the vulnerability indices for the study area presented in Table 3.
The result indicates that households in Oweto community are highly vulnerable with Composite Flood
Vulnerability Index (CFVI) of -0.347. The level of vulnerability is as shown in the result is very high due to exposure and sensitivity levels. This is because Oweto is located right at the floodplain of River Benue and one of the major tributaries river Ajiba.
| Variables | Components Weights |
| Adaptive Capacity or Resilience Indicators | |
| Education | 0.513 |
| Occupation | 0.813 |
| Average annual Income | 0.503 |
| Coping Strategies | 0.750 |
| Assistance | 0.216 |
| Nature of assistance | 0.837 |
| Source(s) of assistance | 0.881 |
| Total Weight | 4.513 |
| Sensitivity or susceptibility Indicators | |
| Length of stay | 0.862 |
| Period of flood occurrence in a year | 0.300 |
| Frequency of Flood occurrence | 0.126 |
| Extent of coverage | 0.677 |
| Pre-flood awareness | 0.881 |
| Past flood experience | 0.809 |
| Total Weight | 3.655 |
| Exposure Indicators | |
| Average Distance from River | 0.493 |
| Flood duration | 0.712 |
| Total Weight | 1.205 |
From Table 3 above, Flood Composite Vulnerability Index (CFVI) is computed as follows: FVI = 4.513 - 3.655 + 1.205 = -0.347 In terms of total weight of individual vulnerability indicators, the result on Table 4 revealed that Oweto has a relatively moderate adaptive capacity or resilience index of 4.513. Adaptive capacity has an inverse relationship with vulnerability, which means that the higher the adaptive capacity, the lower the vulnerability. This is so because, adaptive capacity has to do with the economic and social capital or resources base of individuals and communities of flood affected areas. This also follows that the higher the socio-economic capital, the higher the resilience of individuals/communities during flood events. To this end, the result of Oweto residents with lower socio-economic assets is very weak in their capacity to cope with flood disaster. This is evident in the fact that Oweto residents engage predominantly in agriculture (farming and Fishing) which is more vulnerable to flood disaster than other livelihood options.
The result of sensitivity or susceptibility shows that Oweto is equally highly susceptible to flooding with the index of 3.655. Generally, the higher the susceptibility index, the higher the vulnerability. This implies that Oweto community, as far as sensitivity index is concerned, is highly vulnerable to flooding; moreso that Oweto possesses weak socio-economic capital to deal with flood disasters in face of high susceptibility.
Similarly, the result on the level of exposure to flooding indicates that Oweto is very exposed with exposure index of 1.205. Just like the sensitivity indices, the higher the exposure of a place to flood, the higher the vulnerability. This implies that the percentage of those leaving in close proximity to the river in the study area is higher. Also, the flood duration in terms of the numbers of days flood takes to recede is equally very high in Oweto. Consequently, the cumulative effect of high sensitivity and exposure as against weak adaptive capacity led to very high flood vulnerability as shown in the very low (even negative) CFVI in Oweto community.
Overall, the observed negative vulnerability index of Oweto could be connected to the fact that Oweto is rural agrarian community with inadequate social amenities and low income generation ability largely from engaging in primary production.
b) Discussion
The result of this study is similar to those of Ali, Onah, Mage, Yiyeh, Tarzoho, and Iorhuna, (2022), in their study of "Principal Component Analysis of Household Vulnerability to Flood Disaster in Makurdi Metropolis, Benue State, Nigeria" where the author reported low vulnerability index of 0.443 as against a very low index of 0.347 for Oweto. This suggests that both Makurdi and Oweto communities in Benue State are vulnerable, however Oweto is extremely more vulnerable than Makurdi due to higher adaptive capacity in Makurdi and low or weak adaptive capacity in Oweto. Similarly, Abdulhamid (2016) also reported that of residents of Lokoja metropolis lived in neighbourhoods with low vulnerability to flooding, while lived in areas with vulnerability. This result is however, at variance with the findings of this study due to their rural-urban differences. In all these studies however, high level of exposure and sensitivity resulting from close proximity to water bodies, long flood duration and short frequency were the major vulnerability factors. This suggests that any effective intervention targeted at reducing flood risks and impacts should be focused on addressing these critical determinants of vulnerability to flood disasters in these areas.
Elsewhere in Narmada river basin districts in Central India, Shefali, Mukulm and Mudit (2021) reports that of the districts in the Narmada river basin remain highly vulnerable to flood-risk, while the socioeconomic parameters and physical sizes of districts and their resources play crucial roles in the vulnerability level. This result agrees to a large extent with the findings of this study especially in term of weak socio-economic factor which translates to weak adaptive capacity as reported in these studies. To this end, strengthening of adaptive capacity by diversifying households' livelihood options, improved education and early warning mechanisms would contribute to reducing vulnerability.
IV. CONCLUSION AND RECOMMENDATIONS
The study concludes that households in Oweto community, Agatu Local Government of Benue State are highly vulnerable to flood disasters due to high level of exposure and susceptibility and also weak adaptive capacity to cope with flood hazards, risks and impacts. Consequently, the study recommends that concerted efforts be made to relocate households living in close proximity to River Benue and its tributaries. Also, exploring other livelihood options in addition to agriculture would help boost their resilience capacity to cope with flood impacts and its associated vulnerability. Activation of early warning system should be strengthened in order to scale down the level of households' susceptibility and exposure to flood disasters in Oweto community.