


I. INTRODUCTION
Earlier we offered [1, 2, 3] to use an integrated indicator while forming the assessment of the region energy security:
We use the technique offered by us of creation - A set of the indicators characterizing energy security of the explored region [3];
The range of critical variables they relate to energy independence as set up by the individual conducting the study [1, 2];
Harington-Menchera function [8].
We use the technique offered by us of creation of an integrated indicator of energy security of Pridnestrovye.
II. PRE-PROCESSING OF DATA
We use the technique offered by us of creation of an integrated indicator of energy security of Pridnestrovye.
According to our technique previously it is necessary to transform values of indicators to values of dimensionless function of usefulness which we will call as private indicators of quality. This transformation is described in detail [4].
The technique used while forming an integrated indicator of energy security demands the values of the indicators used by us to be not correlated. For checking of implementation of this requirement we use the method of correlation groups .
At assessment of the size of energy security of Pridnestrovye we used 16 indicators. The range of critical variables was borrowed (with some changes) from [6].
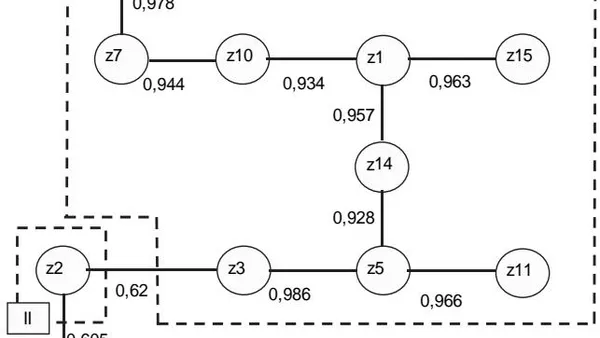
The columns of correlation groups received by us for indicators of energy security of Pridnestrovye at the 1st, 2nd iteration, are submitted on Fig 1, 2.
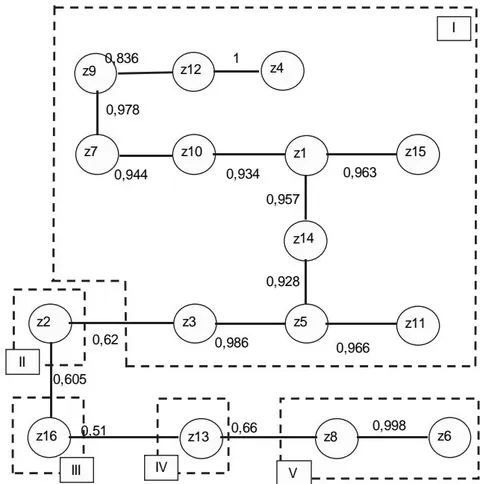
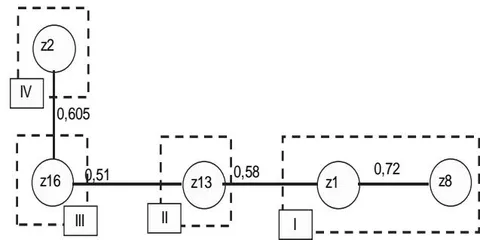
After the 1st iteration we received 5 groups presented on Fig 1. Let's choose as the representative of the 1st group the z1, the 5th group – z8, other galaxies contain only one indicator, each they are z2, z16, z13. Let's execute the 2nd iteration – we will construct a new count of correlation groups, for the above-stated representatives of groups. The result is presented on Fig 2.
III. THE ASSESSMENT OF PRIDNESTRORVIAN ENERGY SECURITY
As a result of the done work we received 4 groups, and one of them (No. 1) contains 13 indicators, and the others – only one indicator. There is a question how to deal with a set of the indicators belonging to the 1st galaxy. We cannot take one indicator and consider it as a representative of the whole group, as the values of the function of usefulness of the indicators entering galaxy No. 1, presented in Table 1, are various.
| Codes | Description of the indicator | Weight of indicators |
| z1 | Fuel consumption per capita | 0.5 |
| z3 | Power production per capita. | 0.5 |
| z4 | Development of heat power per capita. | 0.5 |
| z5 | The Share of own power sources in a balance covering in a year. | 0.9 |
| z7 | Share of block stations in the general rated capacity. | 0.6 |
| z9 | Level of wear of substations. | 0.6 |
| z10 | Carbon dioxide Emissions. | 0.4 |
| z11 | Electricity consumption per capita. | 0.6 |
| z12 | Consumption of the centralized heat power per capita. | 0.8 |
| z14 | Power consumption of GDP. | 0.5 |
| z15 | Electric capacitance of GDP. | 0.5 |
| z6 | Share of hydroelectric power station in the general power consumption. | 0.8 |
| z8 | Share of power of the largest power plant. | 0.6 |
Let's find the average value of private functions of usefulness of the indicators entering galaxy No. 1 and designate it as.
As the value characterizing a group is used the average value of private indicators of quality along all the members of a group. The values of the scales received by us as a result of poll experts' are presented in the right TABLE I column.
Data for calculation of the generalized function of usefulness are consolidated in Table 2.
| Codes | Description of an indicator | Group | Weight of groups |
| The average d1 value d1* on group No. 1 | 1 | 0,6 | |
| Share of the dominating fuel in total fuel quantity. | 2 | 0,8 | |
| Energy investments. | 3 | 0,5 | |
| Ratio of energy resources cost and average per capita income. | 4 | 0,7 |
| Mode of power supply system functioning | Values of weight coefficients | The combined integrated indicator value of D | |||
| Z1* | z2 | z16 | z13 | ||
| Normal | 0,8 | 0,1 | 0,5 | 0,9 | 0,545 |
| Pre-crisis initial | 0,8 | 0,2 | 0,45 | 0,75 | 0,444 |
| Pre-crisis developing | 0,8 | 0,3 | 0,4 | 0,7 | 0,363 |
| Pre-crisis critical | 0,8 | 0,4 | 0,4 | 0,65 | 0,301 |
| Crisis unstable | 0,8 | 0,5 | 0,35 | 0,6 | 0,254 |
| Crisis menacing | 0,8 | 0,7 | 0,3 | 0,55 | 0,184 |
| Crisis critical | 0,8 | 0,8 | 0,3 | 0,5 | 0,16 |
| Crisis extraordinary | 0,8 | 0,9 | 0,25 | 0,4 | 0,128 |
Calculations given in Table 2 are executed for normal working hours of power supply system [7]. It is obvious that in other working hours of power supply system, weight coefficients of indicators will change that will affect value of an integrated indicator. The example of similar calculations is given in Table 3. We received the values of scales as a results of experts' poll.
It is visible in Table 3 that weight of indicators very strongly depend on working hours of power supply system, so, at critical operating modes the value of economic indicators decreases (z13, z16) and the role of the indicator (z2) increases.
IV. ANALYSIS OF THE OBTAINED RESULTS
On closer examination Table 3 it is visible that in process of deterioration in a working hours of power supply system, the value of the combined integrated indicator of energy security of D falls. We need to find the reason causing this change.
Let's transform the formula on which there is a calculation of the generalized function of usefulness, as follows:
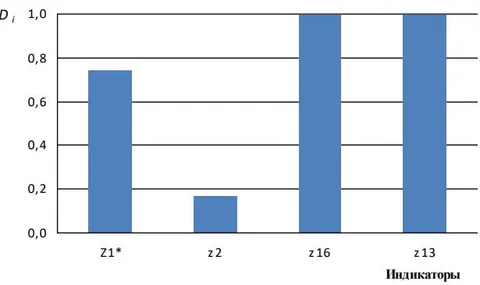
Here D1, D2, D3, D4 are factors of the combined integrated indicator of EB.
Let's execute calculations of D1, D2, D3, D4 values and we will construct on them the schedules presented on Fig 3, 4.
These schedules show that in process of working hours of power supply system changing (at invariable values of indicators, but the changing values of their scales), D2 factor size – a share of the dominating fuel in total fuel quantity falls that involves falling of size of all integrated indicator of ES.
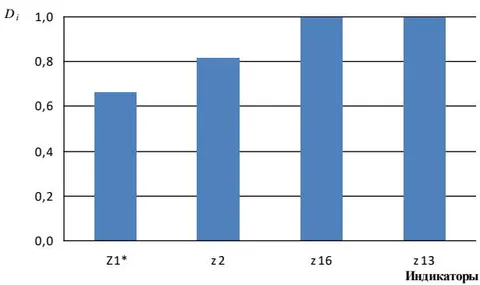
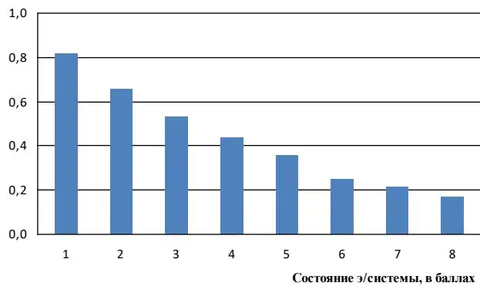
The schedule of size D2 dependence on working hours of power supply system is presented on Fig 5 it is visible that to a measure of deterioration in a working hours of power supply system size D2 decreases, and since the mode of functioning No. 5, passes into a zone of values "unsatisfactorily" (size D<0.37).
We made an attempt to number the estimate influence of possible values z2 indicators on energy security of the region, at invariable values of other indicators. Values of the indicator from 50% to 98% are for this purpose changed and the size of the combined integrated indicator of energy security of the region – D is counted. Calculation results are given in Table 4, 5.
| Values of the z2 indicator, in% | ||||||||
| 78 | 80 | 82 | 86 | 90 | 94 | 98 | ||
| No. of functioning of a system mode | 1 | 0,701 | 0,692 | 0,681 | 0,656 | 0,628 | 0,596 | 0,564 |
| 2 | 0,627 | 0,610 | 0,591 | 0,547 | 0,498 | 0,446 | 0,398 | |
| 3 | 0,580 | 0,556 | 0,530 | 0,472 | 0,410 | 0,348 | 0,293 | |
| 4 | 0,550 | 0,520 | 0,488 | 0,420 | 0,350 | 0,282 | 0,226 | |
| 5 | 0,518 | 0,483 | 0,447 | 0,370 | 0,294 | 0,225 | 0,170 | |
| 6 | 0,457 | 0,416 | 0,375 | 0,291 | 0,214 | 0,149 | 0,103 | |
| 7 | 0,434 | 0,391 | 0,348 | 0,262 | 0,186 | 0,124 | 0,082 | |
| 8 | 0,394 | 0,350 | 0,306 | 0,221 | 0,149 | 0,094 | 0,058 | |
Table 4 contains the values D calculated for various values of the z2 indicator. In the table values which are less, than 0.37 are highlighted in bold. It demonstrates that the power supply system of the region is in an unsatisfactory state. Values, smaller, than 0.2 are corresponded to a condition of the system "very badly". It is visible that these estimates depend on the mode of functioning of the region power system. So in modes No. 1, 2 at any values of the z2 indicator the system will not be in an unsatisfactory state, in modes No. 7, 8, for ensuring satisfactory work of power supply system, the value of the z2 indicator has to be less than 82%.
| Values of the z2 indicator, in% | |||||||||
| 66 | 68 | 70 | 72 | 74 | 76 | 78 | 90 | ||
| No. functioning of a system mode | 1 | 0,738 | 0,734 | 0,729 | 0,723 | 0,717 | 0,709 | 0,701 | 0,628 |
| 2 | 0,699 | 0,69 | 0,681 | 0,67 | 0,657 | 0,643 | 0,627 | 0,498 | |
| 3 | 0,682 | 0,67 | 0,656 | 0,64 | 0,622 | 0,602 | 0,580 | 0,410 | |
| 4 | 0,678 | 0,663 | 0,645 | 0,625 | 0,602 | 0,577 | 0,550 | 0,350 | |
| 5 | 0,674 | 0,654 | 0,632 | 0,608 | 0,580 | 0,551 | 0,518 | 0,294 | |
| 6 | 0,65 | 0,625 | 0,597 | 0,566 | 0,532 | 0,496 | 0,457 | 0,214 | |
| 7 | 0,644 | 0,617 | 0,586 | 0,552 | 0,515 | 0,476 | 0,434 | 0,186 | |
| 8 | 0,620 | 0,590 | 0,556 | 0,519 | 0,480 | 0,438 | 0,394 | 0,149 | |
For comparison we will consider the same results of calculation, but we will compare the received values to number 0.63 – border of good and satisfactory functioning of power supply system. The received results are given in Table 5. From the table it is visible that for ensuring good functioning of a system the value of the z2 indicator in the 8th mode has to be less than 66%, and in the 1st mode – less than 90%.
Relying on the values given above, it is possible to claim that for increase in level of energy security of power supply system of the region, it is necessary to have an opportunity, to reduce a share of the dominating fuel at the modes of functioning of power supply system other than normal. Let's consider one of possible options of such actions is the translation of the unit of the Pridnestrovian state district power plant which provides with the electric power Pridnestrovye on other type of fuel – coal. It is known that the Pridnestrovian state district power plant has the corresponding equipment which is in the preserved state now.
The state district power plant uses from 30% to 40% of the gas consumed by Pridnestrovye. It allows to claim that conversion of the corresponding unit of state district power plant to coal will allow to reduce a share of the dominating fuel by 27-36%, that is the indicator that accepts values in the range from 60% up to 55%. From tables 4, 5 it is clear that it will allow, to increase the level of energy security of the region for satisfactory condition, regardless of the mode of functioning of power supply system.