The research aims to conduct a monthly study of water quality by conducting several physical and chemical tests for sulfur spring water in the Bashtabiya Castle area, which is located on the western bank of the Tigris River in the city of Mosul, and for that, monthly samples were collected from three springs for five months during the period from October The second is 2020 until March 2021.
## I. INTRODUCTION
Groundwater is the water that moves and collects in the ground within the geological formations and soil layers, which directly affects the properties of this water (Mohammed, 2015). The amount of water drainage from the springs varies, and the different sources of this water pass through the pores of the soil, which filters its contents and dissolves many salts and elements in it, giving it a high percentage of salinity. That is why it is called mineral water and it is also known as hot water because of its high temperature (Al-Zamili and Al-Asadi, 2014).
Spring water flows from under the surface of the earth and is formed naturally in special water tanks that do not mix with surface water and do not need to make changes or add chemicals. The chemistry of mineral water and its volume change from one place to another according to the conditions of its formation and the type of formation layers in which this water is stored (Matar and others, 2009). A liter of water (Al Taweel, 2017), the layers of gypsum rocks, and the crater located under the surface of the earth provided a suitable environment for the formation of sulfur supported by special types of anaerobic bacteria, as $\mathsf{H}_2\mathsf{S}$ gas is released, which interacts with the oxygen dissolved in the water to form sulfuric acid $\mathsf{H}_2\mathsf{SO}_4$, thus forming acidic sulfur water. There are two sources of liberated $\mathsf{H}_2\mathsf{S}$ gas, the first represented by gas mainly located in the depths and its quantity is small compared to the second source, which is due to bacterial activity, and as products of sulfur formation and reduction resulting from sulfates, the produced gas is oxidized in the presence of special types of bacteria to form sulfuric acid $\mathsf{H}_2\mathsf{SO}_4$ (Aswad et al., 2018).
## II. STUDY AREA
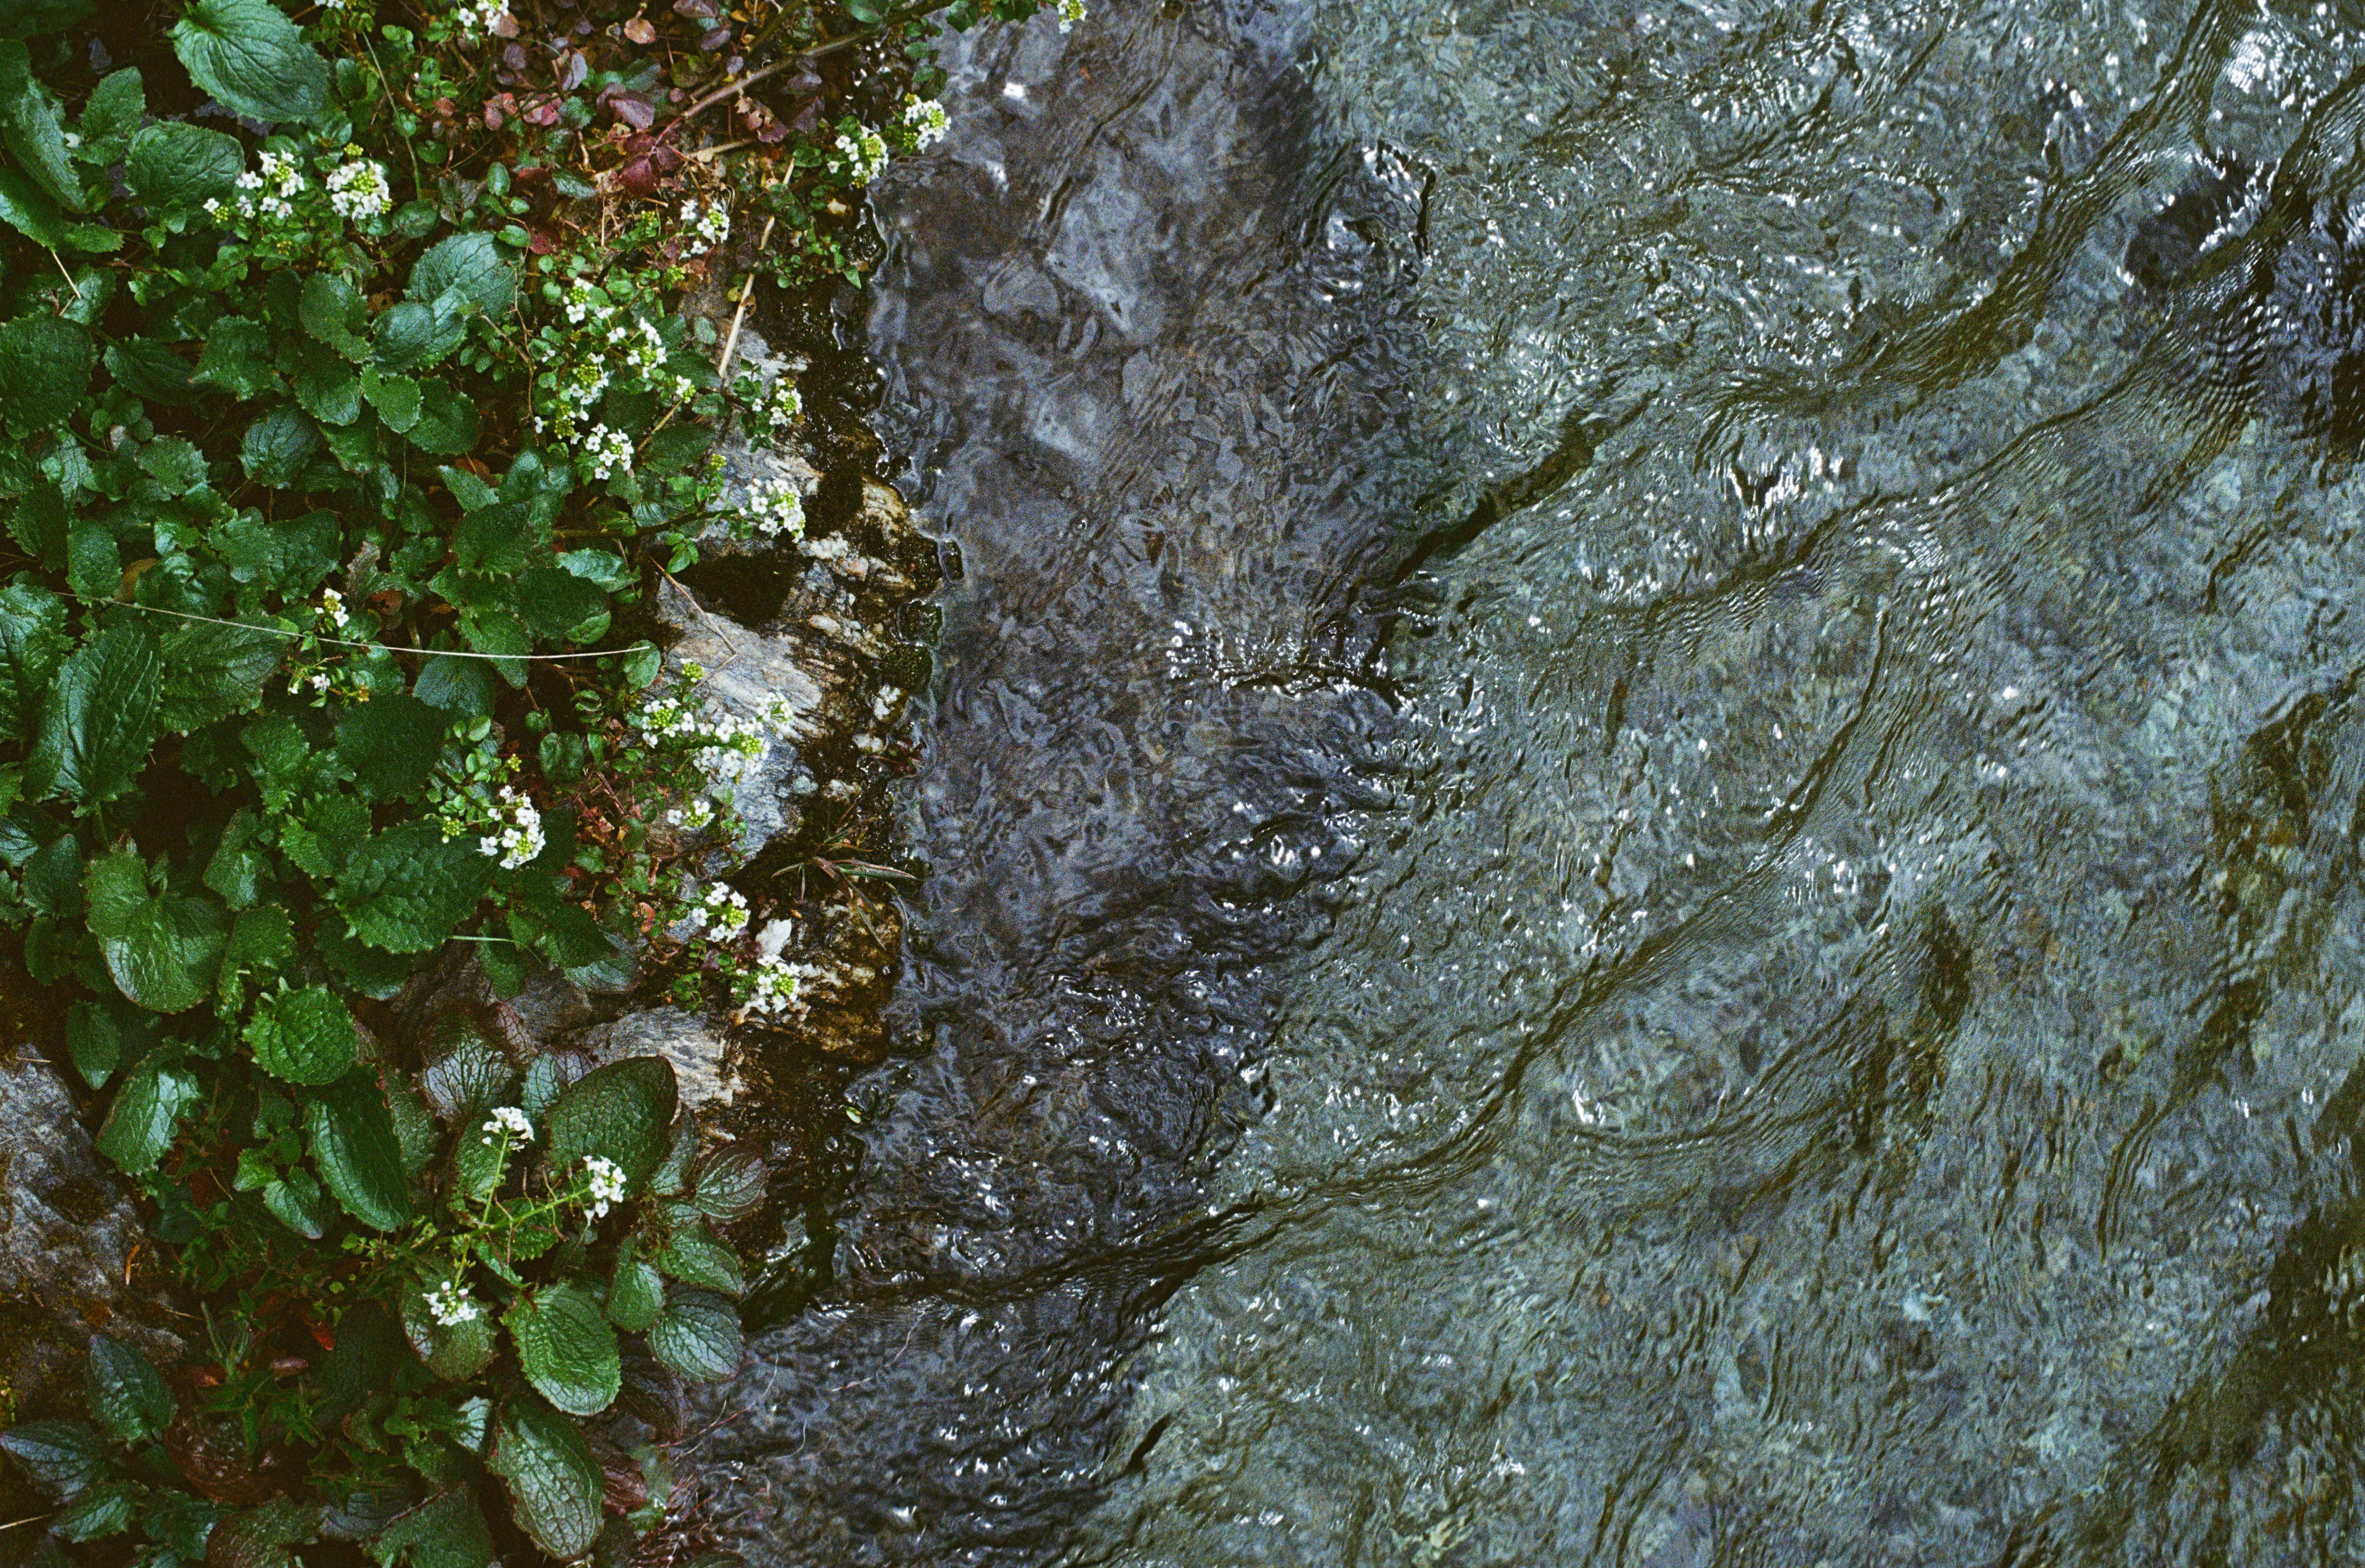
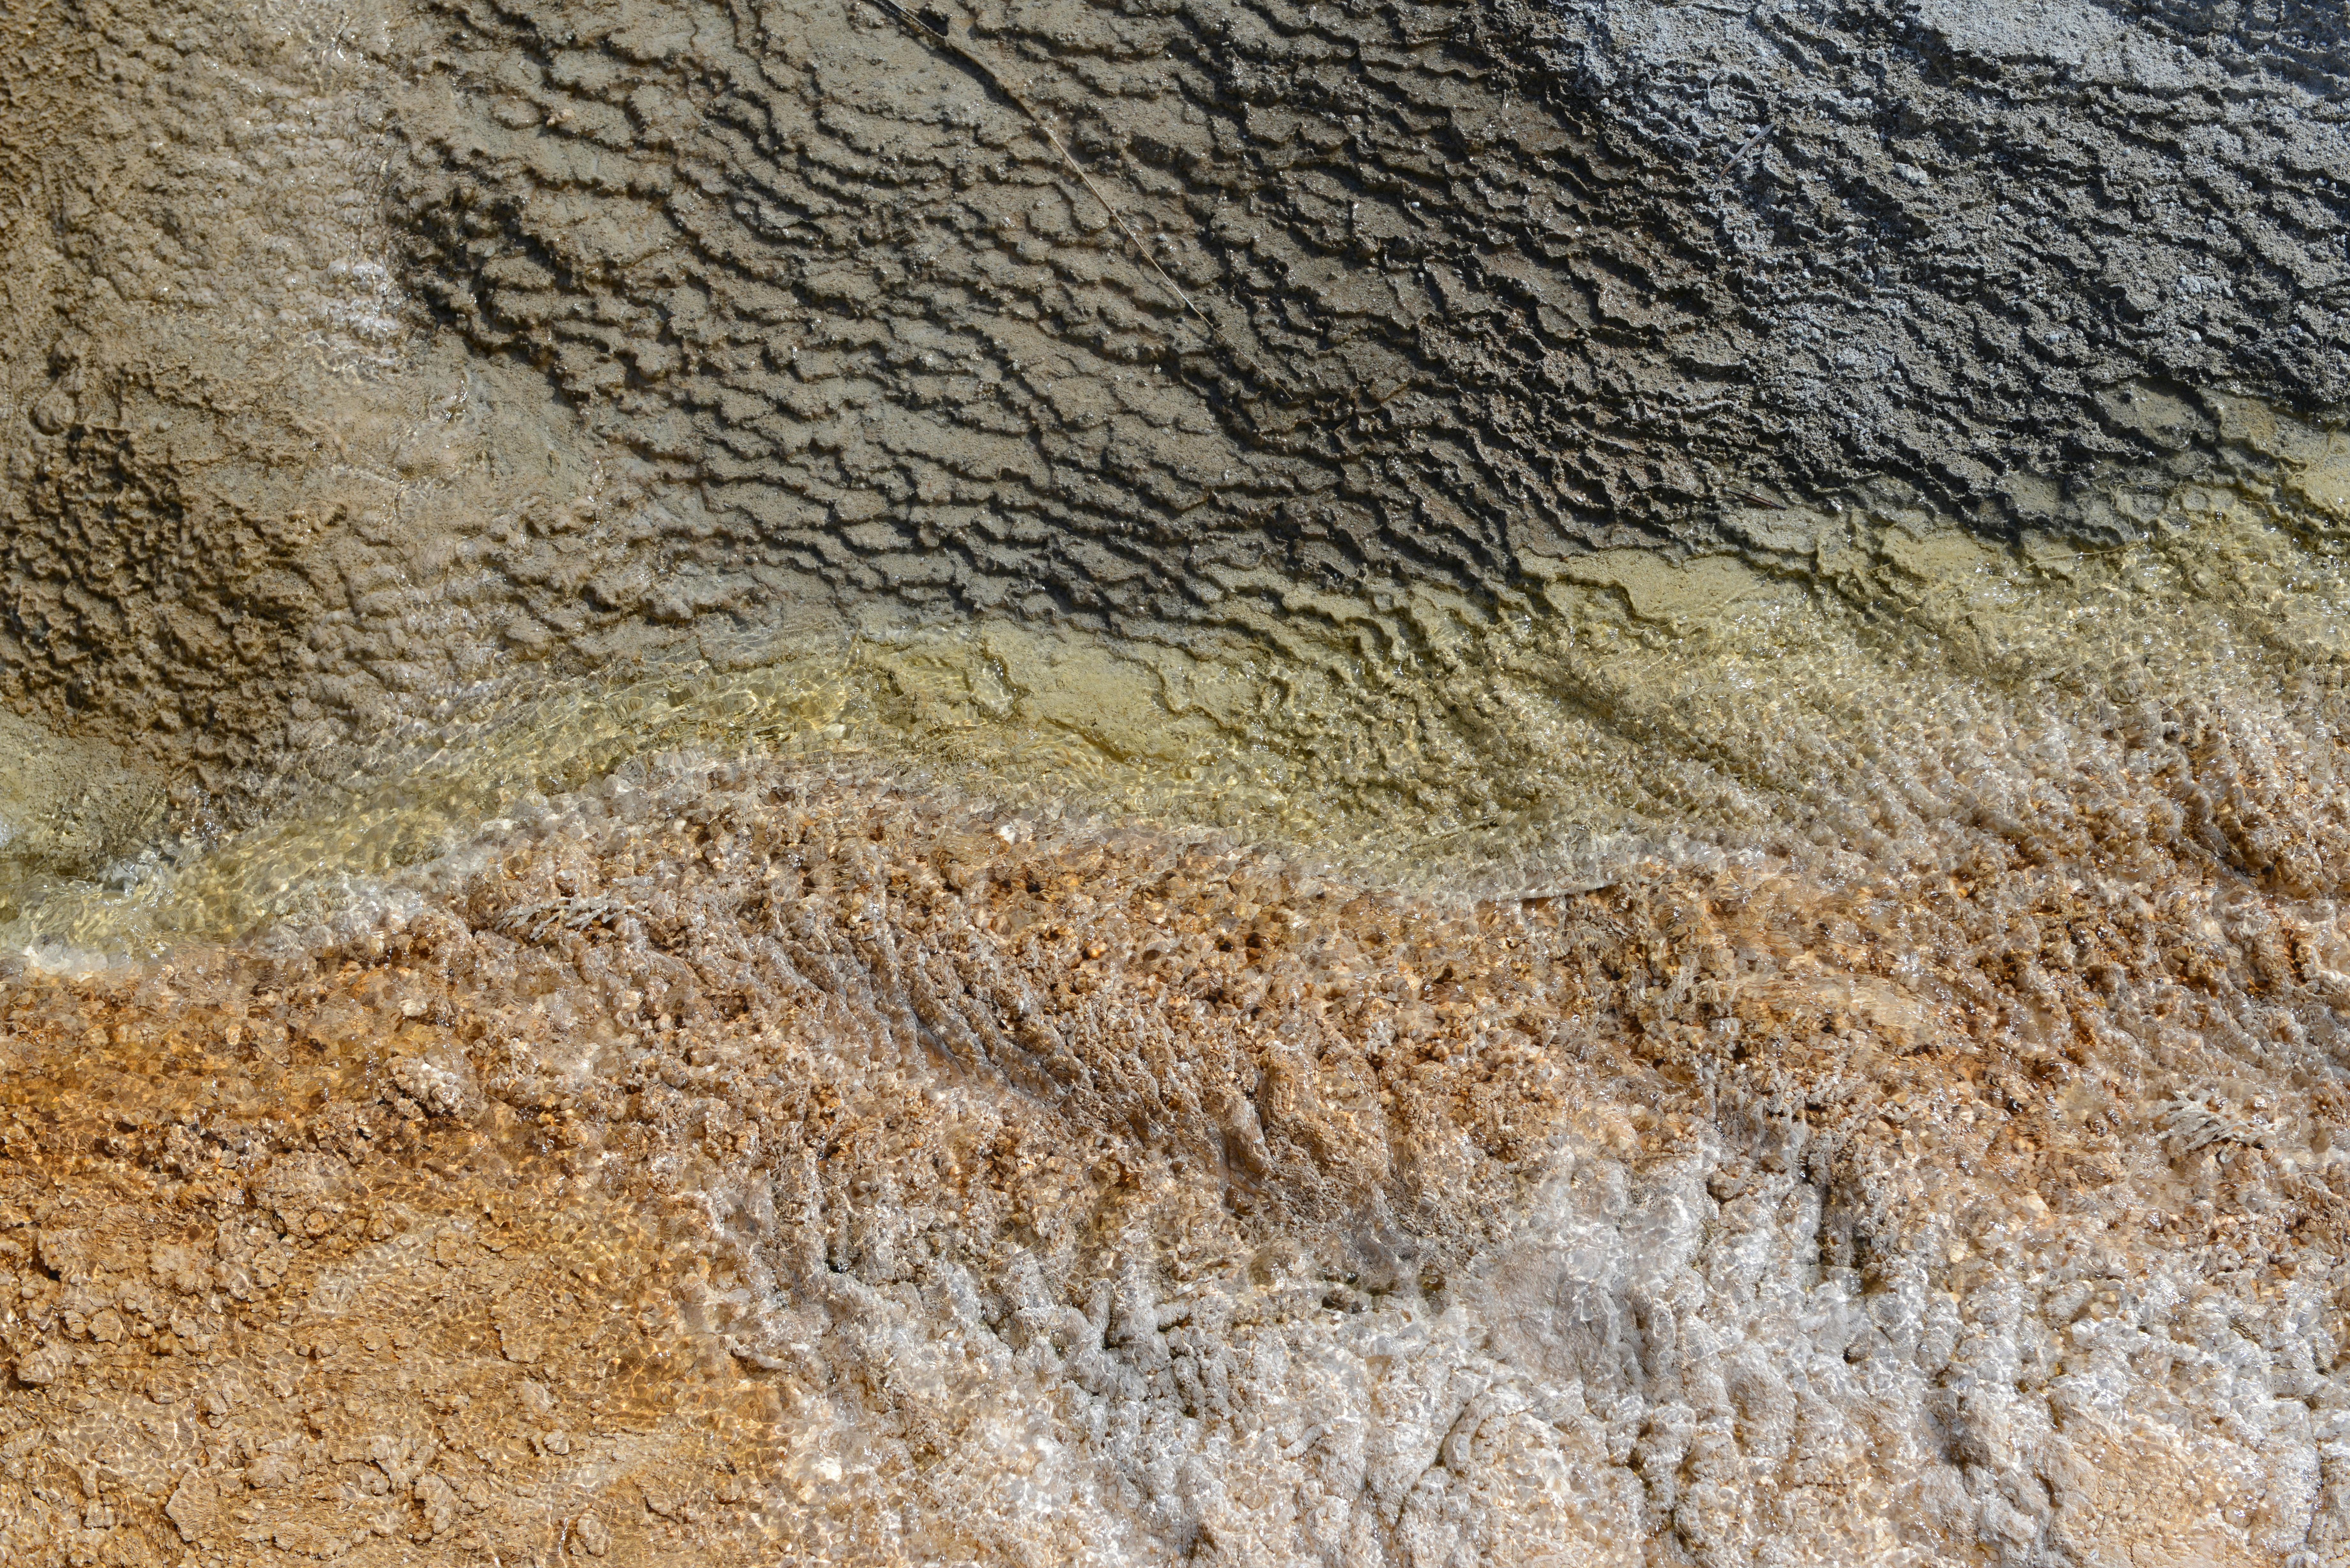
The study area included a number of sulfur springs, which are located on the western bank of the Tigris River in the city of Mosul, which is close to the Bashtabiya Castle. Monthly models were taken to study three hot and cold sulfur springs, Table (1). The study area is characterized by a hot, dry climate in summer and cold and rainy in winter, according to the data of the weather station in Mosul.
Table 1: Shows the location of the sulfur springs near the castle of Bashtabia
<table><tr><td rowspan="2">Spring name and their locations</td><td colspan="3">Locations</td></tr><tr><td></td><td>E</td><td>N</td></tr><tr><td rowspan="3">Bashtabiya</td><td>1</td><td>43° 12'00"96</td><td>36°35'67"51</td></tr><tr><td>2</td><td>43° 12'01"60</td><td>36°35'67"63</td></tr><tr><td>3</td><td>43° 12'00"78</td><td>36°35'67"75</td></tr></table>
## III. SAMPLE COLLECTION
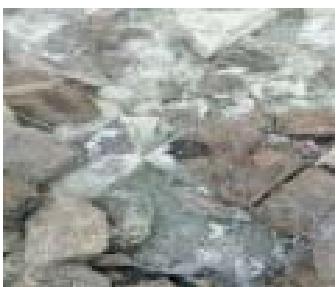
Fifteen water samples were collected at a rate of 3 samples per month from three springs near the castle of Bashtabyia (3 samples/spring) for a period of five months during the period from November 2020 to March 2021 using sterile polyethylene bottles of $250\mathrm{ml}$ capacity for biological tests and a capacity of 2 liters for chemical and physical tests. By immersing the bottle after homogenizing it several times gradually so that its direction faces the flow of water, where the sample was taken and its nozzle was re-sealed tightly inside the water and closed with aluminum foil tightly closed and was kept in a box of iced cork until it was transferred to the laboratory for biological, chemical and physical tests.
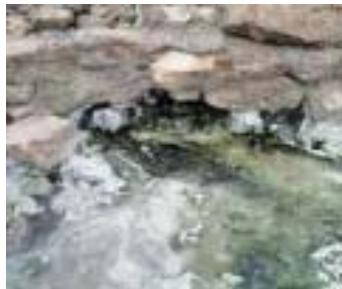 Image 1: The first location Image
 (2) the second location
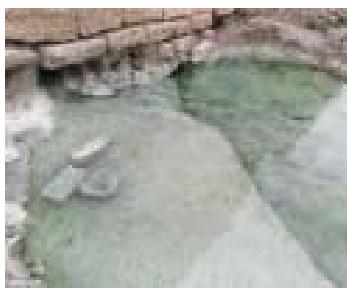 Image (3) the third location
## IV. METHODS
### a) Physical tests
It includes the measurement of temperature using an alcohol thermometer, measured in degrees, the measurement of total dissolved solids using a T.D.S meter, and electrical conductivity using an E.C meter in micromoz/cm.
### b) Chemical tests
The measurement of the pH using a pH meter after regulating it with buffer solutions includes the total hardness by scavenging with $\mathrm{Na}_2\mathrm{EDTA}$, the total alkalinity by the guide method, and the determination of sulfate and phosphate by the spectrophotometer, as well as the determination of sodium and potassium ions using a photometric spectrometer. The flame photometer expressed the concentration in mg/l, and finally measured the oils and greases.
### c) Biological tests
Bacteriological tests were represented by the total count of bacteria by making a dilution of each sample to a dilution $(10^{-5})$ with a solution of physiological salt (Normal slain), and placing 1 ml of each of the dilution $(10^{-3}, 10^{-4}, 10^{-5})$ in a dish. A sterile petri, pour the cooled and sterile Nutrient Agar into the dish and move the plate in the form of No. 8 until the sample is homogeneous and after solidification of the medium is placed upside down in the incubator and incubated aerobically and anaerobic at a temperature of $37^{\circ} \mathrm{C}$ for 24-48 hours.
## V. RESULT & DISCUSSION
Water quality depends on the different physical, chemical and biological properties of water, as well as the standard specifications used to measure water quality (Al-Lahibi, 2021).
### a) Physical tests
## i. Tempreture
Temperature is one of the most important indicators of water quality that affects the physical and chemical properties of water (Larnier et al. 2010). The average temperature ranged between (21.74-22.04) C, the highest rate was in site No. 1 or the lowest was in site 3. The reason for the high temperature of this water is attributed to the chemical reactions that emit heat that accompany the dissolution of the mineral materials that make up gypsum rocks and dolomite when the water of Al-Ayoun passes through it (Al-Hamdani, 2020). As shown in Table No. 2 and Figure.
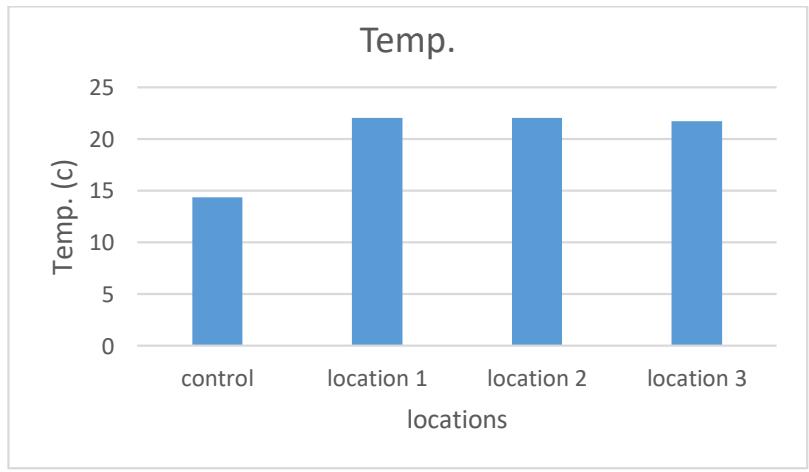 Figure 2: Averages of the temperature of the studied spring water $(^{\circ}\mathrm{C})$
## ii. Electric Conductivity
Electrical conductivity is the ability of water to transmit electric current and depends on the concentration of dissolved ions in the water and temperature, as it is directly proportional to them (Al-Hamdani, 2020). Its rates reached (5158.59- 5521.795) micromoz/cm. The highest rate was in Site 3 and the lowest was in Site 1, as shown in Table 2 and Figure 3. The reason may be due to the rocky nature of the geological formations of the studied areas (Al-Saffawi, 2019).
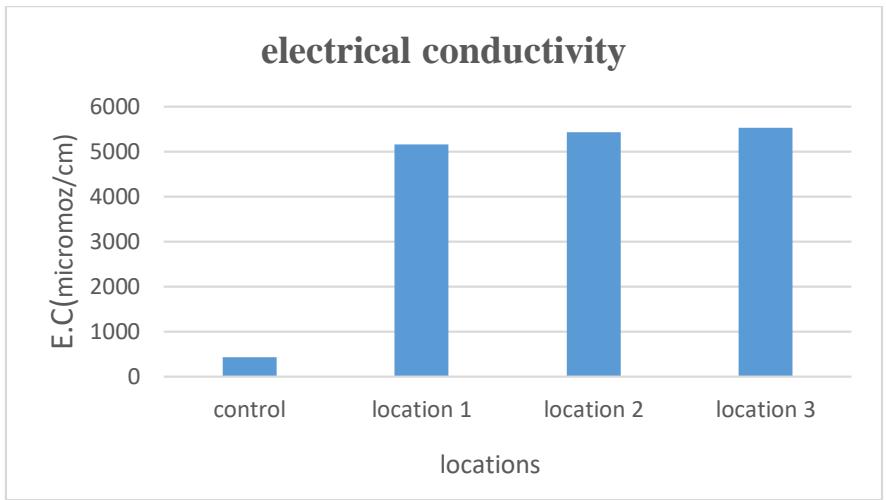 Figure 3: The electrical conductivity rate of the studied spring water (micromoz/cm)
## iii. Total Dissolved Solid
Solids in water represent an important indicator to know the amount of substances or molecules in water, and they include different substances, organic and inorganic substances, or they may be in the form of solid substances dissolved in water consisting of negative ions of compounds combined with ions of positive elements (Bee, 2005). The rates of total dissolved solids were between (2579.6- 2761) mg/L, where the highest value was reached in Site 3 and the lowest in Site 1. The reason may be due to the difference in the geological formations of the layers through which the water passes (Al-Hamdani, 2020). As shown in Table 2 and Figure 4.
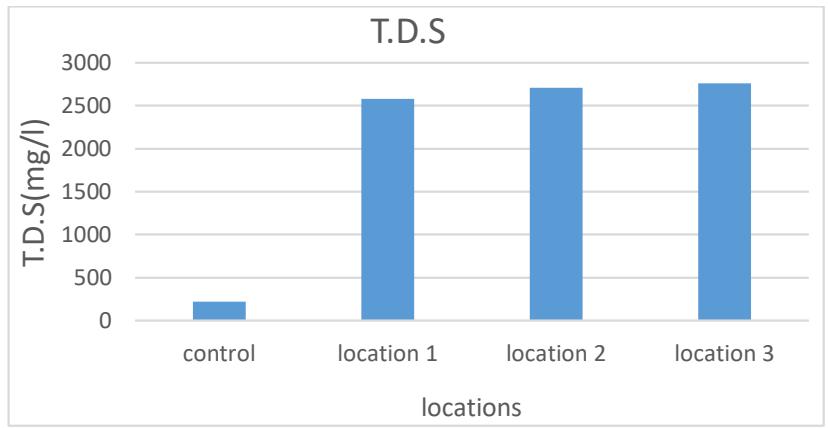 Figure 4: Total Dissolved Solids (TDS) of the studied spring water $(\mathrm{mg / L})$
### b) Chemical Tests
## i. pH
It is evident from Table (2) and Figure (5) that the rates were between (6.9-7), the highest rate in site 3 and the lowest in site 2. The reason may be due to the neutralization of the acidity of water and soil with carbonates and bicarbonate salts (Al-Safawi et al.,
2018), and the decrease is due to Some values refer to the biological processes of oxidation and decomposition of organic matter when the oxygen concentration drops to critical levels, thus forming a number of carboxylic and acidic compounds (Sharaky & Abdoun, 2020).
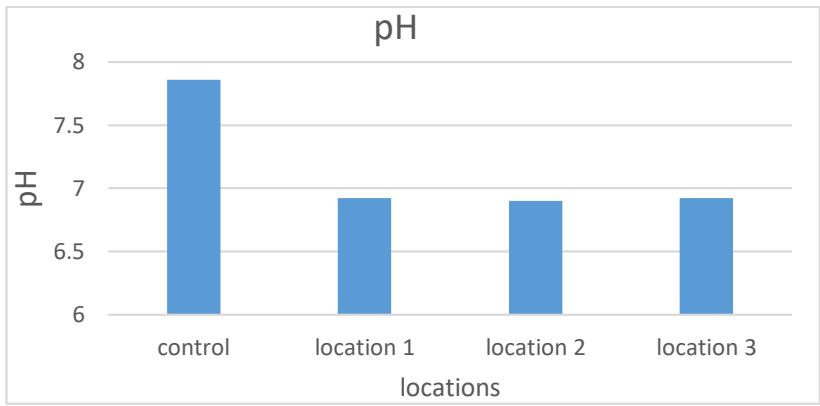 Figure 5: Averages of the pH function of the studied springs water
## ii. Total Alkalinity
The alkalinity is the amount of negative ions present in water and the resistance to hydrogen ion, and thus it is a measure of water's susceptibility to acidity (Moses & Ishaku, 2020); The results showed the total alkalinity rates, which were between (452-649 mg/L), where the highest value was in site 3 and the lowest value in site 2. The reason for the presence of alkalinity in water is the presence of carbonate, bicarbonate and hydroxide ions. Bicarbonate ion due to the pH values not exceeding 8.3 (Fadipe & Oladepo, 2020). As shown in Figure (6) and Table (2).
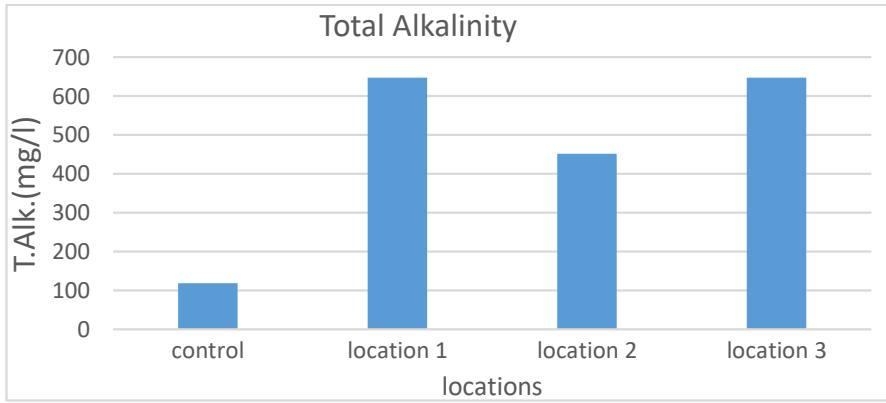 Figure 6: The total alkalinity of the studied spring water (mg/L)
## iii. Total Hardness
Total hardness is a relative indicator to know the total dissolved solids. Calcium, magnesium, and bicarbonate ions make up the majority of the total dissolved solids. Hardness expresses the water's suitability. Less than that, its effect will be limited (Merdah and Yassin, 2007; Al-Lahibi, 2021). It was
(2080-2220) mg/L in terms of $\mathrm{CaCO}_3$, the highest rate was in site 2 and the lowest in site 3 as shown in Table 2 and Figure 7. The reason for the presence of total hardness in water is the positive ions, especially calcium and magnesium ions (Verma et. al., 2018; Al-Hamdani, 2020).
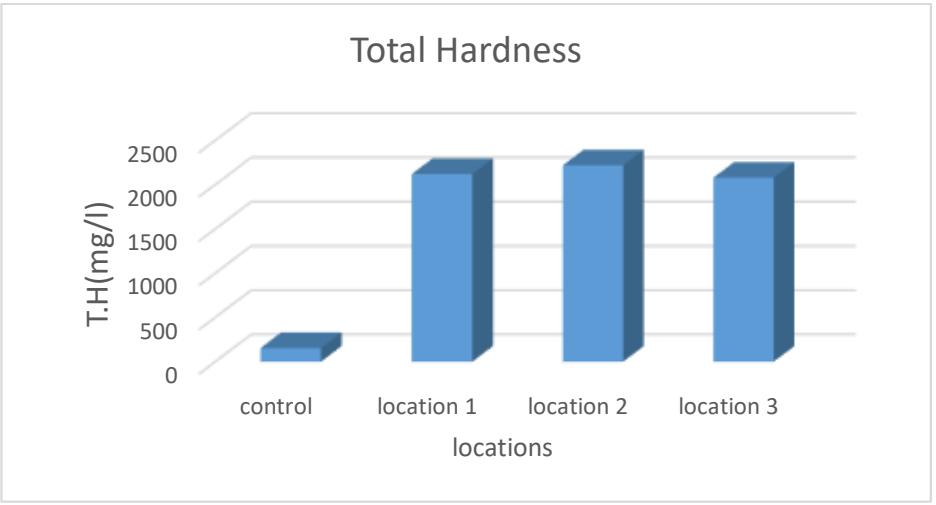 Figure 7: The total hardness of the studied water (mg/L)
## iv. Sulphate lons
It is evident from Table 2 and Figure 8 that the sulfate ion rates ranged between (2310.8-2365.3) mg/L, as the highest rate was in Site 1, while the lowest was in Site 3. The reason for the presence of sulfate ion concentrations is due to the nature of the geological rocks through which the water passes. The dissolution of gypsum rocks and weathering processes is the main reason for the increase in sulfate concentrations in the study area (Egbueri et. al., 2019), as well as the exposure of some sulfur minerals to oxidative conditions in the presence of water and Thiobacillus ferrooxidans bacteria that leads to the liberation of ions of some chemical elements and the formation of acid. Dilute sulfuric in sulfuric water (Duruibe et al. 2007).
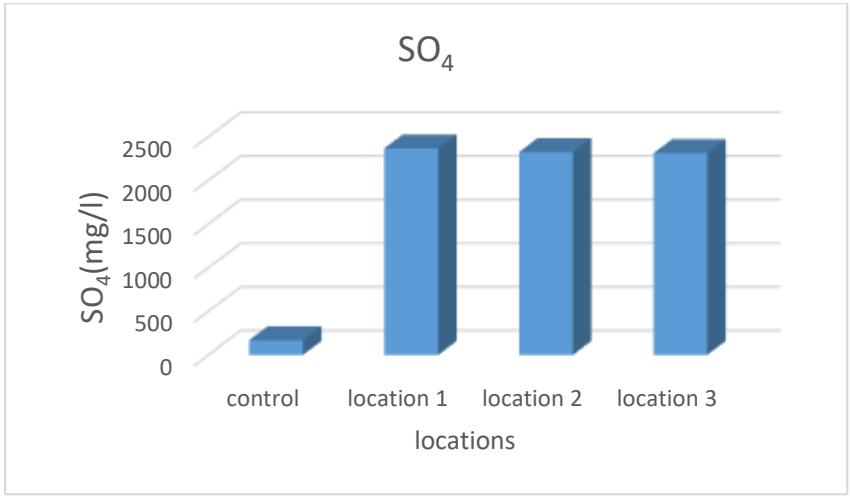 Figure 8: Sulfate ion rate for the studied spring water (mg/L)
## v. Phosphate lons
The results of the study showed that the phosphate ion rate was between (0.0215- 0.0448) mg/L as shown in Figure 9 and Table 2, where the highest value was in Site 2 and the lowest in Site 1 and the reason for the decrease in these values may be due to the ability to precipitate phosphate in the form of calcium phosphate $\mathrm{Ca}_{3}(\mathrm{PO}_{4})_{2}$ as well as its adsorption by some clay minerals and organic compounds, which reduces its transfer to the aquatic environment (Ohwoghere-Asuma et. al., 2020).
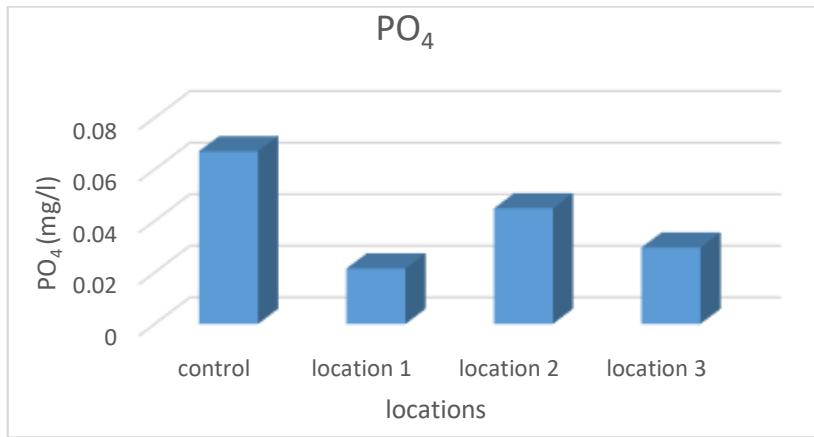 Figure 9: Phosphate ion rate of the studied spring water (mg/L)
## vi. Sodium and Potassium Ions
Figure 10 and Table 2 show that the highest rate of sodium and potassium ion is in site 3, while the lowest is in site one, as their rates ranged between (376-447) and (31.4-36.2) mg/liter, respectively. The reason for the presence of sodium ion may be attributed to the nature of geological formations For the earth layers through which water passes, as well as the processes of weathering, when water reaches the sod minerals, sodium ions will be released (Hui, 2020). As for the presence of potassium ion in these low concentrations compared to sodium, it is due to its adsorption by soil particles within the geological layers of the studied areas (Ibrahim & Nofal, 2020).
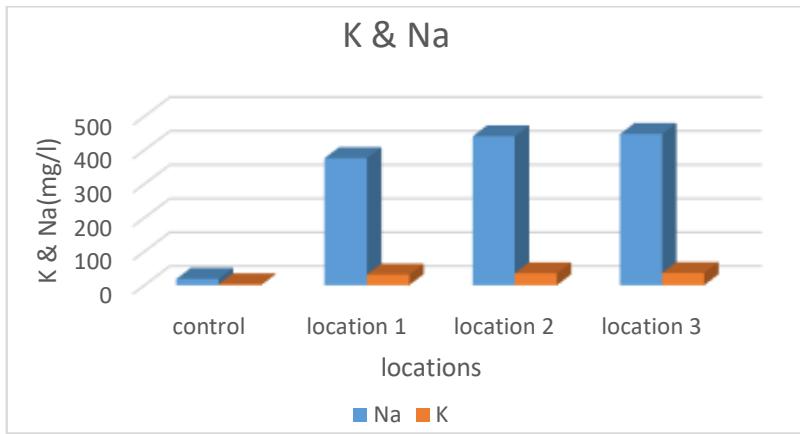 Figure 10: Average of sodium and potassium ions for the studied spring water (mg/L)
## vii. Oil and Grease
The results of the current study indicated the concentration rates of oils and greases in the studied sulfur springs, which ranged between (0.169-0.184) mg/L, and the superiority of site 1 in the concentration of oils and grease and the lowest average concentrations in site 2 that the presence of oils and grease in water may indicate that these The water is coming from layers that contain oil, as evidence of the presence of bitumen, because the bitumen is one of the oil derivatives (Mahmoud et al., 2006), as shown in Table (2) and Figure (11).
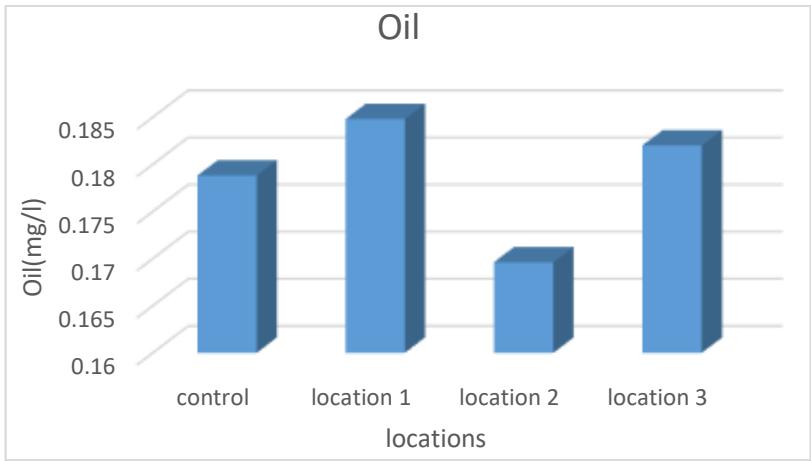 Figure 11: Oil rate of the studied springs water (mg/L)
### c) Biological tests
## i. Total Plate Count
Tests of the total number of bacteria are among the important indicators that include total aerobic, facultative and non-autotrophic bacteria. These numbers are usually approximate, but most of them are due to the inability to provide a nutrient medium and suitable conditions for the growth of all species (Juma, 2017). Through the results, it is clear that the number of bacteria exceeded the limit allowed by the World Health Organization, which ranged between (0.5-3.25) cells/ml. The highest rate was in site 1 and the lowest in site 2 as shown in Table 3 and Figure 11. The increase in bacterial numbers coincided With the high temperatures, which are suitable for the growth and reproduction of bacteria, and the low temperature in the winter season, their numbers decreased (Al-Omar, 2010).
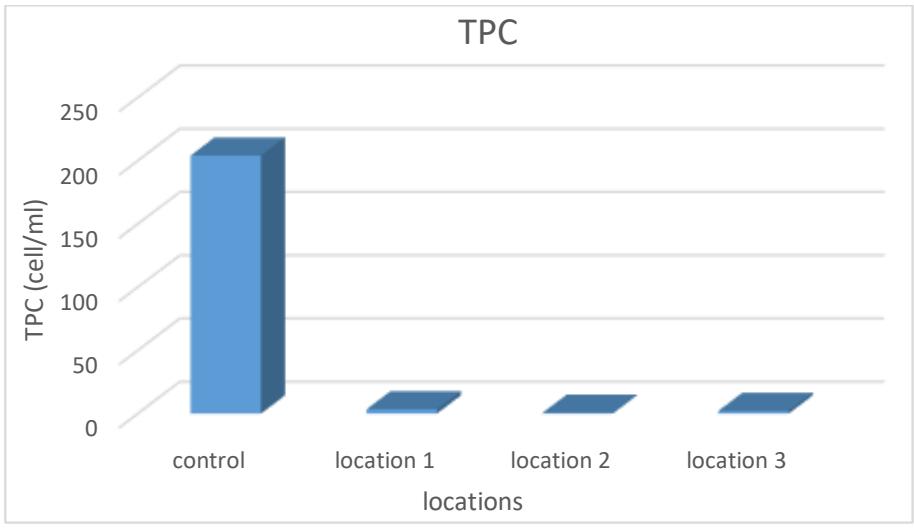 Figure 11: Average total number of bacteria in the studied spring water (cell/ml)
Table 2: Rate of physical and chemical tests of spring water
<table><tr><td>Test location</td><td>Temp.</td><td>pH</td><td>E.C</td><td>T.D.S</td><td>T.Alk.</td><td>T.H</td><td>SO4-2</td><td>PO4-3</td><td>Na+</td><td>K+</td><td>Oil</td></tr><tr><td>control</td><td>14.34</td><td>7.86</td><td>435.719</td><td>217.8</td><td>119</td><td>154.8</td><td>166.9</td><td>0.067</td><td>18.8</td><td>2.48</td><td>0.1788</td></tr><tr><td>location 1</td><td>22.04</td><td>6.92</td><td>5158.59</td><td>2579.6</td><td>648</td><td>2120</td><td>2365.3</td><td>0.02154</td><td>376</td><td>31.4</td><td>0.1848</td></tr><tr><td>location 2</td><td>22.02</td><td>6.9</td><td>5423.23</td><td>2711.8</td><td>452</td><td>2220</td><td>2322.6</td><td>0.04482</td><td>440.6</td><td>34.8</td><td>0.1696</td></tr><tr><td>location 3</td><td>21.74</td><td>7</td><td>5521.8</td><td>2761</td><td>649</td><td>2080</td><td>2310.8</td><td>0.0296</td><td>447.8</td><td>36.2</td><td>0.182</td></tr></table>
Table 3: Total number of bacteria (TPC)
$\times {10}^{5}$ cells. ${\mathrm{{ml}}}^{-1}$
<table><tr><td colspan="7">TPC</td></tr><tr><td>MON. LOC.</td><td>11</td><td>12</td><td>1</td><td>2</td><td>3</td><td>AVG.</td></tr><tr><td>Control</td><td>HEAVY</td><td>295</td><td>280</td><td>115</td><td>126</td><td>204</td></tr><tr><td>LOC. 1</td><td>2</td><td>0</td><td>5</td><td>4</td><td>4</td><td>3.25</td></tr><tr><td>LOC. 2</td><td>1</td><td>0</td><td>0</td><td>2</td><td>0</td><td>0.5</td></tr><tr><td>LOC. 3</td><td>5</td><td>2</td><td>1</td><td>5</td><td>0</td><td>2</td></tr></table>
## VI. CONCLUSION
The water is of a moderate type of acidic water, and this water is important for the recovery of diseases due to its high content of sulfates and its high temperature. at the optimum interest. It is considered unfit for drinking if we take into account the concentration of sulfates without regard to the rest of the characteristics. It contains more than $400\mathrm{mg}$ / liter in addition to the taste and smell. It is also characterized by being very hard because it contains concentrations higher than $180\mathrm{mg}$ / liter and with high salinity because it contains calcium and magnesium salts.
Generating HTML Viewer...
References
24 Cites in Article
Radhwan G. Alkassar,Yousif H. Al-Aqeeli,Zeyad Sulaiman (2018). STEADY-STATE GROUNDWATER FLOW MODELING TO ASSESS WATER DEMAND IN ERBIL CITY, NORTHERN IRAQ.
Nour Al-Hamdani,Ahmed Saadoun (2020). Application of water quality indicators to assess the water quality of a number of wells in the left coast of the city of Mosul / Iraq.
Ayed Al-Zamili,; Jassem,Al-Asadi,Hamza Kamel,Fleifel (2014). Variation of the characteristics of groundwater in the western plateau of Najaf Governorate using geographic information systems.
Abdulaziz Al-Safawi,Younis Talei,Al-Shannouna,Reem Adnan,Abdul Razzaq,Al-Sardar Nour,Maysir Sadiq (2018). Evaluation of water quality characteristics and calculation of the coefficient (WQI) for some water sources in Abu Maria village, Tal Afar District, Nineveh Governorate.
Lama Al-Taweel,Saleh Jabbar (2017). Study of some characteristics of sulfur spring water in Al-Hasya and Al-Khasf regions / Iraq.
Muthanna Al-Omar,Abdul-Razzaq (2010). Environmental pollution. First Edition.
Hudhaifa Al-Hamandi,Yasir Al Janabi,Ahmed Ahmed,Mijbil Aljumaily,Mohammed Al-Obaidi (2021). Relationship between biochar addition, clay minerals, potassium forms and soil properties in some gypsiferous soils in Iraq.
Zuhair Gomaa,Gerges (2017). Evaluation of the performance efficiency of some sewage treatment plants in the city of Kirkuk.
Sheno Muhammad,Ali Mustafa (2015). Study of groundwater quality in Kirkuk Governorate.
Sharif Mahmoud,Khaldoun Maaleh,; Abbas,Hamid Ahmed,Saeed (2006). The mineral water of the springs of Heet-Kabisa area, central western Iraq.
Iyad Matar,Tahseen Abdel-Razzaq; Zidane,Ali; Mahmoud,Abdel Bashar,Aziz (2009). Analytical comparative study of lime and sulfur spring water in Hit.
A Al-Saffawi (2019). Water quality of Nimrud district wells southeast of Mosul city for drinking and civil purpose using the Canadian model of water quality.
L Bee (2005). Filter system saves mains water usage.
J Duruibe,M Ogwuegbu,J Egwurugwu (2007). Heavy metal pollution and human biotoxic effects.
Johnbosco Egbueri,Chukwuma Mgbenu,Chidinma Chukwu (2019). Investigating the hydrogeochemical processes and quality of water resources in Ojoto and environs using integrated classical methods.
O Fadipe,K Oladepo (2020). Temporal variation of groundwater resources in Ilesa West Local Government, Osun State Nigeria.
T Hui,D Jizhong,M Shimin,K Zhuang,G Yan (2021). Application of water quality index and multivariate statistical analysis in the hydrogeochemical assessment of shallow groundwater in Hailun, northeast China.
L Ibrahim,E Nofal (2020). Quality and hydrogeochemistry appraisal for groundwater in Tenth of Ramadan Area, Egypt.
K Larnier,H Roux,D Dartus,O Croze (2010). Water temperature modeling in the Garonne River (France).
A Merdhah,A Yassin (2007). Scale Formation in water Reservior During Water Injection at Haigh-Salinity Formation Water.
A Moses,S Ishaku (2020). Evaluation of Physico-Chemical Properties of Well Water Qualities in Selected Villages in Zing Local Government Area of Taraba State, Nigeria.
Oghenero Ohwoghere-Asuma,Ruth Iserhien-Emekeme,Kizito Aweto,Merrious Ofomola (2020). Geophysical investigation of resistivity and groundwater quality in Ogbe-Ijoh coastal area of the western Niger Delta of Nigeria.
Abbas Sharaky,Suad Abdoun (2020). Assessment of groundwater quality in Bahariya Oasis, Western Desert, Egypt.
Dharmendra Verma,Gouri Bhunia,Pravat Shit,Ashwani Tiwari (2018). Assessment of Groundwater Quality of the Central Gangetic Plain Area of India Using Geospatial and WQI Techniques.
No ethics committee approval was required for this article type.
Data Availability
Not applicable for this article.
How to Cite This Article
Dr. Yussra Majed Alshaker. 2026. \u201cAssessment of the Water Quality of some Sulfur Springs in the Bashtabia area within the City of Mosul\u201d. Global Journal of Science Frontier Research - H: Environment & Environmental geology GJSFR-H Volume 22 (GJSFR Volume 22 Issue H3).
Explore published articles in an immersive Augmented Reality environment. Our platform converts research papers into interactive 3D books, allowing readers to view and interact with content using AR and VR compatible devices.
Your published article is automatically converted into a realistic 3D book. Flip through pages and read research papers in a more engaging and interactive format.
Our website is actively being updated, and changes may occur frequently. Please clear your browser cache if needed. For feedback or error reporting, please email [email protected]
Thank you for connecting with us. We will respond to you shortly.