Cytopathology of thyroid cells is an established method to detect malignancies in the thyroid. It is of advantage because an anesthesia and a diagnostic laparotomy is not necessary. There are however not yet many studies about automated cytopathology in thyroid cells. To this end, the aim of the present study was to establish an automated diagnosis of malignancy using image analysis and subsequent machine learning and Artificial intelligence. Light microscopy images of 52 patients were analyzed and the results were compared to those of pathology. The results of the automated analysis yielded a sensitivity of 0.94 and a specificity of 0.91 when compared to those of the pathologic diagnoses. The process of machine learning yielded an under curve area of 0.91 as calculated by a ROC-curve. The software used for image analysis, machine learning and classification (diagnosis) are open-source software, respectively.
## I. INTRODUCTION
Histopathology (HP), a technique that aims to diagnose diseases in tissue sections using microscopy, established in 1893, remains the gold standard until nowadays (Tiford et al., 2006; den Baaker, 2017). In 1928, Papanicolau described a new technique of cell-based diagnosis called Cytopathology (CP) (Van den Tweel and Taylor, 2010).
Results, advantages and disadvantages of HP and CP have always been subject of comparison (Crino et al., 2021; Gerstner, Tarnok, 2002; de Ruiter et al., 1994). Recent literature reveals that the results of HP and CP in terms of accuracy became comparable, independent if CP is conducted manually (de Ruiter et al., 1994) or automatically (Gerstner et al., 2002; Gerstner et al., 2009).
The studies of Gerstner et al. used Laser Scanning Cytometry (LSC) aiming to define the DNAploidy as a marker of malignancy. LSC is automated and thus reproducible, but at least the equipment is cost-intensive. A manual count is low cost but tedious, time-consuming and its results are not reproducible. To this end the authors of the present study aimed to combine an automated analysis that is less expensive. The authors hypothesized that the morphological features yield information about the malignancy/benignancy of the respective sample.
The aim of the present study was to analyze light microscopic images of cytopathologic samples of thyroid cells using free software. The classification (diagnosis) was aimed to be conducted by artificial intelligence after a process of machine learning.
Samples of thyroid were chosen because the incidence of diagnosed thyroid cancers is increasing at least in Brazil and the USA. At least in those two countries, thyroid cancer is the fifth most frequent cancer in women. As stated in the recent scientific literature, an inexpensive but reliable methodology will always be an important issue to lower the costs for reliable medical diagnosis (Gerstner et al., 2002; Mittag et al., 2006; Gerstner et al., 2009; Buzin et al., 2015; Laffers et al., 2006; Melzer et al., 2016).
## II. MATERIALS AND METHODS
### a) Study Design
Manual diagnostic data from cytopathological aspirates were provided by Cassiano Antonio Moraes University Hospital. The automated analysis was conducted at the Image Cytometry Laboratory 10 (B) at the Biopractices Campus of Vila Velha University. The type of study was cross-sectional where the observation of data will occur within a time interval, without the need for direct interaction with the patients.
### b) Obtaining of Samples and Images
In the present study 52 samples submitted to fine needle aspiration stained by pap smear were collected with a diagnosis made by the pathologist Dr. Carlos Musso; selected from March/2021 to March/2022. The photos taken by the pathologist
### c) Image Preparation and Analysis
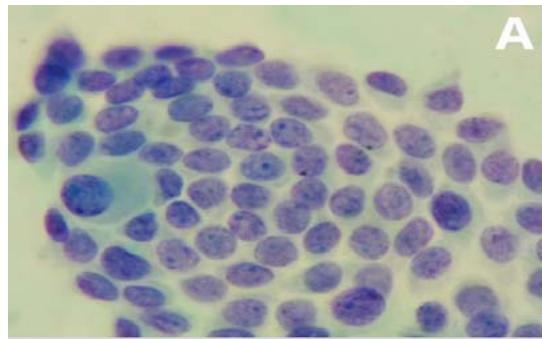
The images have been saved in.tif format. Samples of each patient were stored in individual folders without personal identification. The received images were analyzed and classified using free software. The software chosen for nuclei analysis was CellProfiler (CP) (version 4.2.4), after the pipeline (Figure 1) was created in this software, the images of each patient were loaded, there was a background inversion where the colors were inverted to grayscale scales for processing the pixels, presenting you light objects on a dark background, identification of all objects (nuclei) and finally filtered (Figure 2 and 3), in order to exclude non-cellular artifacts.
 Pipeline Used with Cellprofiler for All Samples Figure 1: Pipeline: First all the images were loaded, identified by the unique format known in all.tif, the intensities were inverted for the objects of interest asking for light on a dark background, later the primary object was identified as nuclei 1, after filtering the objects (eliminating objects unexpected) a new count of the parameters was performed and then data nuclei 2 was found, only these were exported to carry out the classification.
 Steps Using Cellprofiler - Malignant Sample
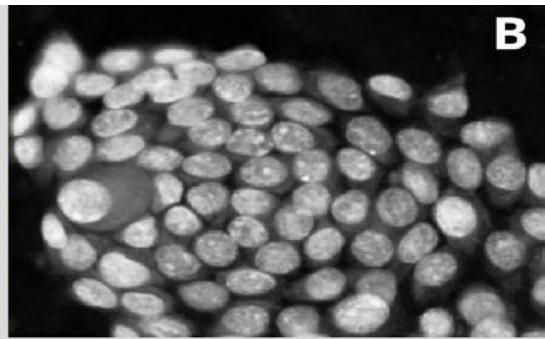
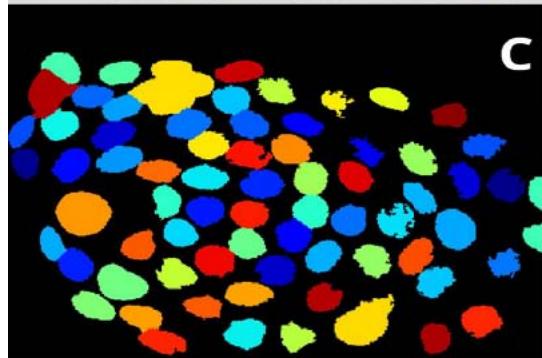
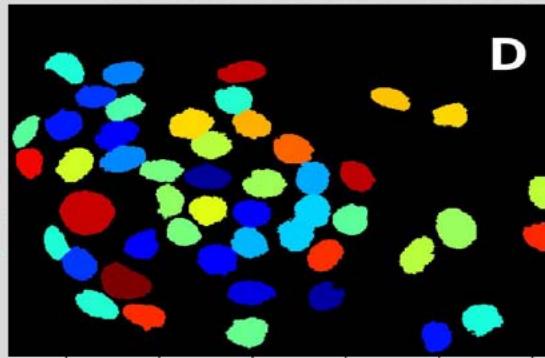 Figure 2: Analysis performed in Cellprofiler of a malignant sample. A: Original Image, B: Color inversion to grayscale, C: Nuclei identification D: Filter applied to exclude the artifacts.
Steps Using Cellprofiler - Benignant Sample
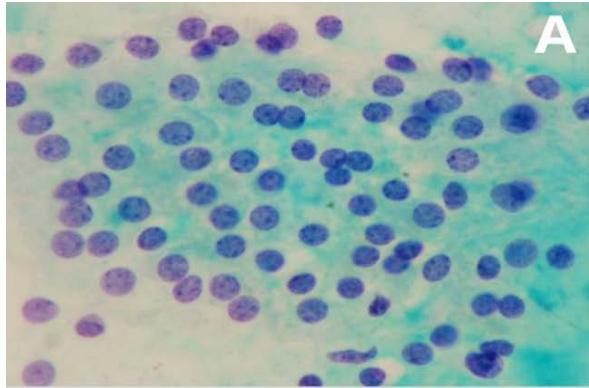
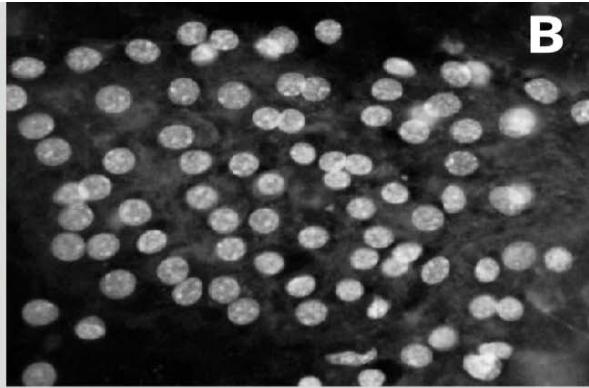
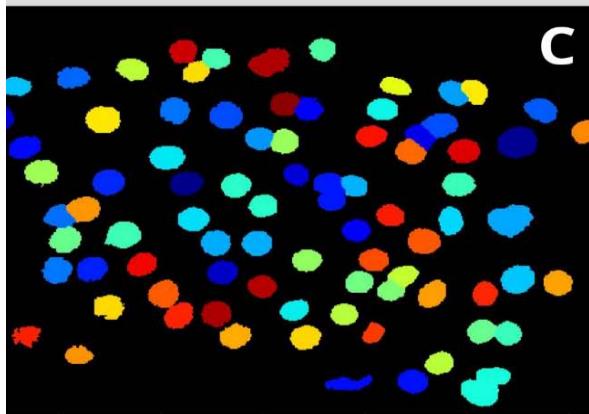
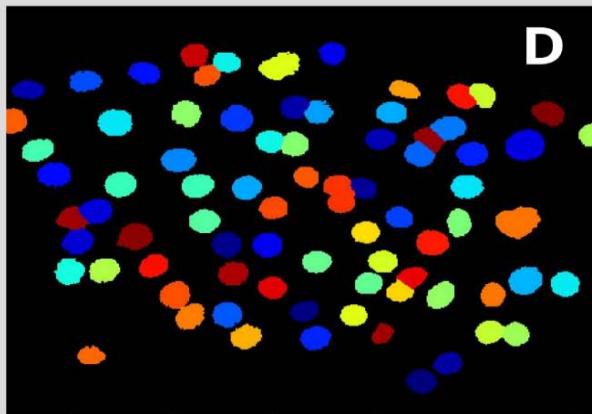 Figure 3: Analysis performed in Cellprofiler of a benignant sample. A: Original Image, B: Color inversion to grayscale, C: Nuclei identification D: Filter applied to exclude the artifacts.
The dates of the analyzed nuclei were exported to an excel file and later to another two software that performed the classification by supervised learning (Cellprofiler Analyst (CPA) and Tanagra (TG) software).
### d) Statistical Analysis
After the complete analysis of all samples a comparison of the results of the effectiveness of the automated method and the manual diagnosis was made with MedCalc software (https://www.medcalc.org/ download/). Also, calculations for specificity and sensitivity with CPA and TG software.
## III. RESULTS
The ROC curve (Figure 4) shows the progress of machine learning $(AUC = 0.96)$, and the capability to differentiate the positive and negative.
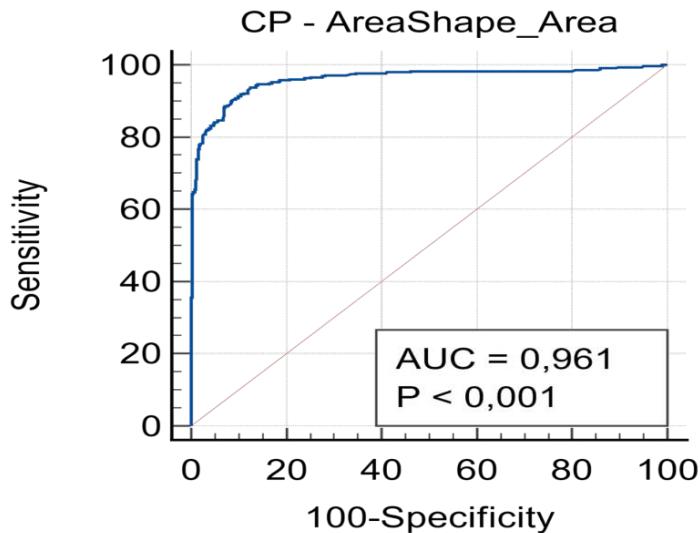 Figure 4: ROC curve between automated and manual results.
TG is a macro to be integrated in excel for classification purposes, amongst others. If, like in the present study there are multiparametric data, TG offers the possibility to choose the best parameters for a successful classification (data mining), that is, parameters that do not substantially enhance the results will be excluded in this step.
The scatterplot shown in figure 5 concluded that the software was able to correctly differentiate the classes.
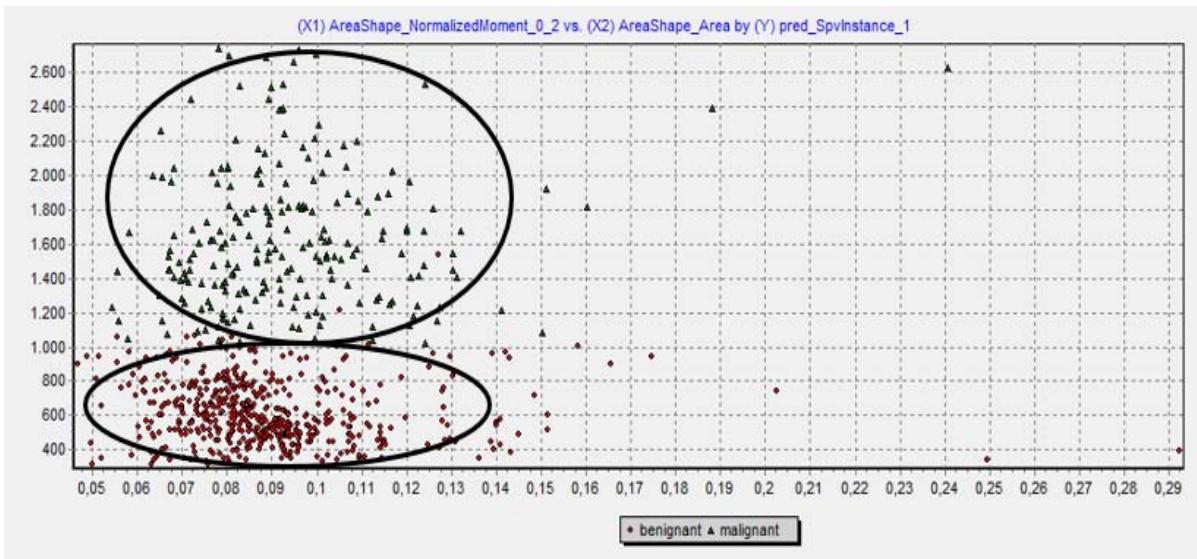 Scatterplot with Software Tanagra – Supervised Learning Figure 5: Classification obtained in the TANAGRA software (Scatter plot: red-benign/green-malignant).
The algorithm chosen by the authors was the Linear discriminant analysis (LDA). LDA is strongly related to analysis of variance (ANOVA) and regression analysis, which also attempt to express a dependent variable as a linear combination of other characteristics (Venkataraman et al., 2007). TG software presented data with high sensitivity (0.94) and specificity (0.91) (Figure 6).
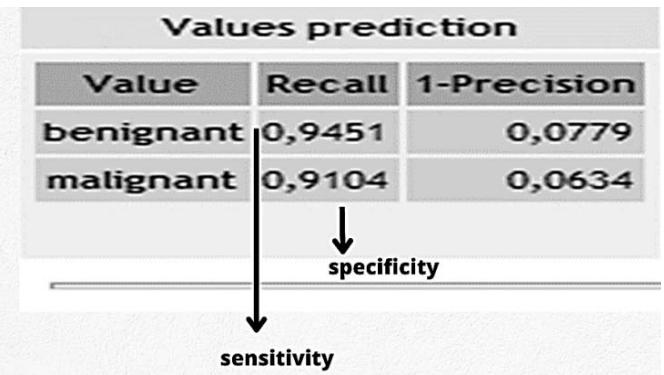 Figure 6: Linear discriminant analysis between benign and malignant objects.
The other software used to also classify the data was CPA, which also received the same data calculated by TG software. Figure 7 represents the training manual classification made. CPA also supervised machine learning and the algorithm used was logistic regression. In this software the results were comparable to the TG software and also showed high performance in learning $-97.08\%$ of accuracy.
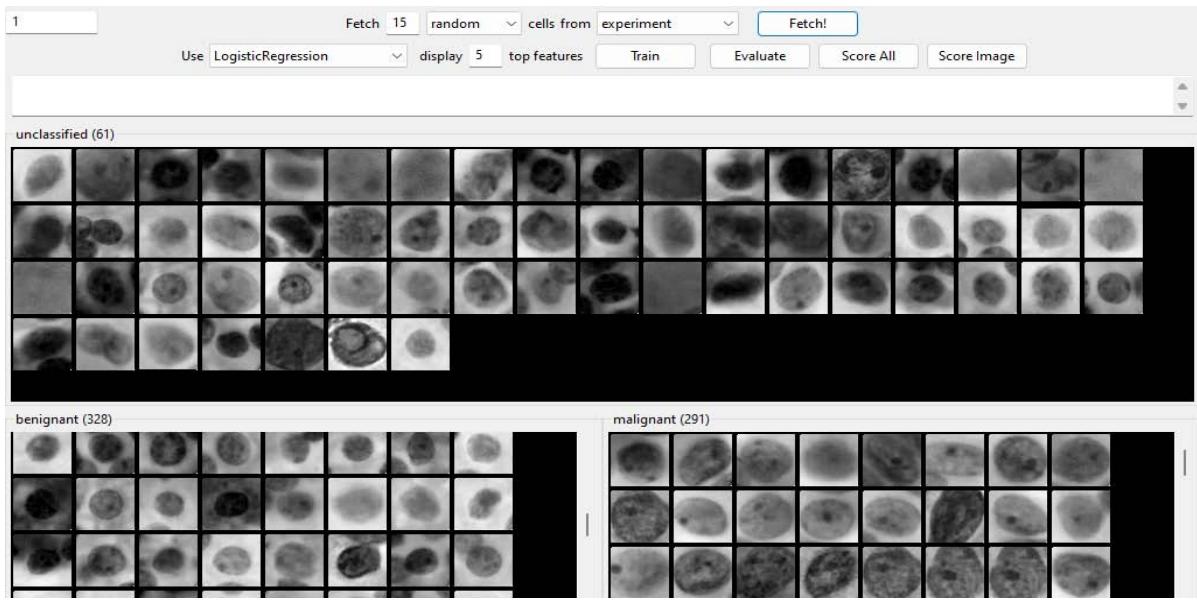 Cellprofiler Analyst Training Figure 7: Training with two classes, malignant (lower right) and benign (lower left) cells.
After training benign and malignant objects were requested to verify software performance to calculate sensitivity and specificity. (Figure 8 and 9).
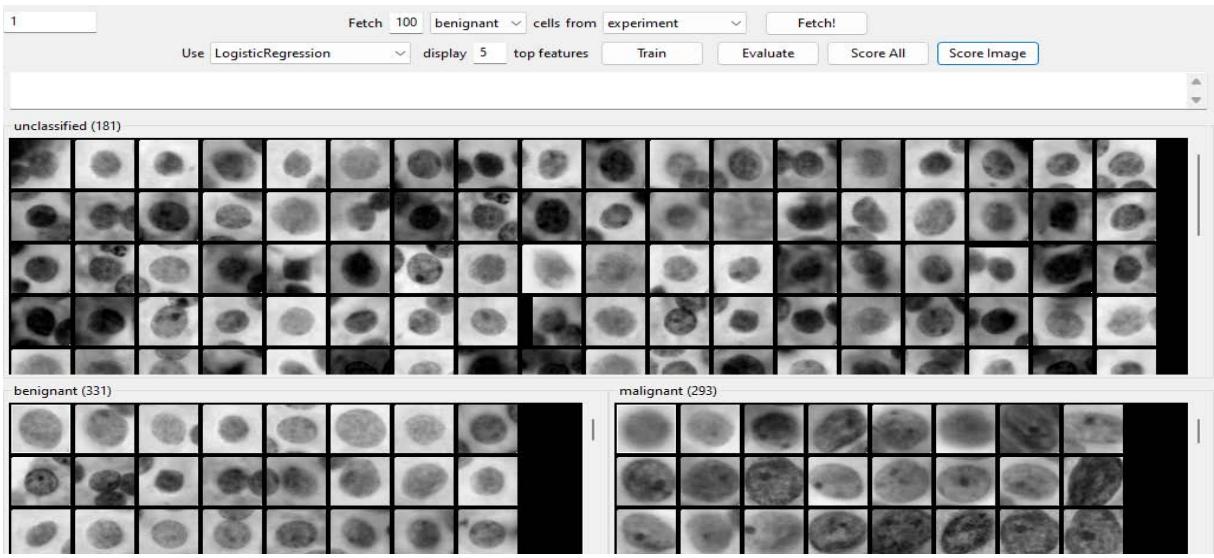 Cellprofiler Analyst Performance - Benignant Figure 8: 100 benign correct objects requested after training.
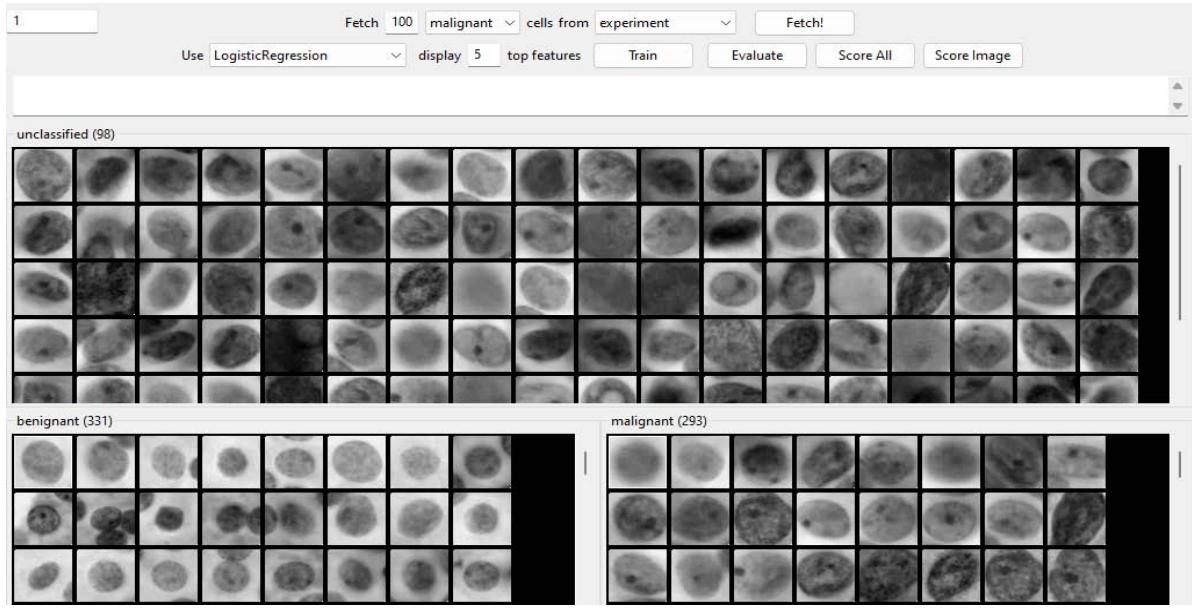 Cellprofiler Analyst Performance - Malignant Figure 9: 100 malignant correct objects requested after training.
To check the machine learning progress, a score image tool is displayed after training to show the correctness of the machine (Figure 10).
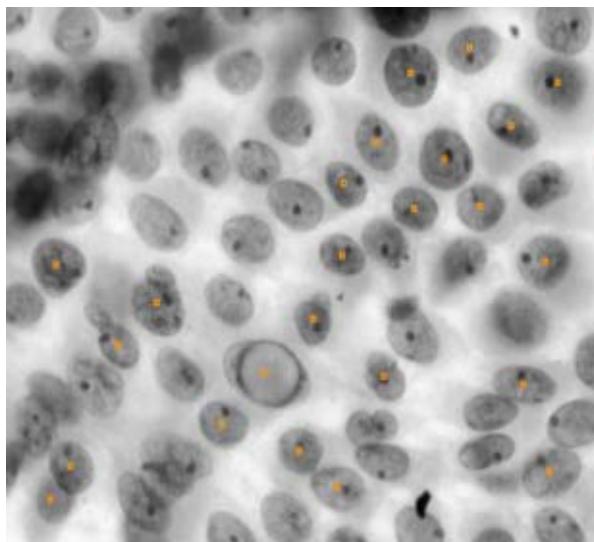 Score Image of Malignant and Bengnant Nucleus – Cellprofiler Analyst
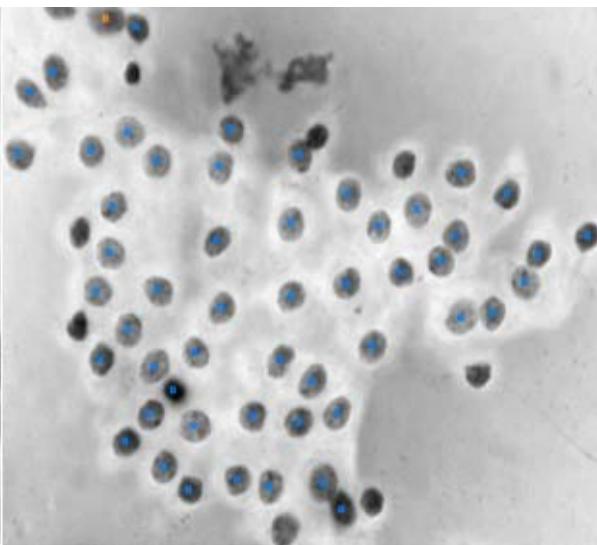 Figure 10: Score Image: This tool allows the analyst to see the full extent of the image and the objects there identified according to the classification performed under each class after training. A: Malignant objects identified B: Benignant objects identified. - $97.08\%$ of accuracy.
The results calculated by CPA and TG obtained accuracy above $90\%$. Both software were able to distinguish the difference between classes. Regardless of the number of samples, the algorithm is able to learn and perform the correct classification of objects, as shown in the results of the present study.
## IV. DISCUSSION
Fine-needle aspiration cytology is a routinely used, reliable, quick, highly reproducible, minimally invasive, and cost-effective method for diagnosing nodular lesions of the thyroid (Rosai, 1996). It has been suggested as a first step test in the diagnosis of thyroid nodules (Segev et al., 2003; Aguilar et al., 1997). The most important contribution of this method to the diagnostic process is its power to distinguish patients who need surgical intervention from those who do not (Koss, 1992). Manual diagnosis, however, is time-consuming and not reproducible.
Currently there are free software where it is possible to view all objects and classify them with the best parameters. After training all objects, the software can even independently predict a correct diagnosis in new objects. Other studies also had satisfying results with data found in automated analysis of cellular objects (Deka et al., 2017).
An interesting study combining machine learning and papillary thyroid carcinoma published in 2021 showed several machine learning models were built to predict disease recurrence and all models had a confirmed accuracy of $90\%$ or more (Park & Lee, 2021).
Automated quantitative analysis of cellular objects is currently considered the viable option in developed countries, because the scientific community proves that human-machine interaction has the potential to reduce human effort and increase confidence in algorithmic decision to solve clinical diagnoses (Jayatilake & Ganegoda, 2021; Sarker, 2021).
In the literature, there are few studies with images of the cell classification process (Wang et al., 2010; Wang et al., 2019), unlike this study, which the objective was to show step by step.
In terms of DNA ploidy there may be a low percentage of false positive artifacts. However, those may not have influenced the results of the present study as proven by the high accuracy of the results (Gerstner et al., 2006). The ROC curve was created only using the area of the nuclei, concluding the area of the nuclei is referring to the amount of DNA, which makes an analysis of the ploidy relatively easy, even when using light microscopy as in the present study.
The term digital pathology is considered as the future of histopathology. The authors agree that the integration of images and digital results is not yet standard, but it will significantly contribute to receiving digital pathology as part of the clinical evaluation (Athelogou & Huss, 2018; Ribeiro et al., 2019). Other studies concluded that after several highly accurate and scientifically proven studies, histopathology is ready for automation (Ribeiro et al., 2020, Lucas et al., 2021).
The main purpose of this study was to compare the diagnosis manual analysis (gold standard) and automated analysis. The results are comparable to the gold standard with high specificity and high sensitivity in two different classifiers.
Conflicts of Interest Nothing to declare.
### ACKNOWLEDGMENTS
The authors would like to thank the National Council for Scientific Technological Research (No. process: 88887.370523/2019-00) for their financial support. This study was financed by the Coordenação de Aperfeicoamento de Pessoal de Nível Superior - Brasil (CAPES). Thanks very much.
Generating HTML Viewer...
References
26 Cites in Article
M Tiford (2006). A Short History of Histopathology Technique.
M Den Bakker (2017). Histopathologisch onderzoek als gouden standaard? [Is histopathology still the gold standard?.
J Van Den Tweel,C Taylor (2010). Introduction to the History of Pathology series.
Stefano Crinò,Serena Ammendola,Anna Meneghetti,Laura Bernardoni,Maria Conti Bellocchi,Armando Gabbrielli,Luca Landoni,Salvatore Paiella,Federico Pin,Alice Parisi,Maria Mastrosimini,Antonio Amodio,Luca Frulloni,Antonio Facciorusso,Alberto Larghi,Erminia Manfrin (2021). Comparison between EUS-guided fine-needle aspiration cytology and EUS-guided fine-needle biopsy histology for the evaluation of pancreatic neuroendocrine tumors.
Andreas Gerstner,Attila Tàrnok (2002). Analysis of Fine‐Needle Aspirate Biopsies from Solid Tumors by Laser Scanning Cytometry (LSC).
A De Ruiter,P Carter,D Katz,G Kocjan,C Whatrup,J Northover,A Mindel (1994). A comparison between cytology and histology to detect anal intraepithelial neoplasia..
Andreas Gerstner,Wiebke Laffers,Attila Tárnok (2009). Clinical applications of slide‐based cytometry – an update.
Anja Mittag,Dominik Lenz,József Bocsi,Ulrich Sack,Andreas Gerstner,Attila Tárnok (2006). Sequential photobleaching of fluorochromes for polychromatic slide‐based cytometry.
Aline Buzin,Fernanda Pinto,Kathleen Nieschke,Anja Mittag,Tadeu De Andrade,Denise Endringer,Attila Tarnok,Dominik Lenz (2015). Replacement of specific markers for apoptosis and necrosis by nuclear morphology for affordable cytometry.
Wiebke Laffers,Anja Mittag,Dominik Lenz,Attila Tárnok,Andreas Gerstner (2006). Iterative restaining as a pivotal tool for n‐color immunophenotyping by slide‐based cytometry.
Susanne Melzer,Celio Nunes,Denise Endringer,Tadeu De Andrade,Attila Tarnok,Dominik Lenz (2016). Trypan blue as an affordable marker for automated live‐dead cell analysis in image cytometry.
J Rosai (1996). Ackerman's surgical pathology.
D Segev,D Clark,M Zeiger (2003). Beyond the suspicious thyroid fine needle aspirate: a review.
L Koss (1992). Diagnostic cytology and its histopathologic basis.
L Deka,S Gupta,R Gupta (2017). Nuclear morphometry and texture analysis on cytological smears of thyroid neoplasms: a study of 50 cases.
Young Park,Byung-Joo Lee (2021). Machine learning-based prediction model using clinico-pathologic factors for papillary thyroid carcinoma recurrence.
Senerath Jayatilake,Gamage Ganegoda (2021). Involvement of Machine Learning Tools in Healthcare Decision Making.
I Sarker (2021). Machine Learning: Algorithms, Real-World Applications and Research Directions.
Wei Wang,John Ozolek,Gustavo Rohde (2010). Detection and classification of thyroid follicular lesions based on nuclear structure from histopathology images.
Y Wang,Q Guan,I Lao (2019). Using deep convolutional neural networks for multi-classification of thyroid tumor by histopathology: a large-scale pilot study.
Andreas Gerstner,Alexander Thiele,Attila Tárnok,Andrea Tannapfel,Anette Weber,Friedrich Bootz (2006). Prediction of upper aerodigestive tract cancer by slide‐based cytometry.
M Athelogou,R Huss (2018). Tissue Phenomics: Profiling Cancer Patients for Treatment Decisions.
Gabrielly Ribeiro,Denise Endringer,Tadeu De Andrade,Dominik Lenz (2019). Comparison between two programs for image analysis, machine learning and subsequent classification.
Gabrielly Ribeiro,Rafaela Valotto,Jairo De Oliveira,Marco Guimarães,Dominik Lenz (2020). An inexpensive, automated and reproducible method to conduct quality control in nanoparticles.
A Lucas,P Ryder,B Li (2021). Open-source deeplearning software for bioimage segmentation.
No ethics committee approval was required for this article type.
Data Availability
Not applicable for this article.
How to Cite This Article
Gabrielly Pereira Ribeiro. 2026. \u201cAutomated Cytopathology of Fine Needle Aspiration for the Detection of Malignancy in Thyroid Cells\u201d. Global Journal of Medical Research - C: Microbiology & Pathology GJMR-C Volume 23 (GJMR Volume 23 Issue C2): .
Explore published articles in an immersive Augmented Reality environment. Our platform converts research papers into interactive 3D books, allowing readers to view and interact with content using AR and VR compatible devices.
Your published article is automatically converted into a realistic 3D book. Flip through pages and read research papers in a more engaging and interactive format.
Cytopathology of thyroid cells is an established method to detect malignancies in the thyroid. It is of advantage because an anesthesia and a diagnostic laparotomy is not necessary. There are however not yet many studies about automated cytopathology in thyroid cells. To this end, the aim of the present study was to establish an automated diagnosis of malignancy using image analysis and subsequent machine learning and Artificial intelligence. Light microscopy images of 52 patients were analyzed and the results were compared to those of pathology. The results of the automated analysis yielded a sensitivity of 0.94 and a specificity of 0.91 when compared to those of the pathologic diagnoses. The process of machine learning yielded an under curve area of 0.91 as calculated by a ROC-curve. The software used for image analysis, machine learning and classification (diagnosis) are open-source software, respectively.
Our website is actively being updated, and changes may occur frequently. Please clear your browser cache if needed. For feedback or error reporting, please email [email protected]
Thank you for connecting with us. We will respond to you shortly.