## I. INTRODUCTION
Cerebrospinal fluid (CSF) is a clear biological fluid in which the brain and spinal cord are immersed. It is contained in the meninges, more precisely in the subarachnoid space [1]. It circulates in the four cerebral ventricles inside the brain. It is synthesized mainly in the choroid plexus, but also, in the capillaries of the spinal and peri-brain subarachnoid space.
CSF comprises water, protein, glucose, and ions [2]. It usually is sterile and produced from plasma constituents by filtration and active secretion. CSF must provide the central nervous system (CNS) with a constant physicochemical environment to maintain its functions. Its composition is different from that of plasma, although it is close to it [1,3].
However, this composition can be modified in many circumstances associated with neurological disorders. Thus, in the course of pathologies of the meninges and the encephalon, whether infectious, inflammatory, tumoral or immunological, biochemical (glucose, albumin, protein, chlorine) and cytological modifications are observed, as well as the presence of microorganisms (bacteria, viruses, fungal agents, parasites). The analysis of cerebrospinal fluid, which is based on the evaluation of changes in the homeostasis of the environment, is therefore essential for a precise diagnosis of these pathologies.
Conditions affecting the central nervous system are very often life-threatening. This is why CSF examination is carried out in health facilities at different levels of the health pyramid in an emergency context for better patient management, and pathologies associated with changes in this fluid are recognized as the fifth cause of hospitalization and the third cause of infant mortality in Yaoundé, Cameroon [4,5].
CSF examination has several orientations, including the diagnosis of certainty of infectious meningitis, which may be bacterial, viral, parasitic, mycological, or immunological in nature. The quality of care and the patient's prognosis in terms of mortality and morbidity depend on the promptness with which a reliable result is returned to the clinician. To reduce the time taken to deliver results, specific tests have been developed to compensate for the expected time taken to deliver results (agglutination tests for Streptococcus, Haemophilus, and Neisseria).
The changing profile of germs and patients with meningitis and immunocompromised patients has led to significant epidemiological variations and thus requires new paradigms. Little data is available on the evolution of the cerebrospinal fluid of patients and the interactions between the different parameters.
As not all test parameters are available at the same time, we proposed to investigate the existence of links between data that can be obtained very quickly and pathogen culture data9 to be able to offer reliable diagnostic guidance at an early stage.
The objective of this work is to study the biochemical, cytological, and microbiological profile of cerebrospinal fluids analyzed at the Douala General Hospital. Specifically, the aim is to (a) describe the demographic characteristics of the patients in whom cerebrospinal fluid was analyzed, (b) analyse the cytological, microbiological, and biochemical characteristics of the cerebrospinal fluids, (c) determine the frequency of germs and (d) identify the sensitivity profile of the pathogens to antibiotics.
## II. MATERIALS AND METHODS
The study was retrospective, cross-sectional, and descriptive, was conducted at the Douala General Hospital (DGH) in the medical biology laboratory department.
It is a public hospital at the top of the health pyramid in Cameroon, whose missions include the provision of care, research, and teaching. It has 12 departments grouped into hospital and medical-technical.
The work was carried out at the laboratory service, the LBM of the Douala General Hospital, which has eight analysis units. Our study was conducted from 02 January; 2017 to 31 May; 2017 and focused on cerebrospinal fluid analyzed at the laboratory of the Douala General Hospital from $1^{\text{er}}$ January 2010 to 31 December, 2016, i.e. a period of 6 years. The study population consisted of the records of patients who received cerebrospinal fluid analysis at the DGH laboratory during our study period. We included in our study all CSF of patients registered and analyzed at the medical biology laboratory of the Douala General Hospital, during the period defined by our research. Very hemorrhagic samples, coagulated samples, and cerebrospinal fluids qualified as insufficient by the laboratory were excluded from our study.
The sampling technique we used was based on exhaustive consecutive recruitment of all cerebrospinal fluid results analyzed at the Douala General Hospital laboratory meeting the inclusion criteria. The recruitment was systematic, consecutive, and complete over our study period.
For data collection, we used (a) the register of the laboratory's reception unit from which we obtained information on age, sex and, department of origin; (b) the register of entries and results of the bacteriology unit; (c) the register of results of the current analysis of the biochemistry unit; (d) the data sheets for data collection.
The data collection was done thanks to a pre-established data collection form; it provides information on demographic, cytological, and biochemical data grouped as follows.
- The identification of the patient and the service of origin of the patient's CSF;
- The cytological appearance of the CSF;
- The results of the bacteriological examination;
- Biochemical test results.
- Results of the antibiogram.
The data collection was based on the reception registers where we extracted the patients' information on the date; patient's name; prescriber; collector; carrier; quotation; and invoice number.
Only the date of the day, Age, sex, origin of service, type of analysis, and identification number were retained for this item.
The registers of the bacteriology unit in which the following headings were found: date, names, department, order number, age, sex, examination requested, and results.
The data collected were CSF appearance, WBC count, and WBC count when the number of elements was more significant than five per $3\mathrm{mm}$, red blood cells, yeast, bacterial flora, culture, and isolated germs.
The element count was performed on a Malassez cell and observed under a light microscope with an objective of 40. This was a count of the elements (leukocytes, red blood cells, parasites) present in the CSF, and the result was expressed in parts per mm3.
- Cryptococcus testing in the CSF was performed by the India ink test
- The soluble Ag test was carried out by the immuno-electrophoresis technique using the SLIDEX meningitis-kit five from BIOMERIEUX
- The biochemistry records were subdivided by date, name, age, sex, parameter, results, and department.
The main variables to be surveyed were the following:
- Proteinorachy expressed in g /L;
- Glucorachy in g/L;
- chlorurorachy in mmol/
The following assays were used in this study:
- The determination of proteinopathy was carried out by the endpoint colorimetric method with pyrogallol
red combined with sodium molybdate on the semimanual VISUAL® spectrophotometer from BIOMERIEUX.
- The determination of chlorine was carried out by the potentiometric method described by Nernst, on Roche Cobas C311.
- The determination of glucose in CSF was performed by the hexokinase enzymatic method on Cobas C311 at a wavelength $\lambda$ of $340\mathrm{nm}$.
Thus, all the information collected in the three registers was transcribed on a data sheet which is individual for each patient and has an identification number.
## III. RESULTS
All data were recorded and anonymized for analysis using Microsoft Office EXCEL 2010.
The analysis was done using Statistical Package for Social Science (SPSS) version 20 and Stata 11, and their confidentiality was ensured by replacing names with codes.
The chi-square test (or Fisher's exact test) was used for qualitative variables (mean, proportion), and the student's t-test or the Wilcoxon or Mann-Whitney U-test for quantitative variables (mean)
We have retained the value of P below $5\%$ as statistically significant.
During our study, we identified 2121 CSFs of patients who were analyzed at the medical biology laboratory of the GDH. We included 2097
(Figure 1)
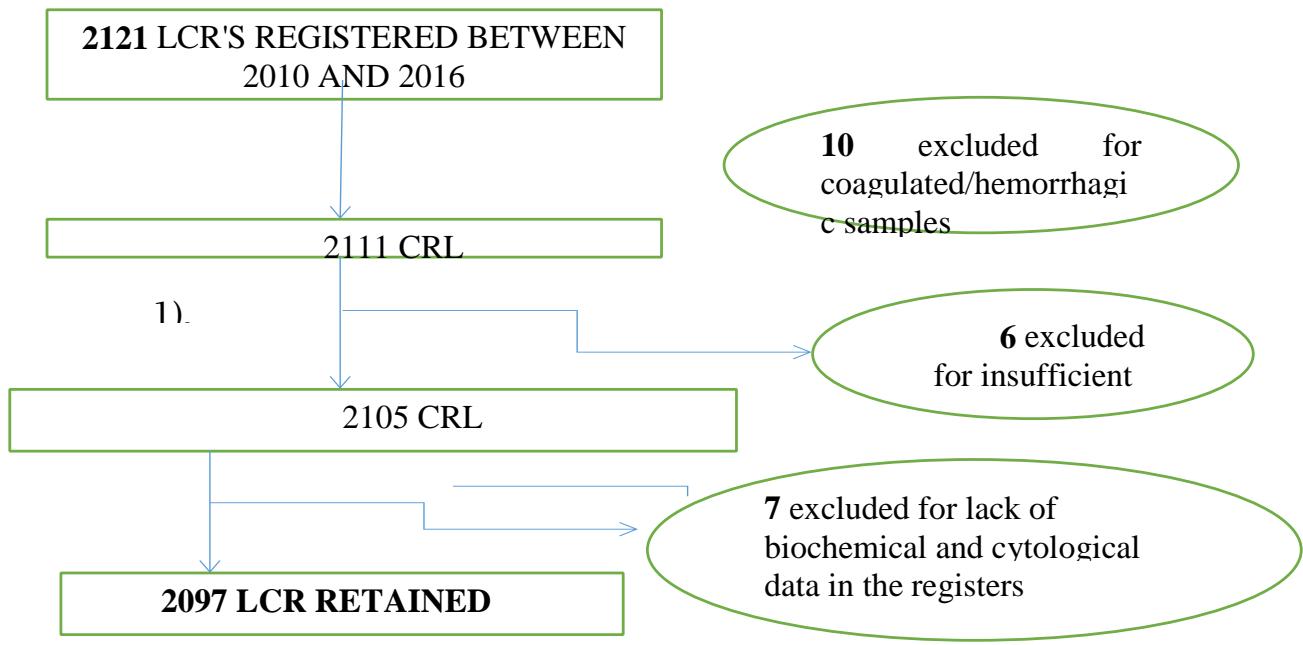 Figure 1: CSF patient recruitment scheme
### 1. Description of demographic characteristics
CSF distribution of patients by gender
Regarding the distribution of the CSF of the patients according to sex, figure 2 shows that $17.59\%$ of the population did not have information on sex. We note that $43.14\%$ of the population is male, with a sex ratio of 1.1 in favor of males.
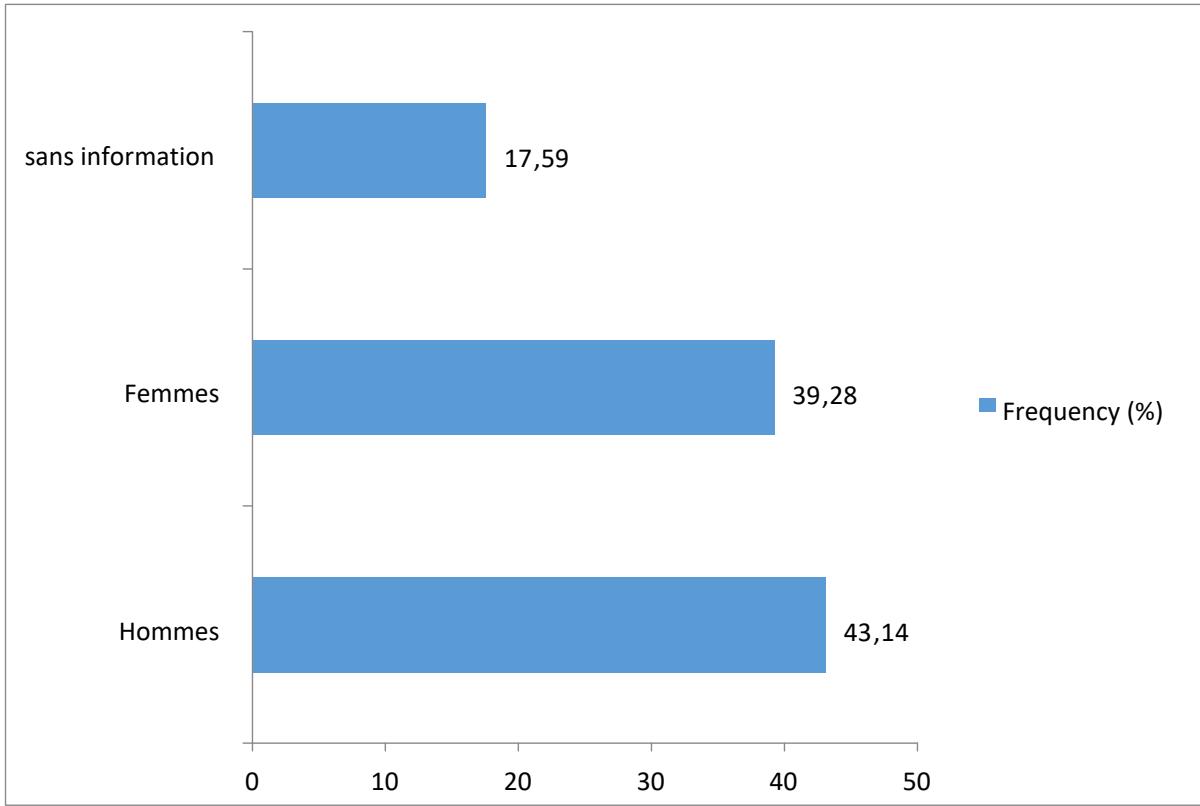 Figure 2: Distribution of CSF according to gender
CSF distribution of patients according to Age
Figure 3 shows that $26.7\%$ of the study population did not have any information on the patient's age, and the subjects in the age group above 15 years were the most represented at $29.7\%$.
However, most of the study population had a pediatric age of $43.59\%$.
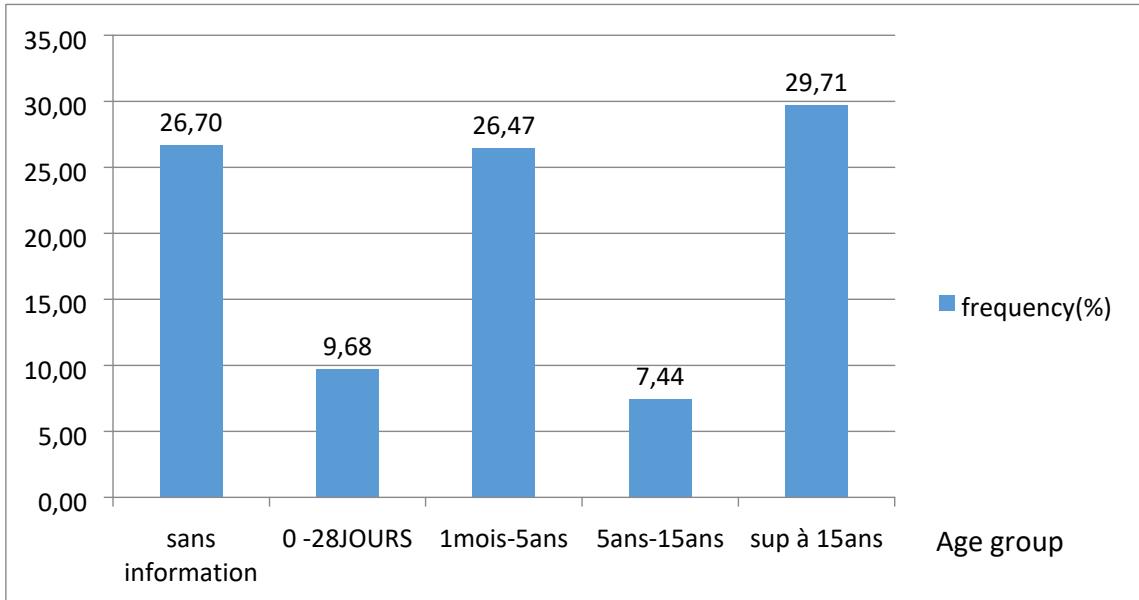 Figure 3: CSF distribution of patients according to Age
Number of CRLs per year
Figure 4 shows that the frequency of CRLs analyzed at the HGD varies according to the year. The lowest analysis rate was observed in 2010. We keep a peak in 2014 (18%) of the population and a regression in 2012 (12.5%) and2016.
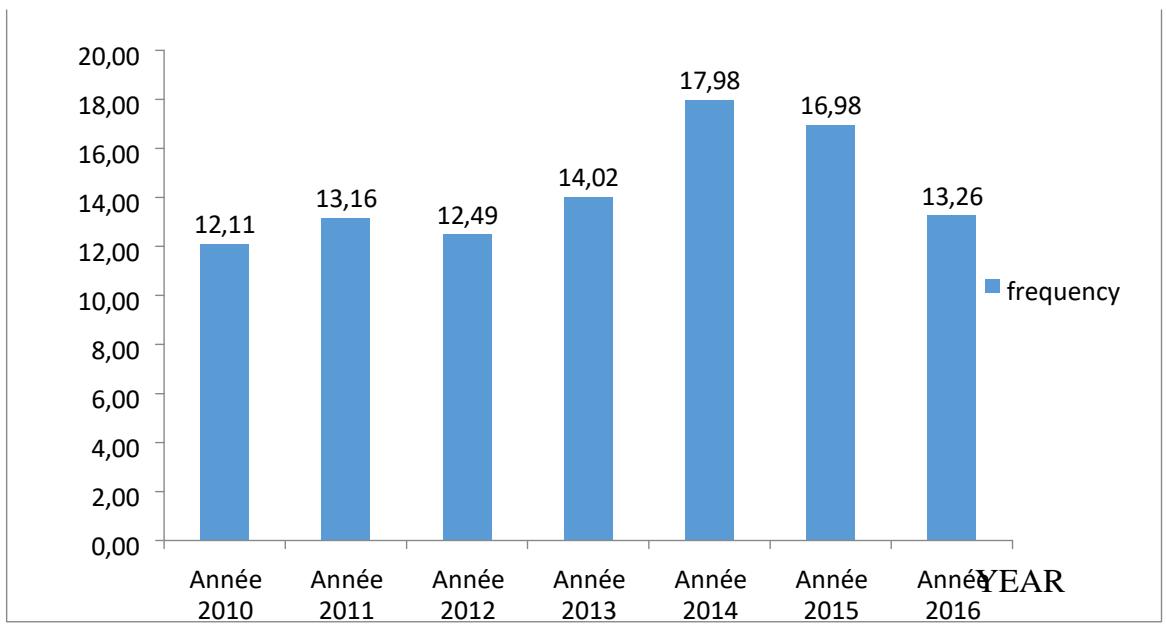 Figure 4: Distribution of CRLs by year
#### 2. Origin of CSF
Figure 5 shows that $87.6\%$ of the samples received in the laboratory came from patients in the DGH, and $10.44\%$ had no information about the source of the CSF.
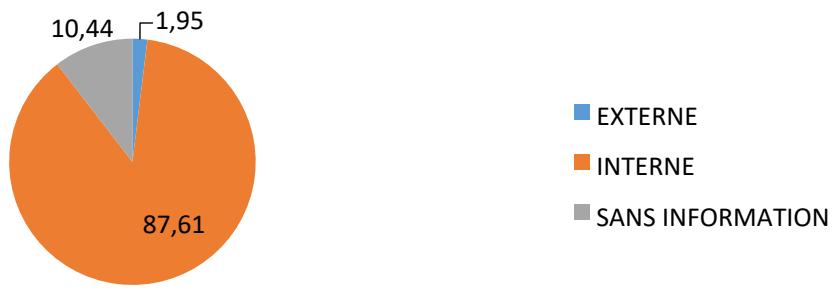 Figure 5: Distribution of CSF by patient type
Distribution of CRLs according to the services of origin
The distribution of patients' CSF according to the different departments shows that the highest rate, $43.8\%$, is represented by patients from the pediatric department, indicating that the most affected subjects are children. In second place comes the internal medicine department, with a rate of $26.36\%$, followed by the neonatology department, with a rate of $9.06\%$ (Figure 6).
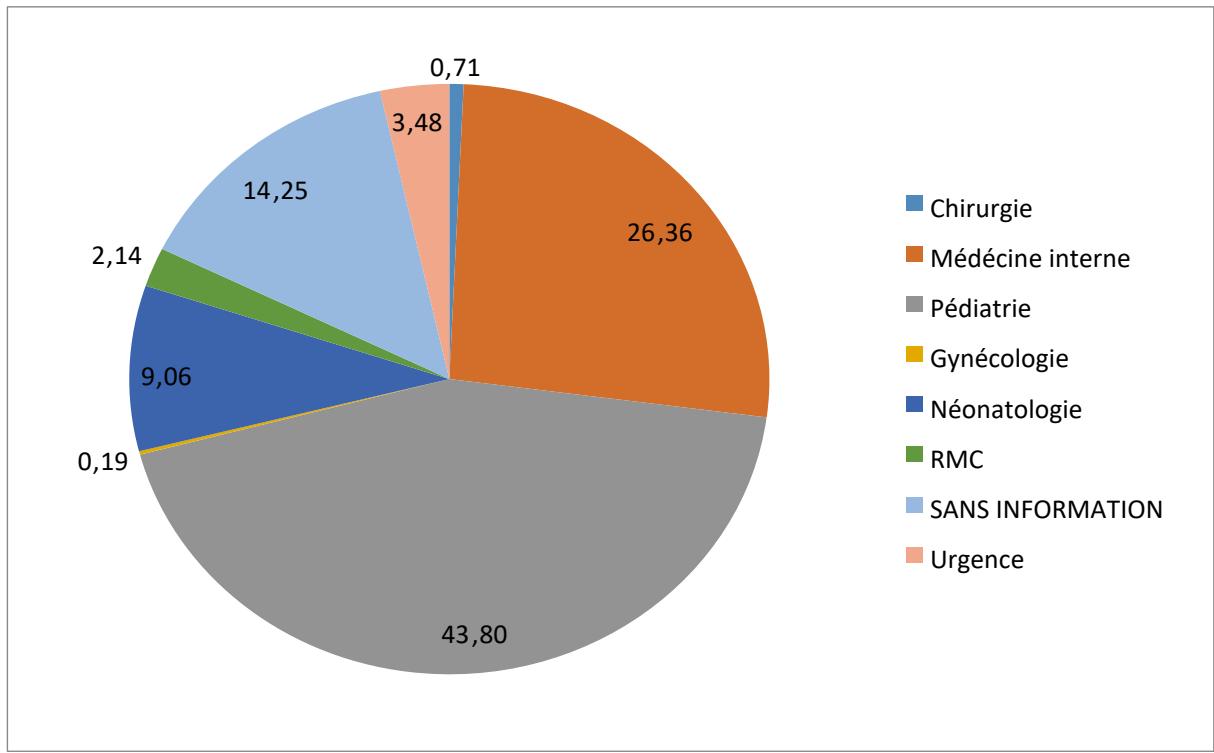 Figure 6: Distribution of CSFs by originating service
#### 3. Biological characteristics of CSF
CSF appearance
The CSF analyzed was $65\%$ clear, followed by hemorrhagic $15\%$, cloudy $8\%$, and xanthochromic $7\%$.
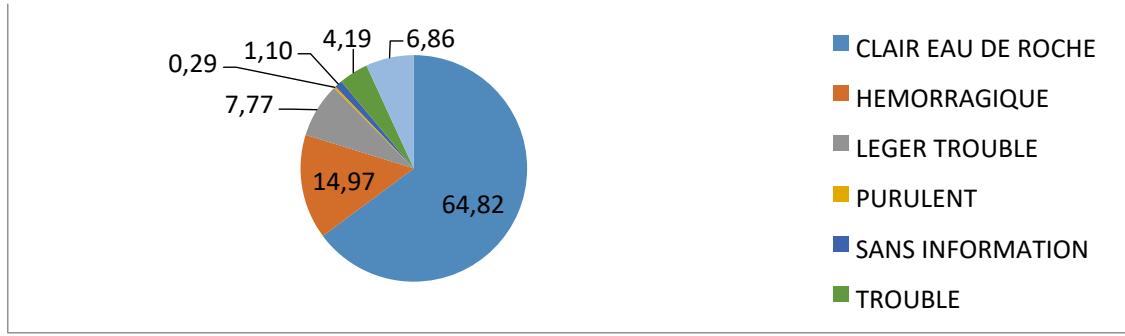 Figure 7: Distribution of CSF appearance
#### 4. Biochemical characteristics
Distribution of CSF according to glycorrhaphy
Table 1 shows that $20.78\%$ had hypoglycorrhagia, while $79.2\%$ had normal glycorrhagia.
The mean value was 0.63. The minimum value was 0.14, and the maximum value was 0.65.
Table 1: Distribution of glycorrhaphy in patients
<table><tr><td>Glycorrhaphy</td><td>Workforce</td><td>Frequency (%)</td><td>Average</td><td>Standard deviation</td></tr><tr><td>< 0.45 G/L*.</td><td>435</td><td>20,78</td><td>0,21</td><td>0,14</td></tr><tr><td>0.45 - 0.50 G/L**.</td><td>1297</td><td>61,82</td><td>0,6</td><td>0,18</td></tr><tr><td>> 0.50 G/L</td><td>365</td><td>17,40</td><td>1,23</td><td>0,65</td></tr><tr><td>Total</td><td>2097</td><td>100,00</td><td></td><td></td></tr></table>
Distribution of CSF according to proteinopathy
According to Table 2, we observed hyperproteinopathy in $43.8\%$ of the cases, i.e., 0.76 of the overall average proteinorachy. The minimum value was 0.067 and, the maximum was 3.43.
Table 2: Distribution of CSF analyzed according to proteinopathy
<table><tr><td>Proteinopathy</td><td>Workforce</td><td>Frequency (%)</td><td>Average value</td><td>Standard deviation</td></tr><tr><td>< 0.20 G/L*.</td><td>510</td><td>24,36</td><td>0,11</td><td>0,067</td></tr><tr><td></td><td>668</td><td>31,84</td><td>0,33</td><td></td></tr><tr><td></td><td>919</td><td>43,80</td><td>1,45</td><td></td></tr><tr><td>Total</td><td>2097</td><td>100,00</td><td></td><td></td></tr><tr><td>0.20 - 0.45 G/L**.</td><td></td><td></td><td></td><td>0,086</td></tr><tr><td>> 0.45 G/L***</td><td></td><td></td><td></td><td>3,43</td></tr></table>
Distribution of CSF according to chlorurorachy
Regarding the distribution of CSF according to chlorurorachy, $31.50\%$ of the study population showed a decrease in chlorurorachy, as shown in Table 3.
Table 3: Distribution of CSF according to chlorurorachy
<table><tr><td>Chlorurorachia</td><td>staff</td><td>frequency</td></tr><tr><td>No response</td><td>2</td><td>0,10%</td></tr><tr><td>< 120 mmol/L*.</td><td>1098</td><td>31,50%</td></tr><tr><td>120-130 mmol/L</td><td>982</td><td>46,80%</td></tr><tr><td>> 130 mmol/L</td><td>15</td><td>0,70%</td></tr><tr><td>TOTAL</td><td>2097</td><td>100%</td></tr></table>
#### 5. Characteristics cytological.
Distribution of the CSF population according to the leukocyte profile
We note from Table 4 that $22.16\%$ of CSF analyzed had more than five elements.
Table 4: Distribution of CSF according to leukocyte profile
<table><tr><td>Leukocyte value</td><td>Number of employees(n)</td><td>Frequency (%)</td><td>average value</td><td>Type deviation</td></tr><tr><td>< 5 elements /mm3</td><td>1632</td><td>77,84</td><td>0,65</td><td>1,764</td></tr><tr><td>> 5 elements /mm3</td><td>553</td><td>22,16</td><td>441,63</td><td>1,28</td></tr><tr><td>Total</td><td>2097</td><td>100,00</td><td></td><td></td></tr></table>
#### 5.1 Distribution of the CSF population according to the presence of red blood cells
We observed red blood cells in $18.83\%$ of the liquids collected and sent to the laboratory; $81.17\%$ did not contain red blood cells (figure 8).
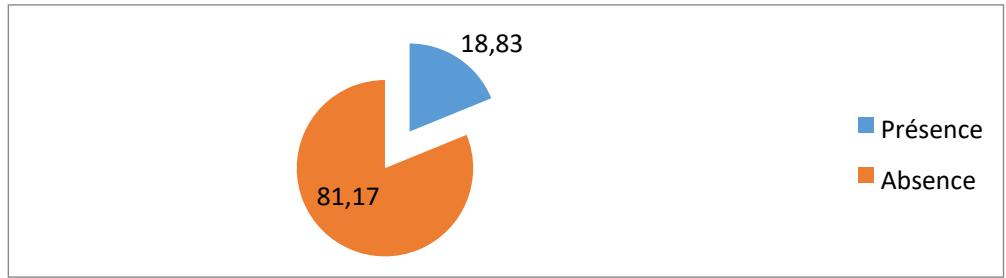 Figure 8: Distribution according to the presence of red blood cells
#### 6. Characteristic microbiological
Table 5 shows that from 2010 to 2016, 96 germs were isolated from the CSF received, i.e., a proportion of $31.6\%$ of positive cultures.
We note a significantly higher frequency in 2015 (6.16%), i.e., 22 germs were isolated, followed by 2013 (6.12%) and 2010 (5.12%); 2012 was the year in which fewer germs were isolated (2.67%).
Table 5: Distribution of positive CSF cultures by year
<table><tr><td>Number of CRLs/year</td><td>Number of employees(n)</td><td>Number of CRLs/year</td><td>% CSF positive</td></tr><tr><td>Year 2010</td><td>13</td><td>254</td><td>5,12</td></tr><tr><td>Year 2011</td><td>8</td><td>275</td><td>2,9</td></tr><tr><td>Year 2012</td><td>7</td><td>262</td><td>2,67</td></tr><tr><td>Year 2013</td><td>18</td><td>294</td><td>6,12</td></tr><tr><td>Year 2014</td><td>15</td><td>377</td><td>3,97</td></tr><tr><td>Year 2015</td><td>22</td><td>357</td><td>6,16</td></tr><tr><td>Year 2016</td><td>13</td><td>278</td><td>4,67</td></tr><tr><td>TOTAL</td><td>96</td><td>2097</td><td>4,57</td></tr></table>
#### Distribution of isolated species
According to Table 6, the types of germs isolated were fungal and bacterial, and no viral germs were isolated.
The fungal flora was dominated by the cryptococcus neoformans germ, i.e., $63.54\%$.
The bacterial flora represented $35.42\%$ dominated by gram-positive cocci, including Streptococcus pneumonia (17.71%) and 13.04%, gram-negative bacteria.
Table 6: Strains isolated from CSF
<table><tr><td>Type of germs isolated</td><td>Number of employees(n)</td><td>Frequency (%)</td></tr><tr><td>Candida albicans</td><td>1</td><td>1,04</td></tr><tr><td>Cryptococcus neoformans</td><td>61</td><td>63,54</td></tr><tr><td>Enterobacter</td><td>2</td><td>2,08</td></tr><tr><td>Escherichia coli</td><td>2</td><td>2,08</td></tr><tr><td>Haemophilus influenzae</td><td>1</td><td>1,04</td></tr><tr><td>Klebsielp</td><td>2</td><td>2,08</td></tr><tr><td>Listeria monocytogenes</td><td>1</td><td>1,04</td></tr><tr><td>Neisseria meningitidis A</td><td>1</td><td>1,04</td></tr><tr><td>Neisseria meningitidis B</td><td>3</td><td>3,13</td></tr><tr><td>Pseudomonas sp</td><td>2</td><td>2,08</td></tr><tr><td>Staphylococcus aureus</td><td>2</td><td>2,08</td></tr><tr><td>Streptococcus agalactiae</td><td>1</td><td>1,04</td></tr><tr><td>Streptococcus pneumoniae</td><td>17</td><td>17,71</td></tr><tr><td>Total</td><td>96</td><td>100,00</td></tr></table>
The search for soluble antigens in the CSF was positive in 14 cases (0.67%), and the majority of tests (99.14%) were negative (Table 7).
Table 7: Distribution of CSF analyzed by soluble antigen result
<table><tr><td></td><td>Number of employees(n)</td><td>Frequency (%)</td></tr><tr><td>Negative</td><td>2080</td><td>99,14</td></tr><tr><td>Positive</td><td>14</td><td>0,67</td></tr><tr><td>No information</td><td>3</td><td>0,19</td></tr><tr><td>Grand total</td><td>2097</td><td>100,00</td></tr></table>
Distribution according to soluble antigens
Table 8 shows that of the soluble antigens identified, 10 (0.48%) were associated with Streptococcus pneumonia, followed by Neisseria meningitides (0.15%).
Table 8: Germs identified after soluble antigen test
<table><tr><td>Germs identified after soluble antigen test</td><td>Number of employees(n)</td><td>Frequency (%)</td></tr><tr><td>Haemophilus influenzae</td><td>1</td><td>0,05</td></tr><tr><td>Neisseria meningitidis A</td><td>1</td><td>0,05</td></tr><tr><td>Neisseria meningitidis B</td><td>2</td><td>0,10</td></tr><tr><td>Streptococcus pneumoniae</td><td>10</td><td>0,48</td></tr><tr><td>Sterile CSF</td><td>2078</td><td>99,5</td></tr><tr><td>No information</td><td>6</td><td>0,29</td></tr><tr><td>Total</td><td>2097</td><td>100,00</td></tr></table>
Distribution according to flora type Of the fungal agents encountered, a total of 62 were identified, with a predominance for Cryptococcus neocons, followed by Candida Albicans (Table 9).
Table 9: Distribution of CSF analyzed according to the yeast isolated
<table><tr><td>Distribution according to the yeast isolated</td><td>Number of employees(n)</td><td>Frequency (%)</td></tr><tr><td>Candida Albans</td><td>1</td><td>0,05</td></tr><tr><td>Cryptococcus neoformans</td><td>61</td><td>2,91</td></tr><tr><td>Not observed</td><td>2032</td><td>96,85</td></tr><tr><td>No information</td><td>3</td><td>0,19</td></tr><tr><td>Grand total</td><td>2097</td><td>100,00</td></tr></table>
Table 10: Distribution of CSF analyzed according to bacterial flora
<table><tr><td>Distribution according to bacterial flora</td><td>Number of employees(n)</td><td>Frequency (%)</td></tr><tr><td>BG -*</td><td>10</td><td>0,38</td></tr><tr><td>CBG -**</td><td>2</td><td>0,14</td></tr><tr><td>CG -***</td><td>4</td><td>0,28</td></tr><tr><td>CG +****</td><td>20</td><td>0,86</td></tr><tr><td>Nobs*****</td><td>2058</td><td>98,38</td></tr><tr><td>No information</td><td>3</td><td>0,19</td></tr><tr><td>Grand total</td><td>2097</td><td>100,00</td></tr></table>
Distribution of germs isolated by age group
Concerning the distribution of isolated germs by age group of the population, we note, according to Table 11, that the age group above 15 years is the most dominant, with $10.93\%$ of positive CSF, followed by the pediatric population. The 5 to 15-year-old people had $3.6\%$ positive CSF. The 0 to 5-year-old people had a positivity rate of $2\%$.
Table 11: Distribution of germs isolated by age group
<table><tr><td>Age groups</td><td>Number of employees(n)</td><td>Isolated germs</td><td>Frequency (%)</td></tr><tr><td>0-28 days</td><td>291</td><td>5</td><td>2,06</td></tr><tr><td>1 month - 5 years</td><td>556</td><td>11</td><td>1,98</td></tr><tr><td>5-15 years old</td><td>195</td><td>7</td><td>3,62</td></tr><tr><td>over 15 years</td><td>622</td><td>69</td><td>10,93</td></tr><tr><td>No information</td><td>560</td><td>4</td><td>0,5</td></tr><tr><td>Total</td><td>2097</td><td>96</td><td>4,58</td></tr></table>
Regarding the distribution according to age and species, Table 12 shows that the 0 to 28-year-old population shows a wide dispersion of the isolated germs. In the population from 1 month to 5 years and up to 15 years, a predominance of streptococcus pneumonia observed.
Table 12: Age and species distribution
<table><tr><td>Type of germs isolated</td><td>0-28 days</td><td>1 month-5 years</td><td>5-15 years</td><td>Sup 15years</td><td>Without information</td></tr><tr><td>Candida albicans</td><td>0</td><td>0</td><td>0</td><td>1</td><td>0</td></tr><tr><td>Cryptococcus neoformans</td><td>0</td><td>0</td><td>0</td><td>61</td><td>0</td></tr><tr><td>Enterobacter</td><td>1</td><td>1</td><td>0</td><td>0</td><td>0</td></tr><tr><td>Escherichia coli</td><td>1</td><td>0</td><td>0</td><td>1</td><td>0</td></tr><tr><td>Haemophilus influenzae</td><td>0</td><td>1</td><td>0</td><td>0</td><td>0</td></tr><tr><td>Klebsielp</td><td>0</td><td>1</td><td>1</td><td>0</td><td>0</td></tr><tr><td>Listeria monocytogenes</td><td>0</td><td>0</td><td>0</td><td>1</td><td>0</td></tr><tr><td>Neisseria meningitidis A</td><td>1</td><td>0</td><td>0</td><td>0</td><td>0</td></tr></table>
Table 13 shows that the germs separated were more frequent in female subjects.
<table><tr><td>Neisseria meningitidis B</td><td>1</td><td>1</td><td>1</td><td>0</td><td>0</td></tr><tr><td>Pseudomonas sp</td><td>0</td><td>0</td><td>0</td><td>2</td><td>0</td></tr><tr><td>Staphylococcus aureus</td><td>0</td><td>1</td><td>1</td><td>0</td><td>0</td></tr><tr><td>Streptococcus agalactiae</td><td>1</td><td>0</td><td>0</td><td>0</td><td>0</td></tr><tr><td>Streptococcus pneumoniae</td><td>0</td><td>6</td><td>4</td><td>4</td><td>3</td></tr><tr><td>Total</td><td>5</td><td>11</td><td>7</td><td>69</td><td>4</td></tr></table>
Table 13: Distribution of germs separated by gender
<table><tr><td>Overall distribution of infected CSF by gender</td><td>Number</td><td>Number of employees(n)</td><td>Frequency (%)</td></tr><tr><td>Male</td><td>904</td><td>41</td><td>4,53</td></tr><tr><td>Women</td><td>824</td><td>44</td><td>5,34</td></tr><tr><td>without information</td><td>369</td><td>11</td><td>2,98</td></tr><tr><td>Total</td><td>2097</td><td>96</td><td></td></tr></table>
a. Susceptibility profile of isolated BGN to anti-infective agents According to figures 8 and 9, we observe a predominant sensitivity to the carbapenem family of molecules concerning gram-negative bacilli (BGN), with in particular $17.31\%$ for imipenem, and $9.62\%$ for meropenem Followed by the fluoroquinolone family with respect to the sensitivity of the germs isolated to anti-infectives.
On the other hand, figure 9 shows that the resistance rate to BGN molecules of the beta-lactam family is increasing, with a rate of $12.5\%$ for ticarcillin, followed by sulphonamides. $6,62\%$
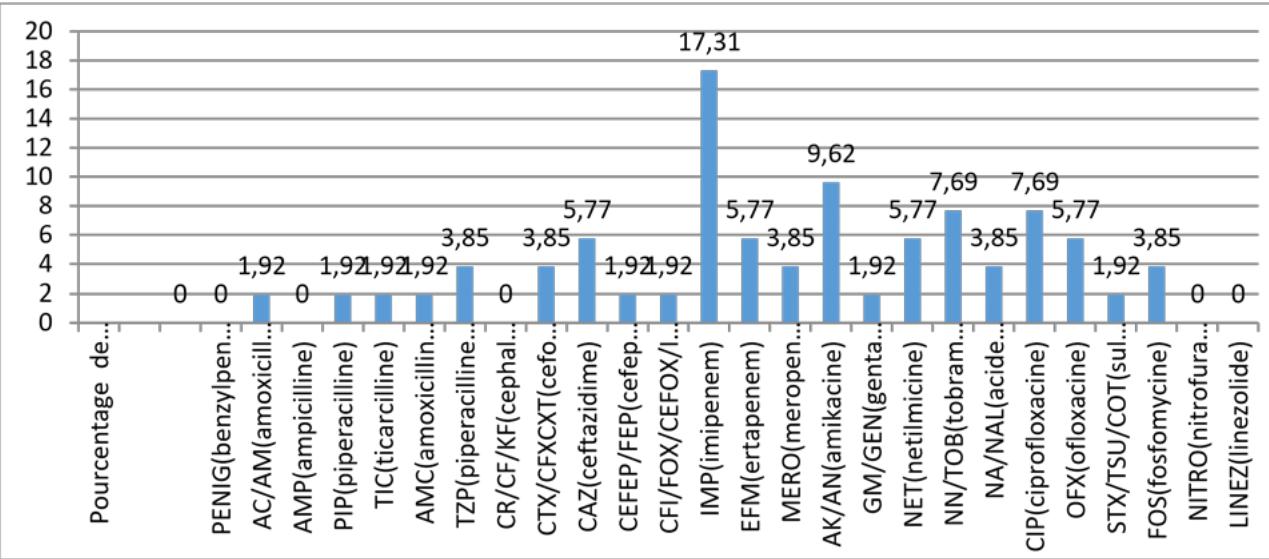 Figure 8: Susceptibility profile of BGN to anti-infective agents
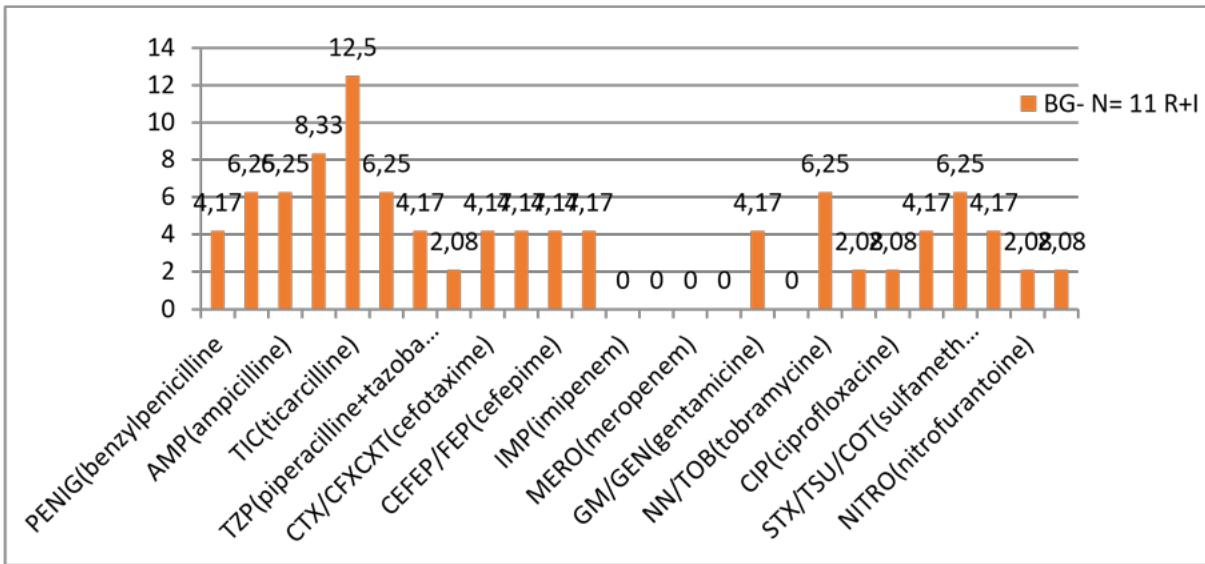 Figure 9: Resistance profile of BGN to anti-infective agents
BGN: gram-negative bacillus; N: number; R+I: resistant/intermediate
Figure 10 shows that penicillins for peniG and first-generation cephalosporins show marked resistance to the molecules tested. However, the glycopeptides show a better sensitivity of $25\%$ for teicoplanin, followed by C3G.
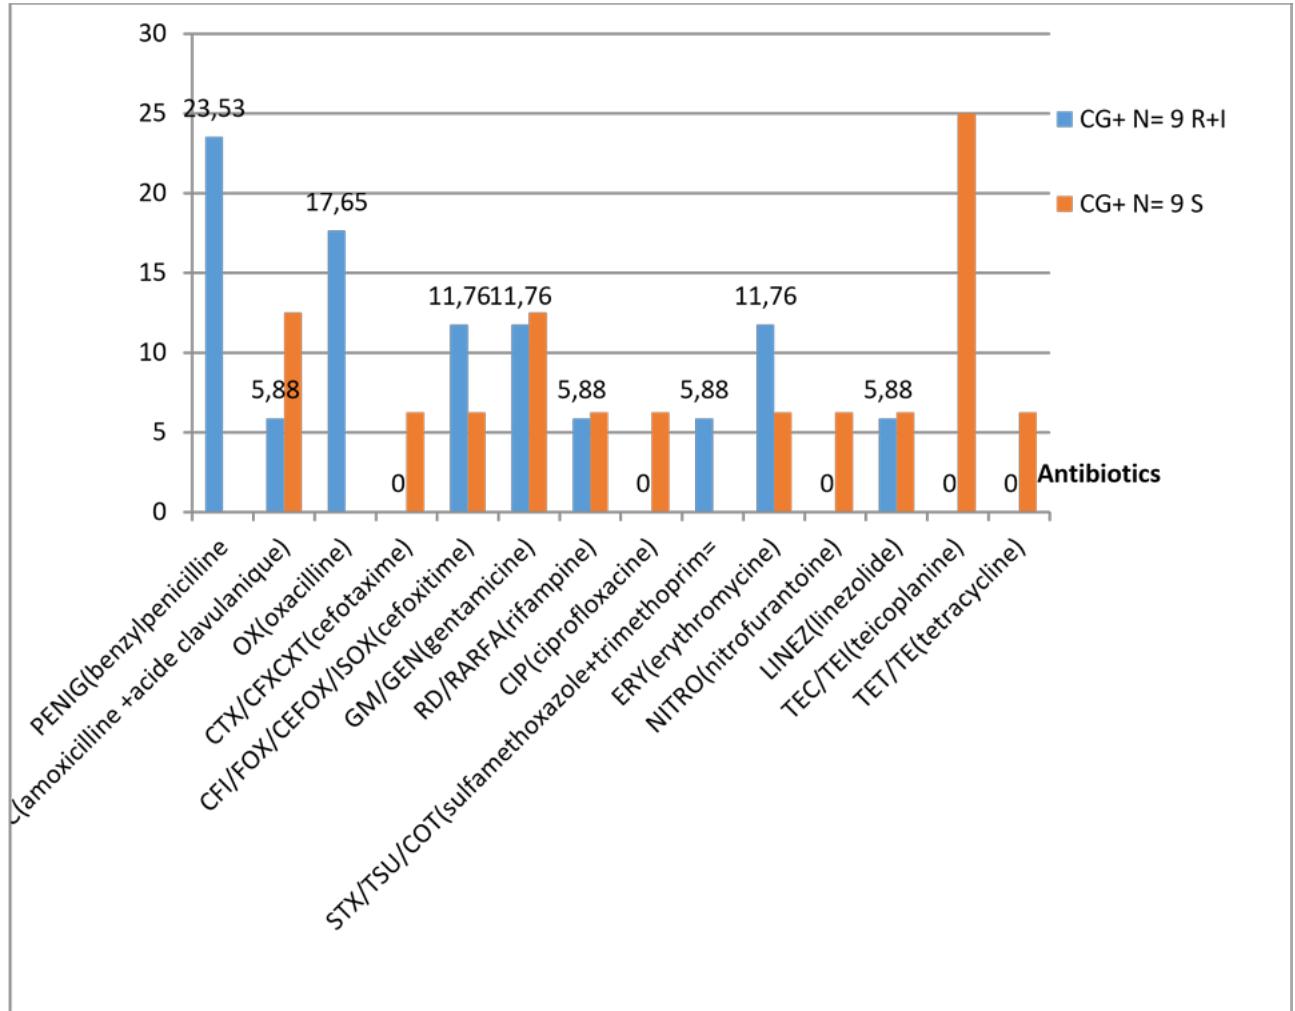 Figure 10: Antibiotic susceptibility and resistance profile for GC+.
CG+: gram-positive cocci; S: sensitive
#### 7. Associations
a. Cellular profile according to germs
Enterobacteriaceae infections showed the highest average leukocyte count (5054-7125), followed by streptococci (1906-3100); Neisseria showed a low cell count, according to Figure 11.
The germ cell profile shows a statistically significant relationship with $p = 0.0001$
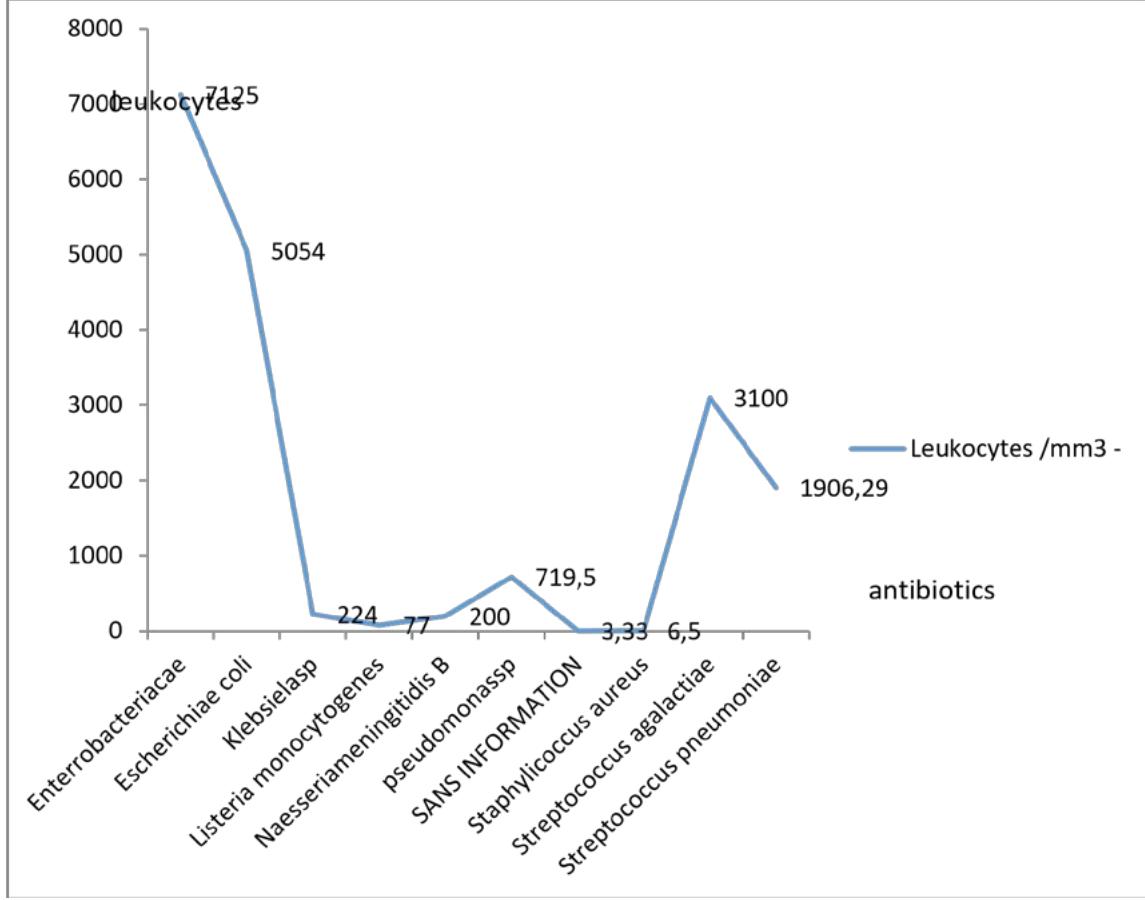 Figure 11: Average leukocyte values according to germs
# b. Biochemical
In Figure 12, we observe that the proteinopathy is high in enterobacteria infections (1.64-2.19g/L), followed by streptococci (2.31-2.34g/L). This implies that enterobacteria have a long evolution and a late management.
For Neisseria and Listeria, proteinopathy was not detectable, which may be related to early diagnosis. This justifies the non-significance of the P-value, $p = 0.8465$ for the results obtained.
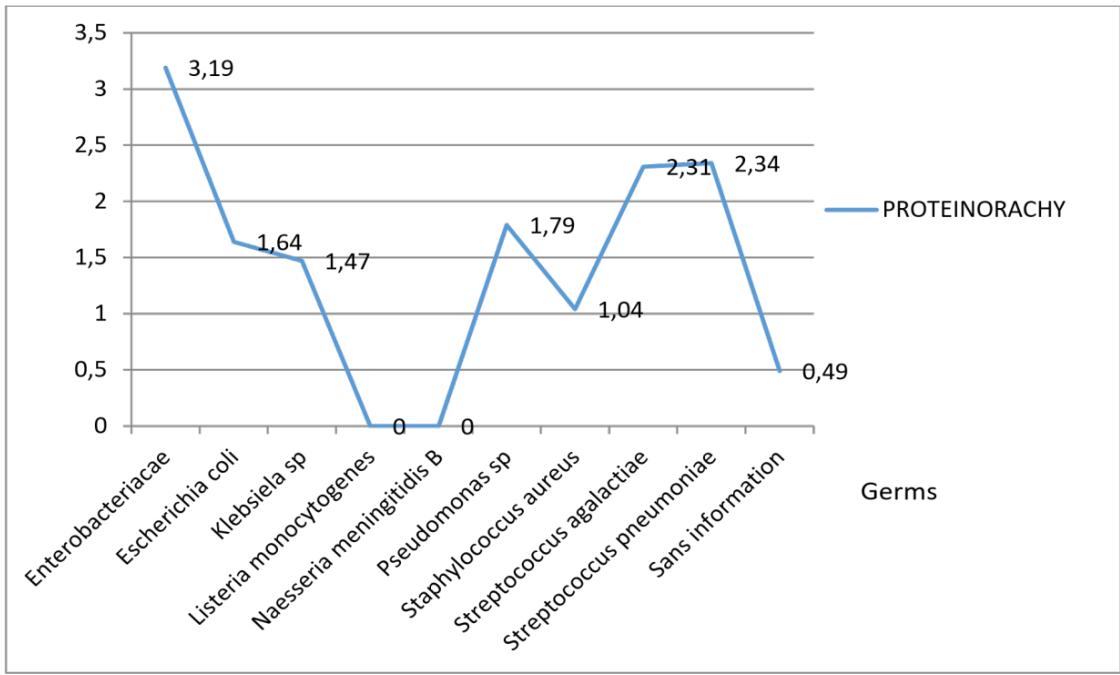 Figure 12: Average number of germs isolated as a function of proteinopathy
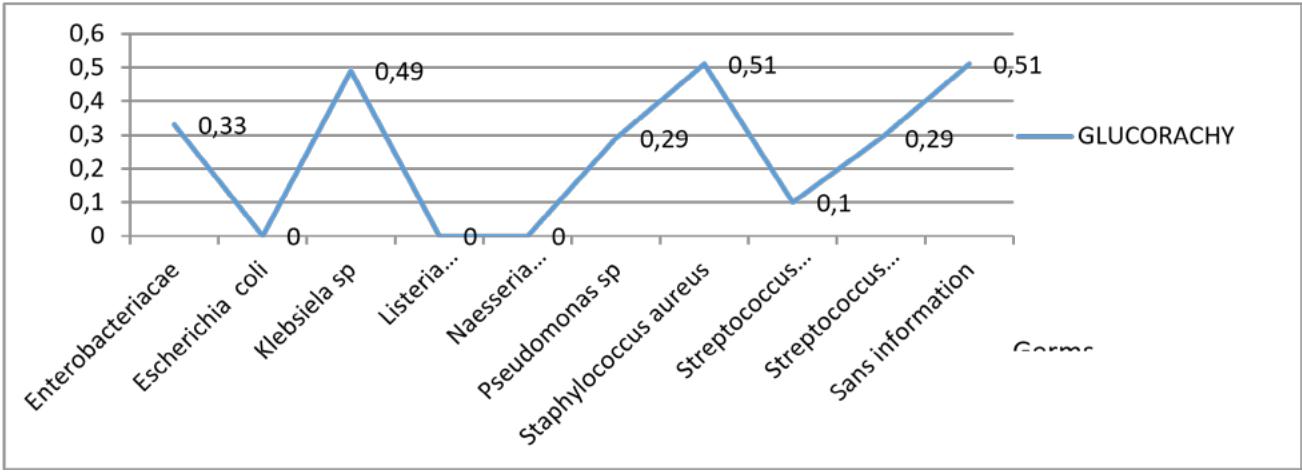 Figure 13 shows that glycorrhaphy is low in the vast majority of cases. It is customary in cases of identification of Klebsiella, streptococcus aureus With a highly significant P-value $p = 0.0156$. Figure 13: Average number of germs isolated as a function of glycorrhaphy During bacterial infection, the cell profile is granulocytic with a high cell count (2148 cells on average), a proteinopathy greater than 1.85g /l, and a low glucorachy (table 13). During fungal infections, the cellularity is low, with an average of 80 elements per mm3, the proteinopathy is high, and the blood glucose level is less than 0.84g/l
Table 13: Relationship between pathogen type-cell distribution and biochemical parameters
<table><tr><td></td><td>Leukocytes of NP* Elts**/mm 3</td><td>Protein g /l</td><td>Glucose g/l</td></tr><tr><td>Bacteria</td><td>2148,95</td><td>1,85</td><td>0,26</td></tr><tr><td>Fungi</td><td>80,21</td><td>0,84</td><td>0,63</td></tr><tr><td>Remaining</td><td>97,76</td><td>0,84</td><td>0,62</td></tr></table>
## IV. DISCUSSION
Our study population was predominantly male, with a frequency of $43.14\%$ against $39.28\%$ for the female sex, i.e., a sex ratio of 1.1. However, gender is not a risk factor for neuromeningeal diseases.
Concerning the distribution of CSF according to sex, $17.59\%$ of the population did not have information on sex, and $26.7\%$ of the study population did not have information on patient's age. The work of De Fondat et al. in 2006 in France showed that between 5 and $20\%$ of the samples transmitted could be non-compliant and that transcription or labeling errors were frequent [26].
During our study, we observed that $26.7\%$ of the CSF analyses were performed on children aged 1-5 years. At the same time, we could establish that $43.8\%$ of the CSF analyzed came from the pediatric ward. Indeed, this could be explained by the fact that in current practice, lumbar puncture is prescribed in emergencies to rule out the risk of meningitis, whose complications can occur in neonatology [26].
In second place were CSF samples from the internal medicine department, with a rate of $15.68\%$. This could be explained by the fact that this department is specialized in the management of infectious pathologies such as HIV-AIDS, tuberculosis, neuromeningeal cryptococcosis, or lymphoproliferative homeopathy.
Microbiological examination of the CSF
- Macroscopic examination of the CSF
The macroscopic examination is the first step in the analysis of a CSF, as the appearance of the CSF is characteristic of the type of germ involved.
During our study, we noted that $65\%$ of the CSF analyzed was clear, $15\%$ was hemorrhagic, $8\%$ was cloudy, and $7\%$ was xanthochromic.
A clear CSF may or may not be suggestive of illness. In the case of disease, the germs involved may be bacteria such as *Listeria* monocytogenes, *Mycobacterium tuberculosis*, *Fungi* with Cryptococcus neocons, enteroviruses in viral cases, or parasites [27].
The hemorrhagic appearance may be associated with trauma, hemorrhagic illness, vascular abnormality, and deficit in sampling quality [28,29]. However, reports of macroscopic appearance are variable and depend on the visibility of observers [30].
Biological data In our study, we had $20.78\%$ of glycorachy below the reference value, taking into account that glycorachy represents $60\%$ of blood glucose, hypoglycemia can also be reflected by; a hypoglycorachy [31]. The occurrence of hypoglycorrhagia could result in a bacterial infection.
High proteinopathy of neonates with a higher proteinopathy value than the reference value of $43.8\%$.
From the data used, $22.16\%$ had CSF with more than five cells per mm3 of the hemorrhagic CSF will increase the number of cells per mm3.
Also, $65.45\%$ of the population had a lymphocyte-like leukocyte profile, thus pointing to a viral origin condition with normal mean glycorachy and high proteinopathy up to 0.84g/l, low chlorurorachy.
Of the predominantly granulocytic fluids, the glycorrhaphy was 0.63 on average, which could be explained by early treatment combined with late collection and therapeutic glucose intake.
The mean proteinopathy is around $1.68\mathrm{g / l}$. It is higher than in the lymphocyte profiles.
Prevalence of germs
The cell count allowed differentiation between a bacterial and viral profile. A significant predominance of polynuclear cells is usually observed in bacterial identifications, whereas it is lymphocytic in viral conditions. From the culture results, it is observed that the majority of CSFs were negative, with a rate of $97.23\%$, while positive cultures represented only $2.77\%$. In the search for signs of decapitation by initial antibiotic therapy, $0.67\%$ (14) was positive. This is related to antibiotic therapy administered before lumbar puncture.
Research on the frequency of germs
A total of 96 pathogens were identified. A proportion of $65\%$ of 62 fungi overwhelmed by cryptococci $98.4\%$. Bacterial germs were dominated by the isolation of Streptococcus pneumoniae species at $47\%$, followed by gram-negative bacteria at $27.8\%$.
The isolation of cryptococci in the internal medicine department is explained by the many immunocompromised patients.
Pneumococcus was found to be the primary bacterial infectious agent, which is expected (32.5%), group B streptococcus (5.8%), and Haemophilus influenza (3.2%). These results are contradictory with studies conducted by Levy et al. in France, where group B streptococcus predominates in patients over 28 days and under two months of age (49.4%) and pneumococcus in children aged 2 to 12 months (45.2%) [32].
The low presence of meningococci is explained by the fact that we are not in the meningococcal meningitis belt and the compulsory vaccination program primarily for the pediatric population [32].
- Cellular profile of glucose as a function of germs
Bacterial infections will be associated with polynuclear hyperleukocytosis with hypoglycorachia and hyperproteinemia.
While fungal infections we obtained from our results a less frank hypoglycorrhaphy, which is related to the inflammatory reaction expected in these types of patients, the other pathogens are opportunists, not true pyrogens.
Germ profile
Enterobacteriaceae represented high cellularity, low glycorrhaphy, and high proteinopathy, which is contradictory to the literature data, as they are non-pyogenic germs; this type of reaction may be associated with a delay due to management.
Staphylococci, which are pyrogens, are associated with high cellularity, hypoglycorrhaphy, and high proteinorrhaphy profiles in agreement with expected data from the literature. For Neisseria and listeria, the proteinopathy was undetectable, which might be related to a high diagnostic precocity.
The sensitivity profile of the germs could not be discussed due to the small number of strains isolated per species. This does not allow an opinion to be formed.
## V. CONCLUSION
Analysis of cerebrospinal fluids received at the Douala General Hospital shows a low frequency of pathogen isolation and, among the pathogens isolated, a predominance of fungal agents of the genus Cryotococcus. With regard to bacterial agents, Streptococcus pneumoniae was the most represented pathogen.
Bacterial infections were associated with hypercellularity, hypoglucorachia, and hyperproteinorachia.
For fungal agents, the number of cells was lower with normal glycorrhaphy and a low elevation of the proteinorrhaphy.
From the above, it might be possible to predict the microbiological result from the biochemical and cytological parameters with good correlation.
Marin Bulat,M (2011). Recent insights into a new hydrodynamics of the cerebrospinal fluid.
Jean-François Vibert,Alain Sebille,Marie,Claude Lavalard-Rousseau,François Boureau,L (2011). Dien, Claude Marie François.
Marie-Christine Fonkoua,Muhamed-Kheir Taha,Pierre Nicolas,Patrick Cunin,Jean-Michel Alonso,Raymond Bercion,Jeanne Musi,Paul Martin (2001). Recent Increase in Meningitis Caused by <i>Neisseria meningitidis</i> Serogroups A and W135, Yaoundé, Cameroon.
T Bernard-Bonnin (1920). Purulent meningitis in children in Yaoundé: epidemiological and prognostic aspects.
J Kuhle,M Mehling,A Regeniter (2007). Diagnostic moderne du liquide céphalorachidien.
L Sakka,G Coll,J Chazal (2011). Anatomie et physiologie du liquide cérébrospinal.
Z Redzic,M Segal (2004). The structure of the choroid plexus and the physiology of the choroid plexus epithelium.
Michael Pollay (2010). The function and structure of the cerebrospinal fluid outflow system.
V Murphy,Q Smith,Rs (1986). Homeostasis of brain and cerebrospinal fluid calcium concentrations during chronic hypo and hypercalcemia.
H (2001). Dynamics of brain-derived proteins in cerebrospinal fluid.
Conrad Johanson,John Duncan,Petra Klinge,Thomas Brinker,Edward Stopa,Gerald Silverberg (2008). Multiplicity of cerebrospinal fluid functions: New challenges in health and disease.
S Chevallier,M Monti,V Vollenweider,P Michel,Lumbarpuncture,Rev Med Suisse 16,C Akiki,N Lamarre,E Boulos (1991). Method of cerebrospinal fluid analysis and surveillance of purulent meningitis.
H Reiber (2016). Cerebrospinal fluid data compilation and knowledge-based interpretation of bacterial, viral, parasitic, oncological, chronic inflammatory and demyelinating diseases. Diagnostic patterns not to be missed in neurology and psychiatry.
E Carbonelle (2009). Medicine and infectious diseases.
Hansotto Reiber (2003). Proteins in cerebrospinal fluid and blood: Barriers, CSF flow rate and source-related dynamics.
R Luxton,P Patel,G Keir,E Thompson (1989). A micro-method for measuring total protein in cerebrospinal fluid by using benzethonium chloride in microtiter plate wells..
D Robertson (2010). The Physical Chemistry of Brain and Neural Cell Membranes: An Overview.
F Gouriet,D Raoult (2009). Microbiological diagnosis: from diagnosis by etiology to diagnosis by syndrome 36 Year 2023 Microbiological diagnosis: Etiologic driven and syndrome driven.
F Denis,M Saulnier,J Chiron (1981). Rapid etiological diagnosis of purulent meningitis by indirect passive agglutination of latex particles and by counterimmuno-electrophoresis: experience and perspectives.
F De Frondat,V Delahaye,P-J Gomez,C Podlunsek,G Farges,J-P Caliste (2010). Laboratoires d’analyses de biologie médicale : un outil d’autodiagnostic basé sur la norme NF EN ISO 15189.
Arsac,Marie (2007). The infected newborn: what place for what biological marker?.
P Dieusaert (2017). Parasitologie et Mycologie Médicales - Guide des Analyses et des Pratiques Diagnostiques.
G Audibert,A Baumann (2017). Aneurysmal subarachnoid haemorrhage.
A Millet,O Decaux,L Guenet,B Grosbois,P Jego (2011). Un liquide céphalorachidien coloré.
No ethics committee approval was required for this article type.
Data Availability
Not applicable for this article.
How to Cite This Article
Baldagai Ndeva. 2026. \u201cBiochemical, Cytological and Microbiological Profile of Cerebrospinal Fluids Analyzed at the Douala General Hospital Laboratory\u201d. Global Journal of Medical Research - C: Microbiology & Pathology GJMR-C Volume 23 (GJMR Volume 23 Issue C3).
Explore published articles in an immersive Augmented Reality environment. Our platform converts research papers into interactive 3D books, allowing readers to view and interact with content using AR and VR compatible devices.
Your published article is automatically converted into a realistic 3D book. Flip through pages and read research papers in a more engaging and interactive format.
Our website is actively being updated, and changes may occur frequently. Please clear your browser cache if needed. For feedback or error reporting, please email [email protected]
Thank you for connecting with us. We will respond to you shortly.