The broiler farming business faces challenges due to many reasons such as technical innovation, finance uncertain parameters and dynamic marketing complex. Broiler farms at Sultanate of Oman has been performing with challenge and many constrains, including poor farming practices, climate stress and variability, feed grain price increase. The risk assessment of broiler business indicated high impact of products unit cost of productions, market dynamic risk and financial sustainability. Market competition and cheap frozen chicken products imported from outside significantly affect the local broiler market risk and uncertainty and marketing strategies. The study applied stochastic budget Monte Carlo Simulation approach to calculate market risk primum and reform market strategies and align them with acceptable risk tolerance comfort level of the stakeholders’ perceptions. Three production levels, products mix models, were tested under two different scenarios to measure market risk and market strategies.
## I. INTRODUCTION
Oman's poultry meat market is characterized by high demand for quality poultry meat products derived by steady population growth, high income and changing in dietary preference. The poultry sector in Sultanate of Oman produced 132,600 tons which represent $62\%$ of broiler meat self-sufficiency for year 2022. Poultry commercial farming at Sultanate of Oman breed poultry and produce poultry meat and table eggs at their farms and feed them with high cost of concentrates feed made from raw material, premix and vitamins imported from outside. Small scale farm sale live birds to local markets, while medium and large farms sell processed chicken meat to restaurants, hotels and big malls at local and reginal market. Poultry business encompasses various critical stages such as farm operation, supply chain disruption, slaughterhouse and meat processing units, market distribution and retails. This type of business is exposed to risk and creates low net profit as main inputs of feed ingredients, hatching eggs, medicine and modern houses control technologies imported from outside and exposed to high capital cost, supply chain disruptions, operation constraints and sale price uncertainties. Moreover, marketing challenges and cheap poultry products imported from different continents and sold at low prices create high pressure for poultry business economic sustainability. Unit cost increase of poultry meat products, market dynamic and uncertainty, and sale revenue volatility remain challenging and jeopardize poultry business to achieve sustainable growth and the country's food security goals. Market price volatility, food scarcity, extreme weather, soaring prices of raw materials are some risks that can disrupt the sustainability of the supply chain of chicken meat. It is essentially important for smallholder farmers to incorporate risks management approach in their chicken meat and egg productions, argued Armijal, et al. (2023). He identified 25 risk events and 45 risk agents by using
Risk of House (ROH) approach to mitigate and overcome supply chain risk management for layer farms.
The cost of main feed raw materials ingredients such as corn and soybean increased sharply by $36\%$ since early 2021 and put a high pressure on local poultry business margin and profitability in 2023. The Government subsidy programs imposed earlier in 2011 to improve local poultry production contributions stopped on year 2016. In year 2019 COVID spread over the world and cause supply chain disruptions in addition to international situation and Ukraine conflict which impact on food security, Kheiry Ishag (2024). Market volatility and uncertainty factors and risk parameters in broiler farming business are the main challenges for farmers and business owner to make informed and good decisions and needs to be analyzed, said Danilo Simões et al. (2014). This study investigated and quantified uncertainties of poultry products unit cost, market dynamics and sale revenue volatility impact to understand and quantify risk and cope with problem anticipation and consequences. Broiler risk management should involve and provide insights information for effective decision-making using the board-approved risk appetite to identify which risks to take to achieve strategic objectives. The study quantifies risk tolerance boundary for different levels of production scenarios with limited market demand capacity for fresh and frozen broiler meat products.
Oman poultry farms suffer from heat stress due to high temperature and relative humidity during summertime and relatively broiler business performance is affected. The Sultanate of Oman located at $(15 - 27^{\circ})$ north latitude with long summer season extended to six months followed by a warm winter and high relative humidity. Broiler farming at costal area of Sultanate of Oman stops poultry farming in summer-time to avoid heat stress problems and farm net profit reduction. Although new control breeding houses reduced mortality rates at summer-time, but bird daily weight gain and decreased of feed consumption efficiency are still observed and created marketing challenges, Kheiry Ishag (2019). Small size birds and whole chicken meat products below the marketing standard range (900 - 1200 grams) sold at a high discount rate and affect farming net profit, Guro Vasdal et al. (2019). Article by May J. D. et al. (2000) study and compared temperature effect on daily bird growth rate and FCR for 21 days of age and showed that temperature has a high effect on daily bird growth, FCR and body weight after three weeks of breeding. May et al., (1998) study showed that environmental conditions improvement increases as body weight increases. Gajanan K. et al., (2024) Investigated body weight and meat quality at the slaughterhouse. This study investigated discounts given to customers for small whole chicken size and its effect on market demand and net profit. Although it is not possible to predict future accurately, simulations analysis allows us to create risk profiles by generating a large number of iterations, including extreme cases, such study allows us to identify the effects of marketing and unit cost factors variation on broiler business profitability in term of probabilistic way, (Albright and Winston, 2019; Lehman and Groenendaal, 2020). With the right strategy, tools and approach, businesses can turn what appears to be a poor market situation into greater profitability and improved market positioning in the long-term.
Several poultry production risk assessment factors identified in this study to understand the impact of global and macroeconomic uncertainty on raw materials cost, business production volume level and chicken products sale price. The marketing uncertain incorporated in this study by using cumulative distribution function (CDF) to test effect of sale discount given to consumers to sale over supply chicken meat products on profit, Lima, R., Sampaio, R. (2018). The market demand available at full price for each product mix i.e. fresh, parts and frozen chicken meat products and sale price discount need to be given to sale products leftover and market over supply products were also incorporated in the study. The risk of poor technical practices performance and marketing parameters volatility required strategic decision that covers production and marketing risk and constraints, Chavas et al. (2004). The study calculated risk premium that compensates for poor technical farming and market uncertainties and estimates extra return to investors over risk free business cash flow and quantified risk premium for different marketing stagieries. The Monte Carlo models are used as a tool to quantify risk and uncertainty of the related business by many studies, (Luiz Silva et al., 2014; Gray E. Machlis, et al. (1990); Niloufar M. et al. 2024).
Dynamic models give a range of results that can mitigate and reduce operation risk and sale revenue decline impacts through a range of uncertain inputs estimate and generate accurate results for policy advisers and decision makers. The study used stochastic efficiency analysis to rank broiler farming scenarios under different production level and marketing constrain over a range of absolute risk aversion coefficient level. Hardaker et al. (2004a) structured and used technique of stochastic efficiency with respect to a function (SERF) to rank risk alternatives options models. Gregory K. et al. (2012) also used (SERF) to appraise modified genetic maize crop in South Africa. Mohammad K. et al. (2014) used (SERF) to rank different beef calving and feeding practices in western Canada. Kheiry Ishag (2019; 2020) used (SERF) and CE figures to rank poultry farming systems and dairy cow feeding practices strategies according to feeding cost and feed availability. Stochastic efficiency with respect to function (SERF) technique consists of ranking risky alternatives in terms of utility function and equal ranking of alternatives with (CE) certainty equivalents figures. The certainty equivalent (CE) is explained as the sure sum of return or wealth at present rather than unsure of the high return in future. Hardaker et al., (2004b), argued (SERF) rank risky alternatives in terms of (CE) for a defined range of risk aversion simultaneously and not pairwise as in (SDRF). Irene Tzouramani et.al (2011) used stochastic efficiency with respect to function (SERF) to test the economic viability of organic and conventional sheep farming in Greece and found both sheep farming systems are viable. The (SERF) also used to compare and rank alternatives at level of decision maker preferences for different absolute risk aversion coefficient (ARAC), Richardson J. W. et al. (2008). Khakbazan, M. et al. (2022) use SERF and certain equitant (CE) figures to rank silage-based feed diet and cattle breeding efficiency for beef backgrounding streets. Risk analysis of agriculture production systems investigated by using stochastic efficiency with respect to function (SERF) in many studies (Lien G., et al. 2007; Ascough II. J. C. et al. 2009, and Eihab M. Fathelrahman et al. 2011).
In this study, (SERF) technique is used to assess broiler business sustainability of different production levels and marketing strategies models. Six stochastic models were worked out to construct farm net profit distribution function for each proposed marketing alternative model. Risk premium (RP) analysis performed to measure excess return required by decision makers to compensate change and shift from current risk free production level to potential uncertain future return. The study identified broiler farming marketing alternative strategies and calculated net profit performance risk-efficient and verified models economics sustainability.
The journey of broiler business entrepreneurship is inherently filled with risks and uncertainties. However, successful risk-takers possess a unique combination of characteristics that enable them to navigate broiler business challenges effectively by cultivating resilience, adaptability, strong vision, optimism, a willingness to learn, decisiveness, and strong networking skills, entrepreneurs can position themselves for success in an ever-changing landscape. Management by embracing these traits not only enhances their ability to take calculated risks but also contributes to sustainable business growth and innovation within their ventures.
## II. METHODOLOGY
The poultry business net profit is calculated to quantify the economic performance of alternative production level and product mix scenarios and achieve business sustainability. The conventional normal approach used in business evaluation is to calculate the best estimate available data for cost and revenue for each poultry products level and production mix. The single value of net profit generated by conventional methods doesn't reflect risk of cost of production, sale product volume and market demand uncertainty. It doesn't also reflect market demand environment risk in terms of range of products sold with full price and product over supply sold with sale discount price. Broiler farming business in this study was exposed to a significant loss due to sale discounts given to consumers and considerable market risk and uncertainty. Accordingly, the model was constructed to estimate a range of unit chicken meat cost, sale volume decline and market demand parameters risk and quantify marketing uncertainty and it is effect on broiler farming net profit.
The dynamic simulation model-based probability distribution functions of net profit are used to evaluate risk volatility and economic sustainability and to compare different product mix and discount need to be given for each poultry product to increase net profit and achieve business sustainability. The stochastic budgeting and stochastic efficiency methods are used to consider operation and market risk and uncertainty variables in the model presented in study area. Technical broiler farming practices such as flock uniformity, feed conversion ratios (FCR), bird live weight growth, and its impact to products market share and market growth were also investigated in this study.
### a) Marketing Historical Data and Data Collection
The broiler farming data used in this study is collected from a broiler farm located at Salah city at Dhofar Region in Sultanate of Oman. Day time temperature range 32-35 °C from April to June and reduced to about 27-29 °C from July to August during Kharef period and increases to 31°C for the rest of the year. The relative humidity percentage range is 50%-65% and increased up to 75% in summer season and increased to 90% during rainy season (kharef) extended from July to September. Broiler farm has 48 houses with dimensions of (L84XW14) meter and 12 Fans.
The data collected include historical broiler farm production level for fresh and frozen chicken meat, product mix combination and figures for alternatives market demand and chicken meat sold during year 2017 - 2020. Broiler operation farming performance parameters such as flock uniformity and chicken salable meat, dressing weight percentage and carcass yield, broiler live weight, breeding duration period, daily bird growth rate were collected from the broiler farm for comprehensive comparative and simulation analysis. Farm production data and marketing data collected and analyzed to test farm performance efficiency under different market scenarios. The whole chicken product size has a significant impact on market demand and broiler chickens desired weight that meet market specifications is crucial factor to achieve market potential demands. These factors were studied to understand farm operation efficiency parameters and thereby enhance customer satisfaction and business sustainability.
Understanding historical companies' market share and market potential demand will help decision makers to optimize broiler business performance. The market demands parameters such as customer chicken products preferences, market share and market growth data were collected and analyzed by using scatter plot analysis. The Market demand is not fixed, but changes over time and across different segments of the market and it represents the maximum potential sales that company can achieve in the market. Increasing products market share may not necessarily increase demand and Company decision of whole chicken product price reduction on demand investigated and answered by comprehensive scenario simulation analysis.
### b) Broiler Business Net Profit Multiple Simulation Model
Net profit was used as an economic performance indicator and uncertain parameters
## i. Multiple Simulation Model Equation
incorporated in the model to calculate sale revenue, products' cost and business net profit. The net profit calculated by subtracting the total cost of products from the total sale revenue to obtain simulated business net profit probability distribution. Two different scenarios used, and each scenario has three product volumes and product mix alternatives. The first scenario represented potential return with normal market promotion, whereas the second scenario represented market risk demand volatility parameters. Product cost, sale volume and revenue, and discount given to each broiler products were collected from historical farm data and included in the Model. If net profit is a function of both deterministic and stochastic variables, the resulting outcome gets a range of values instead of a single value obtained in a conventional deterministic financial evaluation. Net profit for scenario (1) and (2) for three production levels were obtained for each model from the formula below.
$$
N ^ {\sim} \text{Profit} = \left(^ {\sim} Y a * \sim P a + Y b * \sim P b + Y c * \sim P c + \dots .\right) - (C o Y a, + C o Y b, + C o Y c + \dots ..) \quad \text{Scensario} (1)
$$
$$
N ^ {\sim} \text{Profit} = \left(^ {\sim} Y a * \sim P a + Y b * \sim P b + Y c * \sim P c + \dots .\right) - \left(U n ^ {\sim} C o Y a, + U n ^ {\sim} C o Y b, + U n ^ {\sim} C o Y c + \dots .\right) \tag{2}
$$
Where:
$\mathrm{N}^{-}$ Profit Net profit probability distribution for net profit.
~Ya Fresh product stochastic yield sold.
~Pa Fresh product stochastic market price.
Yb Frozen product stochastic yield sold.
$\mathbf{\tilde{P}b}$ Frozen product stochastic market price.
Yc Fresh parts products stochastic yield sold.
$\tilde{\mathsf{P}}\mathsf{c}$ Fresh parts products stochastic market price.
Un C Fresh product stochastic cost for sale products.
Un ${}^{\circ}\mathrm{C}$ Frozen product Stochastic cost for sale products.
### c) Operation and Marketing Uncertain Variables and Simulation Risk Analysis Model
The study used Monte Carlo simulation model to evaluate risk and uncertain input variables of a model. The model identified and tested the effects of main uncertain variables on the business performance and net profit. Product mix unit cost, production volume, market demand at full price and discount needed to sale remaining products were tested and evaluated by the model. The uncertain variables rage determined for main variables in model by using Standard Deviation (SD) that describes the range of uncertainty around each expected variable and presented in table (1). For this purpose, we used historical data of broiler farm at Dhofar Region of Sultanate of Oman. The model included below variables to calculate randomly generated input values taken from the probabilistic distribution function for each variable. Variable distribution best fit selected by using (Bestfit) function and presented below. The model merge inputs data to generate estimated outcome value for each net profit. The process used @Risk 8.2 program to run simulation with iteration of 10 thousand times.
### d) Products Mix, Production Volume Alternatives and Marketing Scenarios
Products mix and marketing strategy play a key variable for broiler business performance and net profit calculation. Frozen products face competition from local companies and cheap imports products from outside. The unit cost of frozen products is high compared to import products. The Farm's whole chicken products below the standard market range (900-1200 grams) consist of $17.41\%$ of total production. Due to small chicken size and high unit cost of production Company gives a high discounts rate i.e. $17\%$ to sale leftover products. Although fresh products have high price realization, they face challenges in terms of shelf- life short duration, transportation cost, high expiry and high shelf rent rebates.
Table 1: Uncertain Parameters for Products Volume, Market Demand and Cost of Production Model
<table><tr><td>Items</td><td>Uncertain
Variables</td><td>Variable Range</td><td>Mean</td><td>SD</td></tr><tr><td rowspan="4">Product Cost RO/kg</td><td>Fresh</td><td>1,100 – 1,350</td><td>1,242</td><td>46.8</td></tr><tr><td>Fresh Parts</td><td>1,500 - 2,500</td><td>1,999</td><td>189.1</td></tr><tr><td>Frozen Parts</td><td>1,300 – 2,000</td><td>1,799</td><td>122.0</td></tr><tr><td>Frozen</td><td>950 – 1,100</td><td>1,006</td><td>27.6</td></tr><tr><td rowspan="4">Production Volume Tons</td><td>Fresh</td><td>3,462 – 3,500</td><td>3,462</td><td>-</td></tr><tr><td>Fresh Parts</td><td>1,469 – 1,850</td><td>1,469</td><td>-</td></tr><tr><td>Frozen Parts</td><td>595 – 1,000</td><td>595</td><td>-</td></tr><tr><td>Frozen</td><td>1,031 – 1,300</td><td>1,000</td><td>-</td></tr><tr><td rowspan="4">Market Demand (Full Price)
Tons</td><td>Fresh</td><td>3,462</td><td>3,433</td><td>140</td></tr><tr><td>Fresh Parts</td><td>1,469</td><td>1,479</td><td>94</td></tr><tr><td>Frozen Parts</td><td>595 – 0.595</td><td>150</td><td>127</td></tr><tr><td>Frozen</td><td>1,031 - 800</td><td>883</td><td>71</td></tr><tr><td rowspan="4">Sale Promotion Discount%</td><td>Fresh</td><td>0.0% - 2.0%</td><td>9.40%</td><td>4.42%</td></tr><tr><td>Fresh Parts</td><td>0.0% - 5.0%</td><td>9.06%</td><td>4.02%</td></tr><tr><td>Frozen Parts</td><td>0.0% - 5.0%</td><td>9.06%</td><td>4.02%</td></tr><tr><td>Frozen</td><td>5.0% - 17.0%</td><td>10.35%</td><td>5.38%</td></tr></table>
To compare economic performance of alternative production and marketing strategies, model assumptions determined variables that would change from one scenario to another to identified decision's variables. Different production variables values for each scenario modelled with (RiskSimTable) functions. The Multiple Simulations function is run by using @Risk 8.2 program to pick up production variable value for each simulation and option.
## III. RESULT AND DISCUSSION
### a) Broiler Production and Marketing Comparative Analysis
The present study aimed to compare historical broiler production parameters such as bird growth, live body weight, dressing percentage and warm carcass weight. The whole chicken weight range compared from 2017 to 2020, and analysis showed increasing trend of small birds below 1000 Grams and decreasing trend of big birds above 1000 Grams, as per Figure (1). The poor flock uniformity and total production below market standard (900 Gram) increased from $14.73\%$ in 2017 to $17.41\%$ in 2020. Small whole chicken products created marketing challenges and forced Management to reduce sale prices and reduced sale revenue, Table (2).
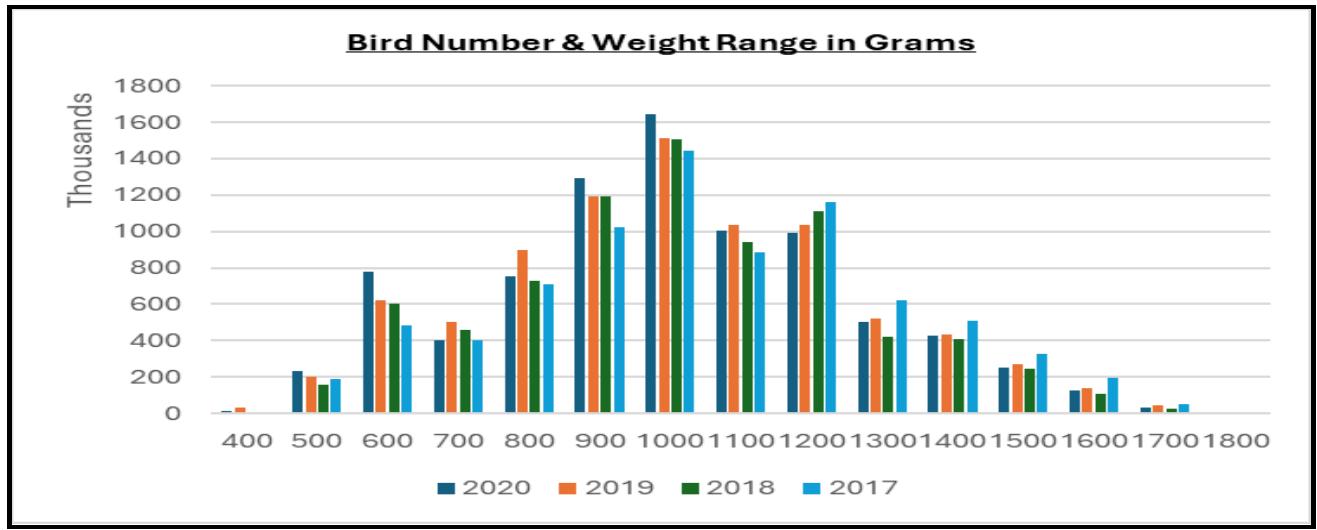 Figure 1: Bird Number and Weight Range in Grams for 2017 to 2020
Although total chicken meat production increased the total salable meat reduced from $71\%$ to $69\%$ due to poor flock uniformity and chicken processing plant inefficiency. Historical data analysis showed that fresh chicken products' percentage increased from $38.76\%$ to $41.06\%$ and cut-up chicken products increased from $34.17\%$ to $38.41\%$. The frozen whole chicken products percentage reduced from
27.07% to 20.53% but at the same time whole chicken size range from 900-1000 Grams increased from 2,601 tons to 2,880 tons and created high pressure for marketing team to increase sale discount to $17\%$ which reduced sale revenue by RO 578,137. Table (2) presents production carcass percentage and chicken meat products category percentage compared to sale revenue figures.
Table 2: Production Carcas Weight, Marketable Meat and Market Share Volatility for Year 2017-2020
<table><tr><td>Year Weight/ Gram</td><td>2020</td><td>2019</td><td>2018</td><td>2017</td></tr><tr><td>900</td><td>15%</td><td>14%</td><td>15%</td><td>13%</td></tr><tr><td>1000</td><td>19%</td><td>18%</td><td>19%</td><td>18%</td></tr><tr><td>1100</td><td>12%</td><td>12%</td><td>12%</td><td>11%</td></tr><tr><td>1200</td><td>12%</td><td>12%</td><td>14%</td><td>15%</td></tr><tr><td>1300</td><td>6%</td><td>6%</td><td>5%</td><td>8%</td></tr><tr><td>1400</td><td>5%</td><td>5%</td><td>5%</td><td>6%</td></tr><tr><td>Total Production/ton</td><td>8470</td><td>8520</td><td>8008</td><td>8390</td></tr><tr><td>Total Salable Meat%</td><td>69%</td><td>68%</td><td>71%</td><td>70%</td></tr><tr><td>Total meat below 900 Gram/ton</td><td>1,474</td><td>1,554</td><td>1,344</td><td>1,236</td></tr><tr><td>Fresh chicken Products /Kg%</td><td>41.06%</td><td>44.88%</td><td>49.03%</td><td>38.76%</td></tr><tr><td>Frozen chicken Products /Kg%</td><td>20.53%</td><td>26.03%</td><td>18.23%</td><td>27.07%</td></tr><tr><td>Cut-Up chicken Products /Kg%</td><td>38.41%</td><td>29.09%</td><td>32.74%</td><td>34.17%</td></tr><tr><td>Sale Revenue after Discount RO</td><td>9,731,778</td><td>9,948,479</td><td>10,497,634</td><td>10,309,915</td></tr></table>
Broiler Farm data analysis showed statistical means, standard deviation, skewness and kurtosis figures for (2017-2020). Farm production mean standard Deviation (SD) showed a wide spread in production values within a single year data, whereas coefficient variation (CV) figures showed production mean variation percentage comparison between two or more years. The analysis showed production variation and unsalable meat increased, Table (3).
Table 3: Historical Data Broiler Flock Uniformity, CV and Statistical Bird Weight Result
<table><tr><td>Year</td><td>2020</td><td>2019</td><td>2018</td><td>2017</td></tr><tr><td>Mean</td><td>604 566</td><td>607 728</td><td>572 035</td><td>599 179</td></tr><tr><td>SD</td><td>497 740</td><td>476 498</td><td>486 199</td><td>464 475</td></tr><tr><td>C.V.%</td><td>82.330</td><td>78.406</td><td>84.994</td><td>77.518</td></tr><tr><td>Min</td><td>7 141</td><td>7 747</td><td>6 178</td><td>14 665</td></tr><tr><td>Max</td><td>1 646 144</td><td>1 513 780</td><td>1 507 210</td><td>1 445 197</td></tr><tr><td>Skewness</td><td>0.7456</td><td>0.554</td><td>0.7300</td><td>0.5873</td></tr><tr><td>Kurtosis</td><td>-0.3178</td><td>-0.8256</td><td>-0.5976</td><td>-0.6154</td></tr><tr><td>Averg. Live Weight/kg</td><td>1.380</td><td>1.430</td><td>1.380</td><td>1.500</td></tr></table>
### b) Broiler Production Volume and Product Mix Net Profit Simulations Statistical Analysis
The descriptive statistics analysis was performed to quantify risk and calculate the net profit of three different broiler farming performance. The probability distribution functions (PDF) analysis performed for three levels of production i.e. 6,557, 6,800 and 7,650 tons to calculate net profit probability distribution for each production level. The net profit probability distribution skewed to the left and breakeven point of not achieving positive profit increased from $9.0\%$ to $13.6\%$ and to $22.1\%$ with production levels increased from 6,557 to 6,800 to 7,650 tons respectively.
Net profit simulation analysis performed for three different production volumes and products mix scenarios. Option No (1) represents baseline Broiler SD1 model with 6,557 tons production volume achieved net profit mean of RO 460,219 and $8.8\%$ breakeven point. Option No (2) represents Broiler SD2 model generated RO 400,964 net profit and $13.3\%$ breakeven point and option No (3) represents Broiler SD3 model with the lowest net profit and high Value at Risk (VaR) and SD represents high market risk. The analysis showed that Baseline model (Broiler SD1) is the best production volume and product mix broiler performance with high profit and low standard deviation SD.


The net profits probability distribution functions (PDF) of three production alternatives are performed to evaluate risk volatility and economic sustainability. The economic performance simulation analysis of alternative production strategies and risk factors identification showed that low standard deviation (SD) and net profit range of RO (1,957,957) for option (1) compared to higher standard deviation (SD) and a wide range of net profit RO (2,418,148) for option (3) as presented in table (4) below. The analysis showed that option (1) reduces performance variability and focuses on effective use of resources and reduces waste and undesirable chicken meat products.
Production plan for option (1) produced a total volume of 6,557 tons poultry meat with 3,462 tons fresh and 1,469 tons fresh parts, 595 tons frozen parts and 1,031 tons frozen whole chicken. Whereas production plan for option (3) produced a total volume of 7,650 tons poultry meat with 3,500 tons fresh and 1,850 tons fresh parts, 1,000 tons frozen parts and 1,300 tons frozen whole chicken. The analysis showed Baseline option (1) is more sustainable than option (3), as illustrated by table (4). Market risk management can improve business opportunities by producing quality products rather than increasing whole frozen chicken market share of undesirable products.
The descriptive analysis shows that reducing high risk fresh products by $5\%$ and increasing low risk frozen products by $5\%$ increased marketing risk and increased the value at risk (VaR) from $(-100,000)$ to $(-364,000)$ with $95\%$ confidence level and increased breakeven point from $8.8\%$ to $22.7\%$. Poor flock uniformity and discount given to sale small whole chicken product were the main operation problems behind this dilemma.
Table 4: Statistical Result of Broiler Performance Under Market Uncertain Challenges Scenario Model.-
<table><tr><td>Item</td><td>Option No (1)</td><td>Option No (2)</td><td>Option No (3)</td></tr><tr><td>Production volume /ton</td><td>6 557</td><td>6 800</td><td>7 650</td></tr><tr><td>Minimum</td><td>-498 983</td><td>-589 034</td><td>-858 074</td></tr><tr><td>Maximum</td><td>1 458 974</td><td>1 427 041</td><td>1 560 074</td></tr><tr><td>Profit Mean</td><td>460 219</td><td>400 964</td><td>334 557</td></tr><tr><td>Profit SD</td><td>345 552</td><td>352 798</td><td>426 521</td></tr><tr><td>Skewness</td><td>0.0368</td><td>0.0383</td><td>0.0382</td></tr><tr><td>Kurtosis</td><td>2.5972</td><td>2.5926</td><td>2.6019</td></tr><tr><td>Value at Risk (VaR)</td><td>-100 000</td><td>-171 000</td><td>-364 000</td></tr><tr><td>Breakeven%</td><td>8.8%</td><td>13.3%</td><td>22.7%</td></tr></table>
Although standard deviation (SD) is an attractive measurement to calculate risk, it is used to measure total risk, which includes the downside and upside tail end risk and it is not a powerful tool for differentiation non-symmetric probability distribution function of production levels' net profit. The large negative volatility at downside and business loss movement is harmful and needs to be investigated and control by broiler farming Management through optimizing production level with marketing dynamic activities. Downside risk analysis is performed in this study to quantify the worst-case loss due to uncertain production and marketing variables in case of market deterioration and stress situation and small whole chicken size product and its impact on market demand and consumer preference of hotel, restaurant, and catering services (HORECA) channels.
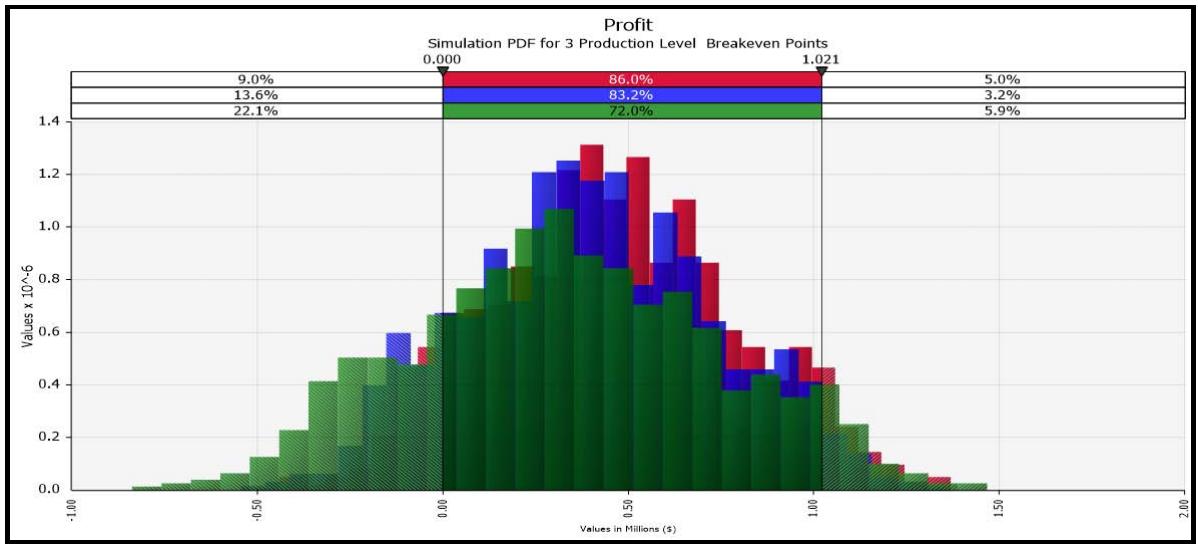 Figure 2: Broiler Product Mix Net Profit Probability Distribution Function and Breakeven Point Analysis

Figure (2) shows three different scenarios of broiler production level, product mix and different Marketing strategies. The net profit distribution functions (PDF) stimulated for three production level and products mix options and showed the probability of achieving a target net profit of RO 460k for each production level. The point of not achieving positive net profit for option (1) record $8.8\%$ and for option (2) is $13.6\%$ and $22.7\%$ for option (3). The Figure also shows the probability of achieving positive net profit for option (1) is $91.0\%$, option (2) is $86.4\%$ and for option (3) is $77.9\%$. Investors and broiler farmer decisions will depend mainly on farmers' risk appetite and risk tolerance to understand which risk to accept, and production level and products mix that balance between potential benefit and threatens according to market dynamic situation.
### c) Downside Risk and Tornado Sensitivity Analysis
Downside simulation tornado sensitivity analysis performed to test tail-end distribution for three production level scenarios and rank uncertain operation and marketing parameter effect on broiler farming net profit. The poor flock uniformity observed and reduced salable meat to $70\%$ and increased risk of new marketing strategy implementation even with $17\%$ marketing discount given to consumer. The Value at Risk (VaR) model introduced as an objective quantitative measure of downside risk especially when the random payoffs are not normally distributed with (0.0382) skewness and (2.6019) kurtosis. The VaR calculates the worse cause and loss and recorded RO (-100k) for option (1) and increased to RO (-364k) for option (3) with confidence level of $95\%$. The VaR measures downside risk at various levels of risk aversion level according to decision makers' willingness and ability to pay for risk.
The sensitivity and tornado analysis shows that unit cost of fresh and frozen parts has higher impact on target net profit of RO 460K, followed by market demand of whole fresh and whole frozen chicken and frozen parts. The operation team should work out a plan to reduce unit costs and improve flock uniformity through increasing live body weight and carcass weight up to market demand level range 900-1200 grams. Many technical parameters affect daily body weigh growth and flock uniformity such as quality hatching eggs, feed quality, hygiene and biosecurity, house ventilation and temperature and humidity control and supply chain management control.
The marketing team should work out a plan to increase demand for fresh and frozen whole chicken and sign a hedging contract to mitigate sale price volatility risk. Promotion programs should also carefully be calculated and monitored to maximize net profit of sale leftover small frozen whole chicken through balancing marginal cost with marginal revenue figure. Figure No. (3) ranks and shows quantitative figures impact of each variable on target net profit value of RO 460,000.
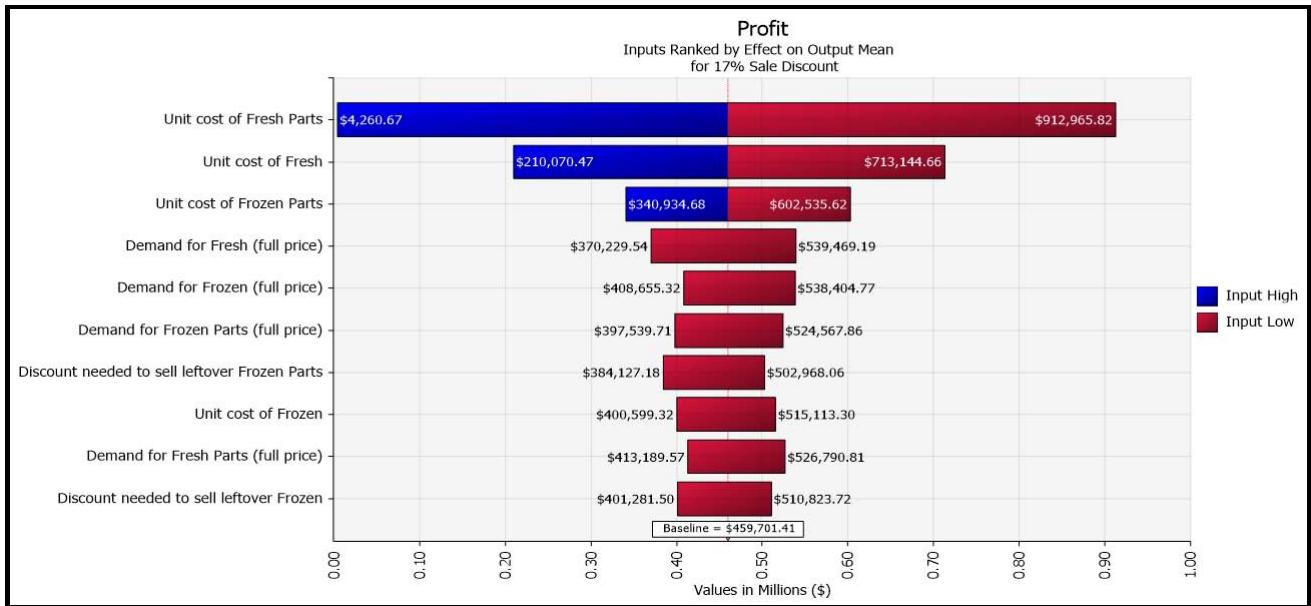 Figure 3: Ranking Input Parameters Effect on Net Profit and Tornado Sensitivity Analysis
### d) BCG Matrix Tool Analysis and Market Strategy
The Boston Consulting Group (BCG) Matrix tool analysis performed to test market performance of alternative production and marketing strategies and identify broiler products market share and products competitiveness and marketing strength. The scatter plot analysis was performed by collecting historical data and simulated two products groups, i.e. fresh and frozen chicken meat, to test market share and growth strength for each product. Product market demand stress analysis examined low and high demand reductions effect on net profit for three levels of market
demand. Three models for each product under different market demand stress positions performed by using quadrant analysis and result presented at Table (5).
Quadrant analysis is a business strategic tool used to evaluate organization products' strategical position to build effective market strategy. The analyses divide data into four categories based on two criteria, to represent the effect of market demand on net profit. The quadrant analysis helps in identifying fresh and frozen products' market demand strengths and weaknesses and explains their market demand shares and net profit growth opportunity. Fresh products showed high market demand share and potential profit growth. It is cash generated products and needs to be supported by the marketing team to maintain healthy financial. Frozen products showed low market shares and low growth, and Mangment should invest to increase potential growth and sustain profit growth.
Table 5: Target Profit Vs Market Demand Share for Fresh and Frozen Products and Market Stress Analysis
<table><tr><td rowspan="2">Item</td><td>All Value</td><td>Demand reduction 0-10%</td><td>Demand reduction 80-90%</td><td>All Value</td><td>Demand Reduction 10-20%</td><td>Demand reduction 60-70%</td></tr><tr><td colspan="3">Fresh High Risk 5% Discount</td><td colspan="3">Frozen Low Risk 17% Discount</td></tr><tr><td>Mean X (Demand)</td><td>3,433</td><td>3,181</td><td>3,587</td><td>883</td><td>816</td><td>895</td></tr><tr><td>SD X</td><td>140.0</td><td>44.94</td><td>15.205</td><td>70.516</td><td>3.301</td><td>6.741</td></tr><tr><td>Mean Y (Profit) RO</td><td>459,701</td><td>370,229</td><td>539,469</td><td>459,701</td><td>408,655</td><td>538,405</td></tr><tr><td>SD Y</td><td>330,806</td><td>324,539</td><td>350,431</td><td>330,806</td><td>335,676</td><td>367,511</td></tr><tr><td>Correlation Pearson</td><td>0.100</td><td>0.039</td><td>-0.078</td><td>0.048</td><td>0.050</td><td>-0.026</td></tr><tr><td>Quadrant I</td><td>26.4%</td><td>00.0%</td><td>53.0%</td><td>21.0%</td><td>0.0%</td><td>61.0%</td></tr><tr><td>Quadrant II</td><td>23.2%</td><td>37.0%</td><td>00.0%</td><td>28.6%</td><td>45.0%</td><td>00.0%</td></tr><tr><td>Quadrant III</td><td>25.1%</td><td>63.0%</td><td>00.0%</td><td>31.2%</td><td>55.0%</td><td>00.0%</td></tr><tr><td>Quadrant IV</td><td>25.3%</td><td>00.0%</td><td>47.0%</td><td>19.2%</td><td>0.0%</td><td>39.0%</td></tr></table>
The unit cost stress analysis shows that reducing fresh unit cost will increase fresh market demand shares and market growth with potential of increasing market demand more than market growth. Reducing the unit cost of frozen will increase market demand and growth but with a probability of increasing market demand share more than increasing profit growth. The frozen products identified as low risk tolerance and steadily sustainable profit growth and fresh products recognized as high risk tolerance products with high market demand share potentials.
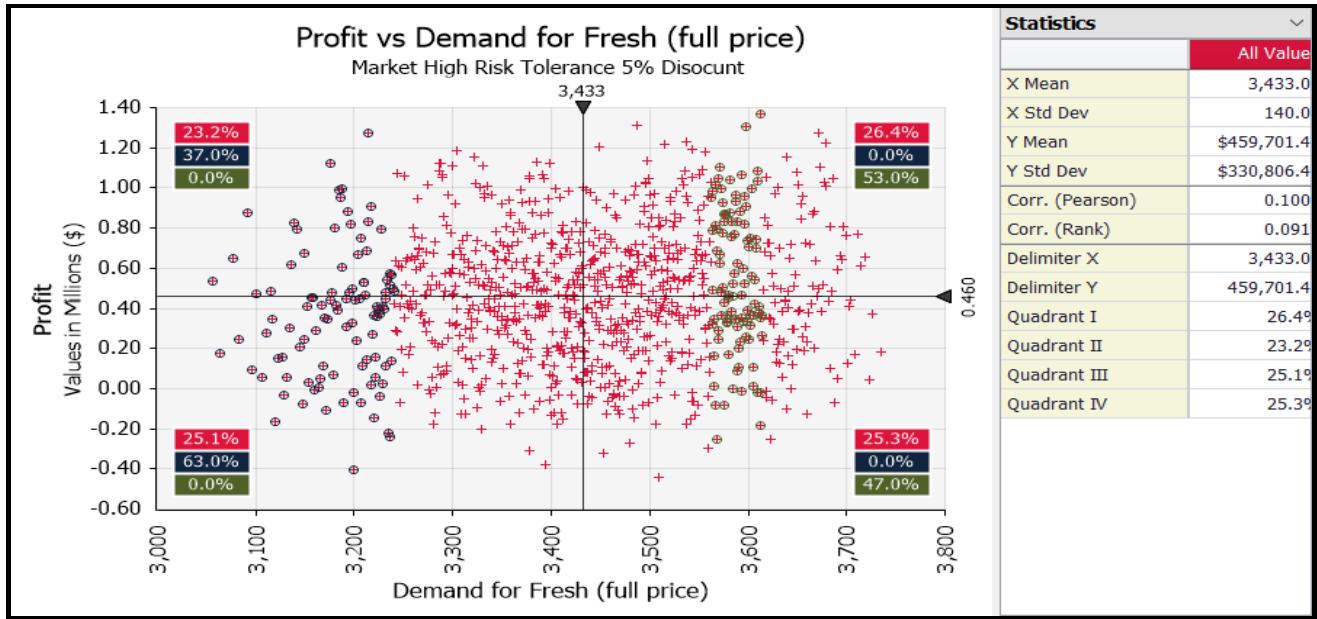


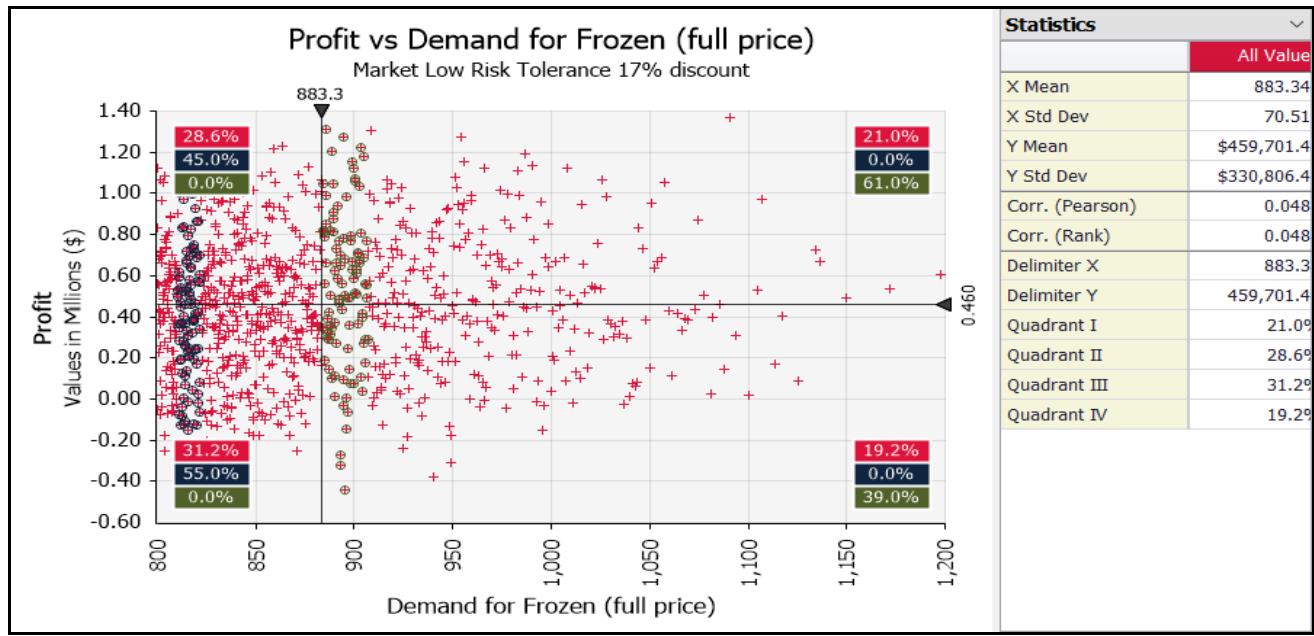 Figure 4: Broiler Products Marketing Share and Growth and Profit Scatter Plot Quadrant Analysis
Scatter Plot stress analysis showed that marketing strategy scenarios depending on unit cost reduction will increase market demand share more than net profit growth. The marketing strategies should monitor and observe sale revenue of frozen and fresh products and control contract expenses such as refrigerated transportation cost, supermarket shelf rent cost, products expiry return cost and review product cash flow to prevent unexpected overrun and negative affect on organization financial health. The production team should monitor unit cost saving plans for fresh and frozen products to extend market demand and market shares and achieve sustainable business growth rate.
The broiler product market demand uncertainty can be divided into two categories, fresh products with high operation and marketing risk, recognized with high return realization and market volatility. Frozen broiler products are recognized as low return and market volatility with one year shelf life duration. The products identified as low stable market products with stability income and low return. Understanding the elements and characters of each broiler products and combination will enhance decision makers process and achieve organization objectives. Understanding investor and stakeholders risk tolerance approaches are essential in determining broiler business strategies with business objectives. The fresh products exposed to unstable potential larger return risk despite the possibility of substantial and significant losses. The risk management decision making process can lead to significant stress and challenges during market downturns. The strategies for fresh meat, high risk and uncertain challenges should include market diversification to avoid high loss of single customers due to stopping orders suddenly. While low risk tolerance frozen market strategy should balance market stability and market growth.
Effective risk management is crucial for mitigating uncertainties and protecting broiler business investments and operation across both high-risk and low-risk products categories matrix. Fresh product are high market shares and grow slowly and are a leader in the marketplace. It is cash generation and should spread risk and diversify products to increase market growth activities, whereas frozen products have a low market demand share and dominate by import products. Frozen products have low market shares and show slow market growth and less cash generation to sustain financial health. The market strategy for frozen should balance between steady market share and business growth to achieve financial stability and sustainability. Both operation and market risk measures and quantification enabled organization to address new marketing strategies and fresh product repositioning, as per Figure (4).
### e) Net Profit Frequency Distribution and Downside Risk Management
The net profit frequency distribution shape is one of important tools to assess and manage broiler farming risk. As farmers like good uncertainty products because they increase the potential of gain and increase net profit and dislike bad uncertainty products as it increases likelihoods of sever losses. The total variance of risk premium which measured by skewness represents total famers participation and asymmetric views of good and bad uncertainty products. The skewness risk premium measures the spread between upside and downside net profit components of variance risk premium.
Downside risk analysis refers to the left tail end probability of net profit fall below the mean. It is concentrated on the loss opportunity results from a net profit decrease due to products unit cost change and market demand revenue decline consequent to market conditions deterioration. Downside risk can also be identified as an statistical tool that aims to calculate and quantify the maximum loss can result from uncertainty in the difference between expected and realized net profit due to unit product cost and market share and growth conditions.
Simulation analysis was performed to obtain net profit frequency distribution and calculated distribution measures skewness and kurtosis. Skewness measures the degree of variability of a frequency distribution of net profit and in all three production scenarios positive net profit skewed distribution were obtained and range between (0.0368 - 0.0383). Kurtosis test was obtained and record a figure between (2.5926 - 2.6019). Short and medium decisions makers need to look for skewness and kurtosis figures to judge net profit distribution shape because they consider the extremes of data sets at short time period rather than average figures which will take long time period. Kurtosis figures are positive for all production scenarios and represent flatter peaks and thinner light-tail distributions. The simulation analysis of broiler business performance under market uncertainty shows that increase production from 6,557 tons to 6,800 tons and 7,650 tons increased risk and stander deviation SD from 345,552 to 352,798 and 426,521 respectively. The value at risk VaR also increased from (100,000) to (171,000) and (364,000) respectively. The probability distribution function PDF of broiler farming results showed at Figure No (2) and Table (4).
### f) Technical and Market Risk Quantification and Cumulated Distribution Function Analysis
Broiler market uncertainty described by cumulated distribution function (CDF). The entire change of CDFs is quantified in terms of the net profit difference between two CDFs. Net profit of each market strategy measure developed in this study reflects the relative impact of distributional changes of inputs (market demand production volume) on the change of output distribution (net profit). The study tested sustainability of three broiler production levels and products mix and two scenarios i.e. Basic Model (Broiler SD1) and model with uncertain marketing strategies (Broiler UND1) were used. Each scenario represented and included three market alternatives models. This study constructed the cumulated distribution function (CDF) graph to quantify market risk and indicates the range and probabilities of net profit value for six different production volume and marketing alternatives, Figure (5). Due to cumulated distribution function (CDF) lines crossing in the graph, we could not be able to rank operation and market alternatives risk accord with their economic sustainability by using the first and second stochastic dominance with respect function (SDRF). Accordingly, stochastic efficiency with respect to function (SERF) analysis has been used for a better risk ranking analysis. The analysis showed Baseline models are better alternatives and uncertain market conditions need to be monitored and controlled to form dynamic market strategies and risk efficient alternatives as shown in Figure (5).
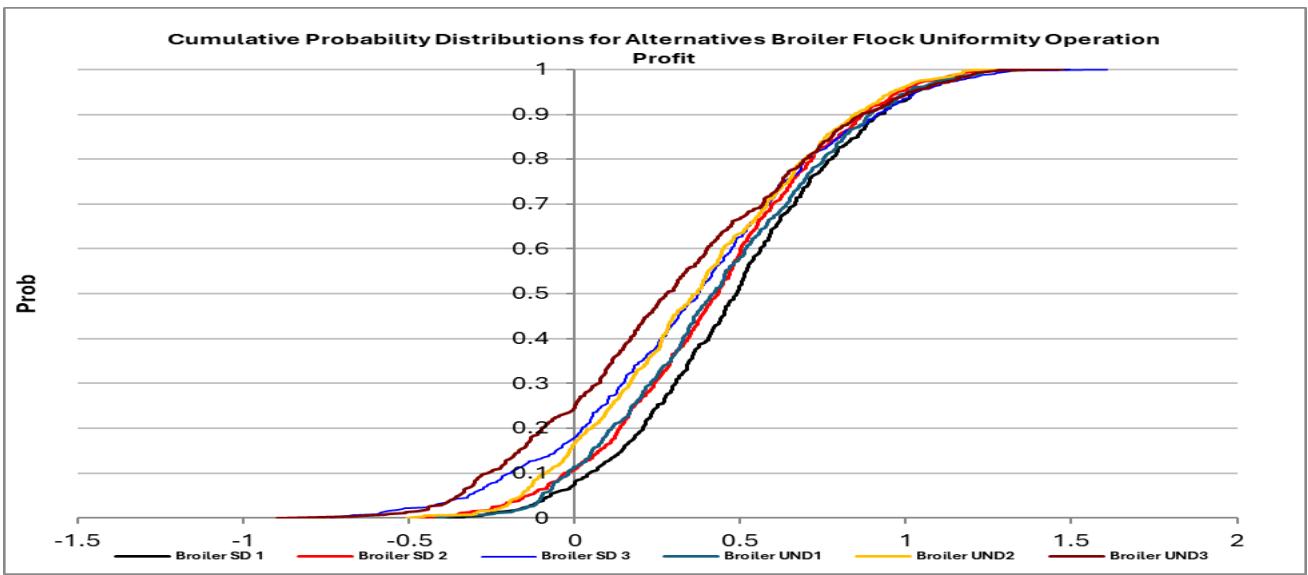 Figure 5: Comparison of 7 CDF of NPs of Broiler Production and marketing Alternatives Strategies
### g) Certainly Equivalent Coefficient and Market Risk Premium Analysis
The study calculated stochastic efficiency with respect to a function (SERF) by using SIMETAR program developed by Richardson et al. (2008), to evaluate risk-efficient of broiler product mix, production volume level and market demand instabilities. The analysis compared Certainty Equivalent (CE) of uncertain potential future return of broiler farm performance with current farming practices and
marketing demand volatility. Three different production groups examined with different product sale discount given to customers to sale balance small whole chicken product. Net profit alternatives options for three different production levels and market demand compared by using multiple simulation model and construction SERF and CE analysis. The CE is guaranteed low net profit that corporate decision makers would accept now rather than taking risk on a higher uncertain profit in the future. The corporate decision maker's risk tolerance level recognized and considered both sides of the equation the willingness and financial ability that stakeholders are ready to lose and take the risk. The study investigates broiler business risk and assesses operation and market risk that safeguards financial stability and achieves growth objective. Broiler business risk tolerance level influenced by financial position such as revenue, expenses, debit obligation and cash reserves. A company with strong financial positions and sufficient cash may have a higher risk tolerance to pursue growth opportunities. The corporate strategic objective in terms of market expansion, developing products and managing risk would have a higher ambition to gain opportunity out of risk tolerance. Moreover, business market dynamics characterized by rapid technology and market dynamic need a high-risk tolerance investor to adapt to market changes and competition. The SERF recognize the most risk efficient alternative of production and market demand level for a range of risk preferences by ranking alternatives in terms of (CE) figures. financial sustainability for different product unit cost and marketing parameters performed to evaluate risk efferent alternative option for a range of risk preference for all absolute risk aversion coefficient (ARAC).
SIMETAR program calculated certainty equivalent value and constructed graphs to rank net profit of different production and market demand scenarios and unit cost of production level across the specified range of ARAC values. Across two or several alternatives, a higher CE, with the same level of ARAC is considered as the best risk management alternative, Figure No (6).
Company-specific risk premium is distinct from other risk premiums, such as the market risk premium. The market risk analysis showed that production and market demand Certainty Equivalent (CE) value decline with production volume increase from 6,557 to 7,650 tons and increasing frozen whole chicken volume by 269 tons and frozen parts products by 405 tons, Table No (6). The new marketing plan for increasing market share of fresh products by 419 tons and frozen products by 674 tons provide the Company extra return earning over current risk free operation and market risk premium of RO 120,181, Whereas, uncertain market conditions return compared to current risk free plan provides equity risk premium of RO 131,875 which represents the additional return investors expect to earn for bearing the systematic risks associated with the overall market, Figure No (6). Market risk premium is a difference between high risk market plan characterized by potential substantial returns paired with significant volatility and low-risk market plan with stability lower returns. This comparative analysis explores these differences to aid investors in choosing the best path for their financial goals. By accounting for the unique risks associated with a specific company market plan, investors can better estimate the value of the company's market shares and make more informed decisions about their investments.
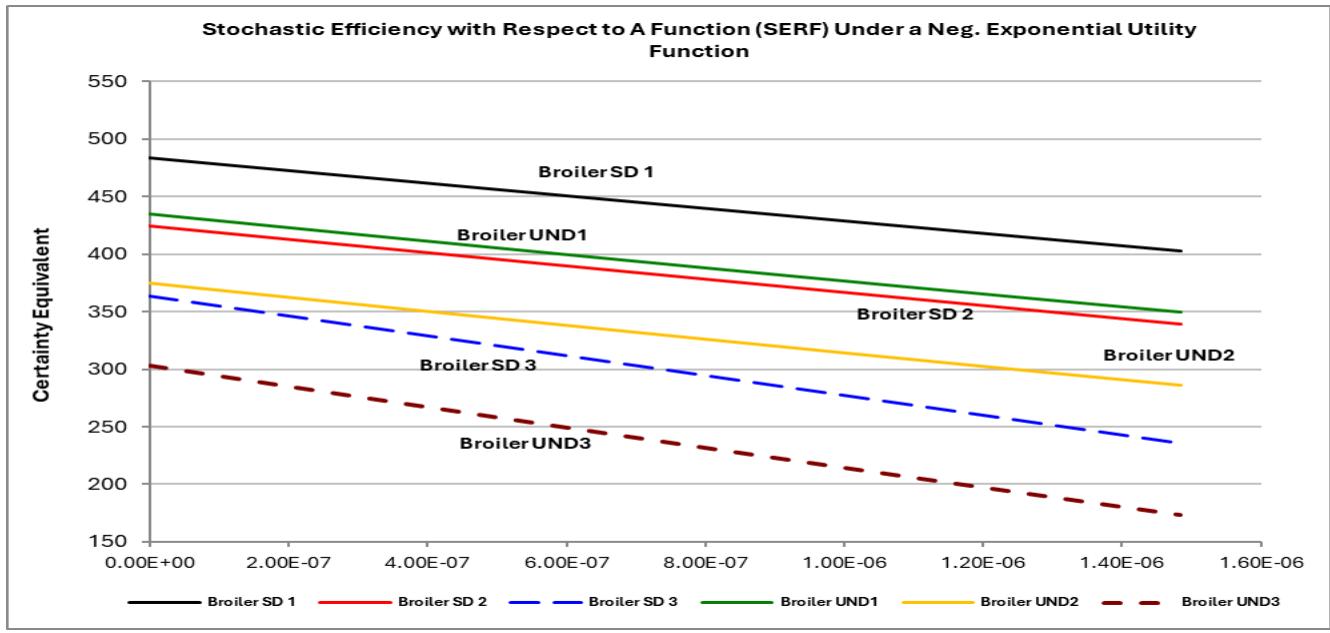 Figure 6: Stochastic Efficiency with Respect to a Function (SERF) and Certainty Equivalent for all ARAC
However, the new risk management policy could not mitigate fresh products operation and marketing risk. High competition of cheap import of frozen broiler products needs government support policy and small whole chicken size problem needs operation team to control flock uniformity to support product market share and sustainable growth policy. The study measure market plan in terms of volume and product mix for all risk averse alternative to test products market volatility risk for all absolute risk aversion coefficient (ARAC). The risk aversion coefficient (ARAC) ranged from 0.00000 which represents risk neutral to 0.00000148 which present strongly risk averse level. The sale revenue reduction by $17\%$ discount rate given to customers lower CE value for all (ARAC) and are not risk averse alternatives compared to potential uncertain alternatives. The market risk tolerance depends on Management willingness to lose return in exchange for greater potential uncertain returns and their financial ability to pay for risks. Operation team need to control unit costs of parts and fresh products to mitigate risk at stress situation and evolve fresh products market segmentation policy and target high income consumers to reduce fresh products expiry cost. Cost of RO 0.209 per one kg is offsetting cost of business difficulty by developing business in other directions.
The high value of CE at the same level of ARAC indicates a preferred alternative. Absolute risk aversion coefficient (ARAC) values ranging from 0.00000 to 0.00000148 were used in the (SERF) analysis to calculate CE values for each of the product marketing variables, sale revenue level and broiler product cost level. Table (6) indicates that scenario (1) for uncertain potential future profit models (Broiler SD1, SD2, SD3) whereas scenario (2) for current risk free cash and profit models (Broiler UND1, UND2, UND3). Six models were calculated under different levels of risk averse coefficient and presented in Figure (6). The multiple simulation analysis also shows an increasing farm's production volume for scenario (1) and (2) will increase business loss and risk premium value for all ARAC.
Table 6: Ranking Net Profit's Certainty Equivalent and Risk Premium for all Absolute Risk Aversion Coefficient
<table><tr><td rowspan="2">Variables</td><td rowspan="2">No.</td><td colspan="3">CE</td><td colspan="3">Risk Premium (Production Scenarios)</td></tr><tr><td>Neutral (0.00000)</td><td>Moderate (0.0000074)</td><td>Strong (0.00000148)</td><td>Neutral (0.00000)</td><td>Moderate (0.00000074)</td><td>Strong (0.00000148)</td></tr><tr><td rowspan="2">Broiler SD1</td><td>1</td><td>483,416</td><td>442,853</td><td>402,787</td><td>-</td><td>-</td><td>-</td></tr><tr><td>Option (1)</td><td></td><td></td><td></td><td></td><td></td><td></td></tr><tr><td rowspan="2">Broiler UND1</td><td>2</td><td>435,160</td><td>391,760</td><td>350,077</td><td>48,256</td><td>51,093</td><td>52,710</td></tr><tr><td>Option (2)</td><td></td><td></td><td></td><td></td><td></td><td></td></tr><tr><td rowspan="2">Broiler SD2</td><td>3</td><td>424,381</td><td>381,798</td><td>339,636</td><td>-</td><td>-</td><td>-</td></tr><tr><td>Option (1)</td><td></td><td></td><td></td><td></td><td></td><td></td></tr><tr><td rowspan="2">Broiler UND2</td><td>4</td><td>375,107</td><td>329,834</td><td>286,339</td><td>49,274</td><td>51,964</td><td>53,297</td></tr><tr><td>Option (2)</td><td></td><td></td><td></td><td></td><td></td><td></td></tr><tr><td rowspan="2">Broiler SD3</td><td>5</td><td>363,235</td><td>299,474</td><td>235,785</td><td>-</td><td>-</td><td>-</td></tr><tr><td>Option (1)</td><td></td><td></td><td></td><td></td><td></td><td></td></tr><tr><td rowspan="2">Broiler UND3</td><td>6</td><td>303,283</td><td>236,899</td><td>173,417</td><td>59,952</td><td>62,575</td><td>62,368</td></tr><tr><td>Option (2)</td><td></td><td></td><td></td><td></td><td></td><td></td></tr></table>
The net profit risk premiums were calculated for each production level (Broiler SD1, Broiler SD2 and Broiler SD3) by subtracting CE values of risk free cash flow model (Broiler UND1) from the highest CE (Broiler SD1) potential uncertain value for each production level at any given ARAC values. Risk premium is a measure of excess return that is required by decision makers to compensate for being subjected to uncertain marketing and operation risk. The analysis showed broiler market risk premium increased with uncertain market parameters and market instabilities at all ARAC values for all models. The CE value and market risk premium for each model is summarized at table (6).
The study measure risk aversion for three levels of absolute risk aversion coefficient (ARAC). At risk neutral level, the investor is willing to pay RO 48.258 K to avoid market risk within the production level of Broiler SD1. The market risk tolerance is amount of CE investors can tolerate of a production return between RO (483,416- 435,160). The risk premium represents payment to investors for tolerating the extra risk in given investment over risk free operation and marketing level (Broiler UND1). Risk premium of RO 49,274 is an amount that investment willing to pay to avoid market risk for the production level of model Broiler SD2. The market risk tolerance is amount of CE Mangment can tolerate of a production level return between RO (424,381- 375,107). RO 59,952 Amount willing to pay to avoid market risk production level of model Broiler SD3. The market risk tolerance is amount of CE Mangment can tolerate of a production level return between RO (363,235- 303,283)
Fresh broiler products have a short shelf-life during of 7 days and are sensitive to hygiene and long tribe duration to UAE and considered as high risk broiler products. The investor is ready to pay more risk attention to a possible better unknown return. The frozen broiler products have long shelf-life duration of about one year and are recognized as low risk broiler products for investment seeking conservative investment with granted return.
## IV. CONCLUSIONS
This study presents an evaluation of three broiler production level and products mix under different marketing uncertain parameters and marketing strategies. Simulation risk analyses were performed to test operation performance sustainability of alternative marketing demand, sale revenue, unit cost of products and salable meat production level parameters. The analysis identifies factors that affect broiler farming continuity and measure market risk premium to control risk and avoid opportunity loss in future. The study stimulated net profit for different alternative product mix and marketing strategy by using @Risk 8.2 program to investigate operation and marketing risk assessment. Stochastic Efficiency with Respect to a Function (SERF) constructed and used to estimate Certainty Equivalent (CE) and market risk premium (RP) values. The market risk premium represents the additional return investors expect to earn for bearing the systematic risks associated with the overall market uncertainty and volatility.
Descriptive analysis showed Broiler SD1 model with 6,557 tons production volume achieved net profit mean of RO 460,219 and $8.8\%$ profit breakeven point. Option No (2) Broiler SD2 generated RO 400,964 net profit and $13.3\%$ profit breakeven point and option No (3) Broiler SD3 model recorded the lowest net profit RO 334,557 and breakeven $22.7\%$. The net profits probability distribution functions (PDF) are performed to evaluate risk volatility and economic sustainability. The analysis showed that option (1) reduces performance variability and focuses on effective use of resources and reduces waste and undesirable chicken meat products. The Value at Risk (VaR) test introduced as an objective quantitative measure of downside risk and recorded a loss of RO (100,000) of option (1) compared to RO (364,000) with confidence level $95\%$ and (0.0382) skewness and (2.6019) kurtosis for Option No (3). Poor flock uniformity and discount given to sale small whole chicken product were the main operation problems behind this dilemma.
The sensitivity and tornado analysis showed that unit cost of fresh and frozen parts have a higher impact on target net profit of RO 460K, followed by market demand of whole fresh and whole frozen chicken and frozen parts. The operating team should work out a plan to reduce unit costs and improve flock uniformity through increasing bird size up to the market demand level range 900-1200 grams.
The Boston Consulting Group (BCG) Matrix tool performed to test market performance of alternative production and marketing strategies and identify broiler products market share and products competitiveness marketing strength. The scatter plot quadrant analysis showed fresh products have high market demand shares and profit growth with higher potential for profit growth than market demand shares. On the other hand, frozen products showed low market share and low growth, and the market strategy should work for potential growth to sustain net profit growth and improve financial health. The whole chicken frozen products serve only $15.7\%$ of the total Company market share and might be repositioned to serve niche markets such as hotels, restaurants and catering services (HORECA) channels.
The study constructed Cumulated Distribution Function (CDF) analysis to quantify broiler market demand uncertainty and indicated the range and probabilities of net profit value for six different production volume and marketing alternatives. Net profit of each market strategy developed to measure reflects the relative impact of distributional changes of inputs (market demand production volume) on the change of output distribution (net profit). The study tested sustainability of three broiler production levels and products mix and two scenarios i.e. Baseline Models (Broiler SD1, Broiler SD2, Broiler SD3) against uncertain marketing strategies models (Broiler UND1, Broiler UND2, Broiler UND3) and fined Baseline model (Broiler SD1) is the most profitable and sustainable alternative. Due to CDF lines crossing in the graph, we could not be able to rank cost and market alternatives in accord with their economic sustainability by using first and second stochastic dominance with respect function (SDRF). Accordingly, stochastic efficiency with respect to function (SERF) has been used for better ranking alternatives. The analysis showed Baseline models i.e. (Broiler SD1, SD2, SD3) are better alternatives if organization could control technical and marketing uncertain future conditions and challenges.
Broiler business risk efficiency is performed by comparing Certainty Equivalent (CE) of uncertain potential future return of broiler farm performance with current farming practices and marketing demand volatility. Three different production groups examined with different product sale discounted given to customers to sell whole chicken small size. Net profit alternatives options for three different production levels and market demand compared by using multiple simulation model and construction SERF and CE analysis. The CE guarantees low net profit that organization decision makers would accept now i.e. RO 435,160 rather than taking risk on a higher uncertain net profit i.e. RO 483,416 in the future. Broiler business risk tolerance level influenced by financial position such as revenue, expenses, debit obligation and cash reserves. A company with strong financial positions and sufficient cash may have a higher risk tolerance to pursue growth opportunities.
According to CE value and market risk premium measures, the Broiler (SD1) Model group are the best production level and products mix and risk efficient alternative for all ARAC followed by two other Broiler (SD2) and Broiler (SD3) production level and products mix. Market demand uncertainty and discounts given for small-size whole-chicken products were the main uncertain parameters differentiated between the two group models, i.e. Broiler SD1 and Broiler UND1. The market risk premium for alternative production level of 6,557 tons is RO 48,256 and for production level of 6,800 tons is RO 49,275 and production of 7,650 tons is RO 59,952. CE values were obtained for risk neutral, moderate and strong absolute risk aversion coefficient (ARAC). The marketing team should monitor market volatility and corporate product demand to avoid sale revenue reduction caused by the situation of market uncertainties. The operation team should maintain technicality and good flock uniformity and produce marketable bird size between 900 - 1,200 Grams for whole chicken products as per market prevenances. Risk premium of RO 48,256 is a risk for poor flock uniformity and market challenges face the organization to sale small size birds. The cost of RO 0.209 per one kg is compensation between current broiler farming practices and uncertain future unseen risk and cost of offsetting broiler business difficulty by developing business in other informed directions.
The marketing team should monitor and observe sale revenue and control contract expenses such as transportation cost, supermarket shelf rent cost, products expiry returns cost and review cash flow to prevent unexpected overrun and negative financial impacts. The production team should concentrate on and monitor unit cost saving plan and improve flock uniformity to extend market demand and achieve business sustainability and improve growth rate. Moreover, controlling market share enables the company to measure its competitiveness and its ability to attract and retain customers compared to its competitors. The Management and operation team should work closely to reduce cost of production and optimize product mix, whereas the marketing team should understand product market share and growth to mitigate risk as shown by study result. Marketing promotion and market risk premium should also be monitored and calculated carefully to control risk and obtain higher gain under high dynamic market challenges.
Market simulation analysis help Company to identify their market standing, track their performance over time, and benchmark themselves against competitors. Study results and information helps the Company gauge their market penetration and identify opportunities for growth and areas that require improvement. More study are needed to analyzing market demand to identify market trends, anticipate customer needs, and tailor their offerings to meet consumer demands effectively. Study results and recommendation help businesses make informed decisions regarding production levels, pricing strategies, marketing campaigns, and resource allocation. Increasing products market share may not necessarily increase market demand as significant discount and lowering frozen price may reduce total market demand if customers perceive the product as less valuable and blow market standard. The study investigated this question by using simulation analysis and refiled lowering frozen price did not increase market demand but liquidated whole chicken frozen stock only.
Conflict of Interest
The author declared no conflict of interest.
Not applicable
### ACKNOWLEDGMENTS
This research was not supported by any organization.
Availability of Supporting Data
All data are available from local broiler farm data based, monthly and quarter company report are available.
Generating HTML Viewer...
References
32 Cites in Article
Fidelis Akanga,Widin Sha',N Ven,Ven Tauringana (2020). An empirical investigation into the risk management strategies of MFIs in Cameroon.
S Albright,W Winston (2019). Business Analytics.
Armijal,W Marlina,R Hadiguna (2023). The evaluation of supply chain risk management on smallholder layer farms.
I Ascough,J,E Fathelrahman,B Vandenberg,T Green,D (2009). Economic risk analysis of agricultural tillage systems using the SMART stochastic efficiency software package.
Jean-Paul Chavas (2004). Mean-Variance Analysis.
Danilo Simões,João Ribeiro,Pedro Gouveia,Josiane Santos (2014). ECONOMICAL AND FINANCIAL ANALYSIS OF AVIARIES FOR THE INTEGRATION OF BROILERS UNDER CONDITIONS OF RISK.
M Eihab,James Fathelrahman,I Ascough,Dana Hoag,Robert Malone,Philip Heilman,Lori Wiles,Ramesh Kanwar (2011). Continuum of Risk Analysis Methods to Assess Tillage System Sustainability at the Experimental Plot Level.
Gajanan K Nagre,M Mukund,Kadam,Darshana B Bhaisare,Archana R Patil,P Yogesh,Gadekar,S Kishor,Rathod (2024). Higher slaughter weight affects broiler meat quality and bird welfare, Higher slaughter weight affects broiler meat quality and bird welfare.
Gary Machlis,Eugene Rosa (1990). Desired Risk: Broadening the Social Amplification of Risk Framework.
Gregory Regier,Timothy Dalton,Jeffery Williams (2012). Impact of Genetically Modified Maize on Smallholder Risk in South Africa.
Guro Vasdal,Erik,Georg Granquist,Eystein Skjerve,Ingrid De,Jong,Charlotte Berg,Virginie Michel,Randi Moe (2019). Associations between carcass weight uniformity and production measures on farm and at slaughter in commercial broiler flocks.
J Hardaker,James Richardson,Gudbrand Lien,Keith Schumann (2004). Stochastic efficiency analysis with risk aversion bounds: a simplified approach.
J Hardaker,James Richardson,Gudbrand Lien,Keith Schumann (2004). Stochastic efficiency analysis with risk aversion bounds: a simplified approach.
Irene Tzouramani,Alexandra Sintori,Angelos Liontakis,Pavlos Karanikolas,George Alexopoulos (2011). An assessment of the economic performance of organic dairy sheep farming in Greece.
Mohammad Khakbazan,Hushton Block,John Huang,Jeff Colyn,Vern Baron,John Basarab,Changxi Li,Chinyere Ekine-Dzivenu (2022). Effects of Silage-Based Diets and Cattle Efficiency Type on Performance, Profitability, and Predicted CH4 Emission of Backgrounding Steers.
Kheiry Hassan,M Ishag (2019). Broiler Production Systems Risk Management Sustainability and Feed Subsidy Policy Analysis.
Kheiry Hassan,M Ishag (2020). Economics of Dairy Cow Feed Management Strategies and Policy Analysis.
Kheiry Hassan,M Ishag (2024). Animal Feed Business Risk Assessment Quantification COVID-19 and Supply Chains Disruptions Losses.
D Lehman,H Groenendaal (2020). Practical Spreadsheet Modeling Using @Risk.
Lien Hardaker,J Flaten,O (2007). Risk and economic sustainability of crop farming systems.
N Li,Z Ren,D Li,L Zeng (2019). Review: Automated techniques for monitoring the behaviour and welfare of broilers and laying hens: towards the goal of precision livestock farming.
Roberta Lima,Rubens Sampaio (2017). Uncertainty Quantification and Cumulative Distribution Function: How are they Related?.
Henrique Luiz,José Rodrigues-Da-Silva,António Crispim (2014). The Project Risk Management Process, a Preliminary Study.
J May,B Lott (2000). The effect of environmental temperature on growth and feed conversion of broilers to 21 days of age.
J May,B Lott,J Simmons (1998). The effect of environmental temperature and body weight on growth rate and feed:gain of male broilers.
Jack Meyer,James Richardson,Keith Schumann (2009). Stochastic efficiency analysis with risk aversion bounds: a correction.
Mohammad Khakbazan,Richard Carew,Shannon Scott,Paul Chiang,Hushton Block,Clayton Robins,Obioha Durunna,John Huang (2014). Economic analysis and stochastic simulation of alternative beef calving and feeding systems in western Canada.
Niloufar Mostaghim,Mohammad Gholamian,Mahsa Arabi (2024). Designing a resilient-sustainable integrated broiler supply chain network using multiple sourcing and backup facility strategies dealing with uncertainties in a disruptive network: A real case of a chicken meat network.
Yu Yh (2008). Investigation of Electron Transport Through Alkanedithoil of Functionalized Zn3 P2 Nanowires for Hydrogen Production.
Solomon Sosheel,Ryan Godfrey,Thomas Lee (2021). Risk Analysis of Australia's Victorian Dairy Farms Using Multivariate Copulae.
Yangxuan Liu,Michael Langemeier,Ian Small,Laura Joseph,William Fry (2017). Risk Management Strategies using Precision Agriculture Technology to Manage Potato Late Blight.
Explore published articles in an immersive Augmented Reality environment. Our platform converts research papers into interactive 3D books, allowing readers to view and interact with content using AR and VR compatible devices.
Your published article is automatically converted into a realistic 3D book. Flip through pages and read research papers in a more engaging and interactive format.
The broiler farming business faces challenges due to many reasons such as technical innovation, finance uncertain parameters and dynamic marketing complex. Broiler farms at Sultanate of Oman has been performing with challenge and many constrains, including poor farming practices, climate stress and variability, feed grain price increase. The risk assessment of broiler business indicated high impact of products unit cost of productions, market dynamic risk and financial sustainability. Market competition and cheap frozen chicken products imported from outside significantly affect the local broiler market risk and uncertainty and marketing strategies. The study applied stochastic budget Monte Carlo Simulation approach to calculate market risk primum and reform market strategies and align them with acceptable risk tolerance comfort level of the stakeholders’ perceptions. Three production levels, products mix models, were tested under two different scenarios to measure market risk and market strategies.
Our website is actively being updated, and changes may occur frequently. Please clear your browser cache if needed. For feedback or error reporting, please email [email protected]
Thank you for connecting with us. We will respond to you shortly.