The soil samples which have been used to determine the CEC of the Greek swelling soil, were collected from 17 districts all over the country, and the ammonium acetate method (Schofield, 1949) was used because is a commonly used method by Chemists. Fifty-six clay soil samples were tested using the material passing the US sieve No 40. Each sample was washed three times with ammonium solution to saturate the exchange sites and the exchange ions in milliequivalents per 100 gr of dry soil were determined in the leached extract by a corne flame photometer. The soil pH determination was also measured according to BS 1377: Part 3: 1990 9: The results of the measurement from 300 soil samples of the Greek territory are reported. Additionally, one attempt was made to correlate the obtained CEC values with Liquid limit, Plasticity index and, montmorillonite percent.
## I. CATION EXCHANGE PROPERTIES
Clay minerals and organic matter have negatively charged sites on their surfaces which adsorb and hold positively charged ions (cations) by electrostatic force. The number of negatively charged sites determines how many cations the soil can attract and is referred to as the soil's cation exchange capacity or CEC.
The primary ions associated with CEC in soils are the exchangeable cations calcium $(\mathrm{Ca}^{2+})$, magnesium $(\mathrm{Mg}^{2+})$, sodium $(\mathrm{Na}^{+})$ and potassium $(\mathrm{K}^{+})$. A soil's CEC is critical for supplying plant nutrients because many of these cations are also essential for plant growth. That is why, in general terms, soils with high CEC are considered to be more fertile or potentially more fertile.
The conditions essential to ion exchange were named by Kelley (1955) as physical accessibility of the ion and strength of the force by which the ion is held to the lattice. The crystal structure of base exchange materials has been summarized by Kelley (1955) as follows: Clay minerals are platy and characterized by a layer lattice structure. Layers are composed of planes or silicon ions in which each silicon ion is situated at the center of a tetrahedron formed by four oxygen ions, and planes of aluminum, iron, or magnesium ions surrounded by six oxygen or OH ions arranged in the form of an octahedron. Pyrophyllite, according to Kelley, is electrically neutral and unable to attractions except by weak forces. In the case of muscovite, potassium ions hold the layers together and are prevented from entering into an exchangeable form. In montmorillonite the (001) planes spacings are a function of water content and quickly enter to exchangeable condition.
## II. PREVIUS WORK
From the international bibliography the cation exchange capacity reveals one soil with strong swelling potential. In the tables below we can see the variety of basic clay minerals.
Table 1: Gives one average ingredients of exchangeable cation of a clay soil (Jackson, 1962).
Table 2: Gives CEC for clay mineral after Thomson, 1957
Table 3: Revels the variation of exchange capacity for clay. (Woodward - Clyde and Associates, 1967)
Table 4: Reports CEC value for common clay minerals (after Mitchell, J., 2005)
Table 5: List of cation exchange capacities for clay, (after Grimm, 1955).
Table 6: List of cation exchange capacities by Jennings and Kinkner (1990).
Table 1: Average percent of cations in typical clay soil. (Jackson, 1962).
<table><tr><td>Typical cations of o clay</td><td>Me /100 gr of soil</td></tr><tr><td>Ca</td><td>10-15</td></tr><tr><td>Mg</td><td>3-5</td></tr><tr><td>Mn</td><td>0,02 - -</td></tr><tr><td>K</td><td>0,03 – 0,25</td></tr><tr><td>Na</td><td>0,2 – i×vη</td></tr><tr><td>H</td><td>1,5 – 5</td></tr></table>
Table 2: CEC of clay minerals and soil organics. (Thomson, 1957).
<table><tr><td>Type of Mineral</td><td colspan="2">(CEC), me/100gr.</td></tr><tr><td>Organic pumice</td><td>250- 450</td><td>(350)</td></tr><tr><td>vermiculite</td><td>150- 170</td><td>(164)</td></tr><tr><td>Montmorillonite group</td><td>90- 130</td><td>(110)</td></tr><tr><td>Chlorite group</td><td>3- 7</td><td>(5)</td></tr><tr><td>Kaolinite group</td><td>3- 7</td><td>(5)</td></tr><tr><td>Mica group</td><td>3- 7</td><td>(5)</td></tr></table>
On table 3 we can see that montmorillonite is ten times more drastic than kaolinite. The season for this is the large specific area of the crystal surface and the negative charge in the surface of crystals.
Table 3: Variation of exchange capacity for clay. (Woodward - Clyde and Associates, 1967).
<table><tr><td></td><td>Kaolinite</td><td>Illite</td><td>Montmorillonite</td></tr><tr><td>Thickness of particles</td><td>0.5 – 2 μm</td><td>0.003 - 01 μm</td><td>μικρότερο 9.5 Å</td></tr><tr><td>Diameter of particles</td><td>0.5 – 4 μm</td><td>0.5 – 10 μm</td><td>0.5 – 10 μm</td></tr><tr><td>Specific area m2/ gram</td><td>10 - 20</td><td>65 – 100</td><td>50 – 840</td></tr><tr><td>Cation exchange Capacity meq/100 gr</td><td>3 -15</td><td>10- 40</td><td>70 – 100</td></tr></table>
Table 4: CEC value for common clay minerals (after Mitchell, J., 2005)
<table><tr><td>Clay Mineral</td><td>Kaolinite</td><td>Halloysite</td><td>Illite</td><td>Vermiculite</td><td>Smectite</td><td>Chlorite</td></tr><tr><td>meq/100g</td><td>5</td><td>12</td><td>25</td><td>150</td><td>85</td><td>4</td></tr></table>
Table 5: List of cation exchange capacities for clay, (after Grimm, 1955).
<table><tr><td>Clay mineral</td><td>C.E.C. meq/100g</td></tr><tr><td>Kaolinite</td><td>3.0—to -15.0</td></tr><tr><td>Hallusite</td><td>6.0—to—10.0</td></tr><tr><td>Illite</td><td>20.0—to—40.0</td></tr><tr><td>Attapulgite</td><td>25.0—to—30.0</td></tr><tr><td>montmorillonite</td><td>60.0—to—100.0</td></tr></table>
Table 6: Cation exchange capacities by Jennings and Kinkner, (1990).
<table><tr><td>Parent material</td><td>C.E.C. meq/100g</td></tr><tr><td>Talc</td><td>1.0</td></tr><tr><td>Albite</td><td>2.0</td></tr><tr><td>Anorthite</td><td>2.0</td></tr><tr><td>Biotite</td><td>3.0</td></tr><tr><td>Pyrophyllite</td><td>4.0</td></tr><tr><td>Orthoclase</td><td>5.0</td></tr><tr><td>Chlorites</td><td>6.0</td></tr><tr><td>Muscovite</td><td>10.0</td></tr><tr><td>Bentonite</td><td>126.0</td></tr></table>
Additionally, Weaver and Pollard (1973) propose that values CEC fluctuated between CEC = 10 and CEC = 15 meq/100 gr, reveal one soil with strong swelling potential.
Avery and Bullock (1977), reinforce the above explaining that the attraction of water molecules from the surface of clay particles is affected by cation exchange capacity (CEC) of clay and finally exchange them with cations dissolved in water.
Morin and Parry (1971) reports values CEC for Ethiopian soils between CEC =42 and CEC =95 meq, and in some other areas of the same country CEC values fluctuate from CEC =22 up to CEC =90 meq. More specific separated clay soil of Ethiopia in four categories, related to geomorphology and origin of clay. So, they reported,
- Black clay CEC = 42 - 95 meq.
- Red clay CEC = 42 - 77 meq.
- Lacustrine clay CEC = 22 - 90 meq.
- Alluvial clay CEC = 42 - 95 meq.
Raymahashay and Sahu (1980) report values for CEC
- For kaolinite C.E.C =24 meq,
- For illite C.E.C =28 meq
- For montmorillonite C.E.C =70 meq.
Driscoll (1983), reports that measure values CEC for the British clay soil varied between CEC =20 meq. up to CEC =60 meq/100gr.
Attewell Kαi Taylor (1986) gave CEC values for the British swelling soils varying between $\mathrm{CEC} = 30$ meq. up to $\mathrm{CEC} = 56$ meq.
Grilly (1990) after four years, also reports similar CEC values for the British swelling soils.
Karunaratne et.al. (2001), publish for Singapore clay soil mixtures with bentonite CEC =88 meq/ 100 gr. and for mixtures with kaolinite CEC =5 meq/ 100 gr.
Mitchell, J. (2005) measured the following values for basic clay minerals.
- Kaolinite $= 5$ meq
- Halloysite = 12 meq
- Illite = 25 meq
- Vermiculite = 150 meq
- Smectite $= 85$ meq
- Chlorite = 4 meq
From the Greek bibliography are reported results similar to previous work. Mimidis and Peraki (1987) reports for Greek territory that cation exchange capacity fluctuates between CEC =30 up to CEC =85 meq.
From other research (Christodoulias, 2018), is reported similar cation exchange capacity CEC for several tested areas (Table 8), but the highest value in Greece was registered in Thiva city of Viotia province and is CEC =83 meq/ 100 grms of soil.
## III. IONIC AND CATIONIC ALTERNATORS
The discovery of cation exchange capacity of clay soils is benefit of the research of Thomson (1850) and Way (1852), after the observation that when one solution of ammonium salt passes through one soil column, all ammonium ions were captured by the soil and the calcium ions are released from the soil.
Natural alternators are mixtures of ions and cations in the soil similar to inorganic and organic compounds and similar to clay minerals as vermiculite, glauconite, montmorillonite.
Cation exchange capacity is defined as a soil's total quantity of negative surface charges, (Hendricks, 1945), It is measured commonly in commercial soil testing labs by summing cations (positively charged ions that are attracted to the negative surface charges in soil). Exchangeable cations include base cations, calcium $(\mathrm{Ca}^{2+})$, magnesium $(\mathrm{Mg}^{2+})$, potassium $(\mathrm{K}^{+})$ and sodium $(\mathrm{Na}^{+})$, as well as acid cations such as hydrogen $(\mathrm{H}^{+})$, aluminum $(\mathrm{Al}^{3+})$ and ammonium $(\mathrm{NH}_{4}^{+})$.
Grim (1953, 1955), Mitra and Rajagopalan (1952) reports that free negative forces in the crystal lattice of clay mineral are due to the following:
- $\alpha$ ) isomorphous substitution of lattice octahedral with other ions having less strength. The result of this are free negative forces on the surface of crystals, but these free ions are neutralized by new free ions. This is a normal procedure for group of montmorillonite and mica. b) isomorphous substitution of Si ions on the tetrahedral from cations with small strength $\alpha \gamma \nu \lambda \iota \omega$. Ninety percent of exchange capacity of montmorillonite and vermiculite are due to isomorphous substitution.
- c) broken crystal surfaces parallel to the C axis of total crystal lattice of clay minerals. The broken bonds of tetrahedral and octahedral leads to development of unsaturated electric forces, which are neutralized after absorption of new cations.
- d) to the agility of free H ions of circumference hydroxyls of the crystal lattice.
Prakash_Keshavamurthy (2016) reports that free negative forces in the crystal lattice of clay mineral are due to the following:
- Very weak van der Waals' forces in between the adjacent unit cells of the mineral.
- Appreciable isomorphous substitution during the clay mineral formation, leading to very high negative surface charges.
- Very high cation exchange capacity (i.e., 80-150 meq/100 g)
- Large specific surface (i.e., $400 - 900\mathrm{m}^2 /\mathrm{g}$
Schofield (1949), Rich and Thomas (1960) mentioned that one part of ionic exchange capacity depends on the influence of PH in the type of clay mineral. High values of exchange capacity are most common in areas having PH = 10.
Kelley (1948), Schofield (1949) and Mitra with Rajagopalan (1952), reports that free negative forces derive from acid ions of $\mathsf{H}^+$, which are the result of rupture silicon groups (SiOH) of clay particles.
According to Kelley (1955), the conditions essential to ion exchange were named as physical accessibility of the ion and strength of the force by which the ion is held to the lattice. This is electrically neutral and unable to attractions except by weak forces. In the case of muscovite, potassium ions hold the layers together and are prevented from entering into an exchangeable substitution.
## IV. CATION EXCHANGE CAPACITY (CEC)
The cation exchange capacity or the CEC level is the measure of isomorphic substitutions that occur with the clay minerals. The isomorphic substitutions are due to tetrahedral and octahedral sheets containing cations instead of an idealize structure (i.e., aluminum in the places of silicon, magnesium instead of aluminum, etc.). When the isomorphic substitution occurs, multiple cations are replaced with other cations of other valances within the structure to maintain equilibrium within the clay structure. (Cornel Univ., 2007). The ability to measure the cation replacement is computed as milliequivalents (meq) per $100\mathrm{g}$ of clay. The milliequivalents are determined by knowing the atomic weight, and the weight and valance of the element. The CEC value is a guide to estimate the predominant clay mineral. In addition, the CEC shows how stable the clay mineral is to isomorphic substitution (Cornel University 2007). When the measurable CEC increases the isomorphic substitution within the clay mineral also increases, Table 5 (after Grimm, 1955), outlines CEC values for common clay minerals. As one can see, kaolinite has the lowest CEC, while vermiculite has the highest CEC. Generally the shrink-swell soils have a relatively high CEC which range from 35-60 meq/100gr. The amount and type of clay, especially montmorillonite (smectite group) content is the determining factor. Schollenberger and, Simon (1945), and Peech (1945) measured first the CEC of soils. Improvements were made by Chapman (1965).
The cation exchange capacity (CEC) of a soil is usually defined by the amount of a cation (such as NH) that a soil can hold when a buffered or unbuffered salt solution is leached through the soil. The most widely used salt is ammonium acetate buffered at pH 7, but BaCl 2 buffered at pH 8.2 is also used.1 M potassium chloride and 0.01 M silver thiourea are examples of unbuffered solutions used. Results obtained by these methods may vary considerably, depending on the variable charge characteristics of the soil. The variation in values between methods is related to the pH and ionic strength of the reagents used. What CEC actually measures is the soil's ability to hold cations by electrical attraction. Cations are positively charged elements, the positive charge indicated by a + sign after the element symbol. The number of + signs indicate the amount of charge the element possesses. The five most abundant exchangeable cations in the soil are calcium $(\mathrm{Ca}^{+ + })$, magnesium $(\mathrm{Mg}^{+ + })$, potassium $(\mathrm{K}^{+})$, sodium $(\mathrm{Na}^{+})$ and aluminium $(\mathrm{Al}^{+ + + })$, ammonium (NH4), hydrogen (H), (Cornel University,2007). Cations are held by negatively charged particles of clay and humus called colloids. Colloids consist of thin, flat plates, and for their size have a comparatively large surface area. For this reason, they are capable of holding enormous quantities of cations. They act as a storehouse of nutrients for plant roots. The stronger the colloid's negative charge, the greater its capacity to hold and exchange cations, hence the term cation exchange capacity (CEC).
The precise definition of cation exchange capacity (CEC) of the soil samples, was measured with the method of ammonium acetate (Schollenberger, & Simon, 1945). For the final reading, the determination of exchangeable ions was measured with a corn flame photometer. Finally, fifty-two soil samples were tested, collected out of 17 districts, one from each area, and tested for CEC.
### a) Cation Exchange Capacity (CEC)
## i. Ammonium acetate method CH3COONH4
In the ammonium-saturation method for CEC, soil is leached with an excess of neutral, in ammonium acetate solution to remove the exchangeable cations and to saturate the exchange material with ammonium. After removal of the excess of ammonium present in the soil as the acetate, the exchangeable ammonium is determined.
The precise definition of cation exchange capacity (CEC) of the soil samples, was measured with the method of ammonium acetate (Schollenberger, & Simon, 1945). The soil samples which have been used to determine the C.E.C. of the Greek swelling soil, were collected from 17 districts and the ammonium acetate method was used because is a commonly used method by Chemists. For this reason, fifty-two clay soil samples were tested using the material passing the US sieve No 40. Each sample was washed three times with ammonium solution to saturate the exchange sites. For the final reading, the determination of exchangeable ions in milliequivalents per $100\mathrm{gr}$ of dry soil were estimated by a corne flame photometer.
### Materials
(1) Centrifugation device 2500r/min (2) 10 centrifugation tubes of $50 \mathrm{ml}$, diameter $2 \mathrm{~cm}$, length $10 \mathrm{~cm}$ sealing with glass tap. (3) Vibrating plate table (4) 10 volumetric glass tubes of $100~\mathrm{cc}$. (5) Glass funnel. (6) Ammonium acetate 1N, or 770 gr. in 10 lit. water. (7) PH of solution should be equal to 7.0, otherwise we add drops of acid or ammonia aaqueous.
### b) Soil sample saturation with NH4
In each centrifugation tube of 50cc are placed 5,1 grams of dry soil, passing from US sieve No 40. After adding 33cc ammonium acetate (CH3COONH4), tube is sealed, and placed in the stirring device for 5 minutes. Afterwards the top sealing of each tube is taking away, and each tube is placed in the centrifugation device and rotates in 2500 terns/minute for 10 minutes.
The work of adding CH3COONH4, shaking, centrifuging, pouring, is repeated three times to achieve soil saturation with ammonium, (Figure.1.). After each centrifugation the ammonium extract is discarded. It is then repeated by adding $100\%$ alcohol, shaking, centrifugation, transfusion, in order to flush the soil molecules from the excess ammonia salts.
 Figure 1: Representation of cation exchange after accede acetate mixing.
Finally, each centrifuge tube is filled with 33cc sodium acetate, CH3COONa. It follows shaking, centrifugation, transference, and collection of the extract in a 100-cc volumetric flask and this task is repeated three times.
If the extract is found not to be clear, pour the centrifuge extract into the flask with a glass funnel and a filter. Then the volumetric glass bottle is refiled up to level 100 cc with distilled water, sealed and placed in refrigerator until the existing alternative cations Ca, Mg, Na, are identified by the method of the flame photometer.
### c) Identification of cation exchange with corne flame photometer
Before we start the testing of solutions, is necessary to correct the scale of flame device. For this we immerse the electrode in a jar with standard solution $\mathrm{Na}+$. In the scale of calibration for the flame device, distilled water is equal $=0$. The standard $st = 11$ correspondents $=100$ of the scale. The in between checking steps are standard $= 6$ which corresponds to flame device scale $= 66$ and the standard $= 3$ which corresponds to flame device scale $= 28$. This is the procedure to check the sensitivity of flame corn flame testing device. (Photography 1).
In order to obtain samples and standards of the right concentration for aspiration into the flame, various levels of dilution will often be necessary. Good quality deionized water should normally be used for carrying out these dilutions and it is recommended that the same batch of water should be used for diluting the samples and standards.
Then, we baptize the electrode in every glass cup which contains ammonium extraction which came from tested soil samples. In order to avoid concentration higher than the scale of photometer before each testing all soil ammonium extractions are diluted up to $50\%$ and the rest volume of each glass jar is completed with distilled water.
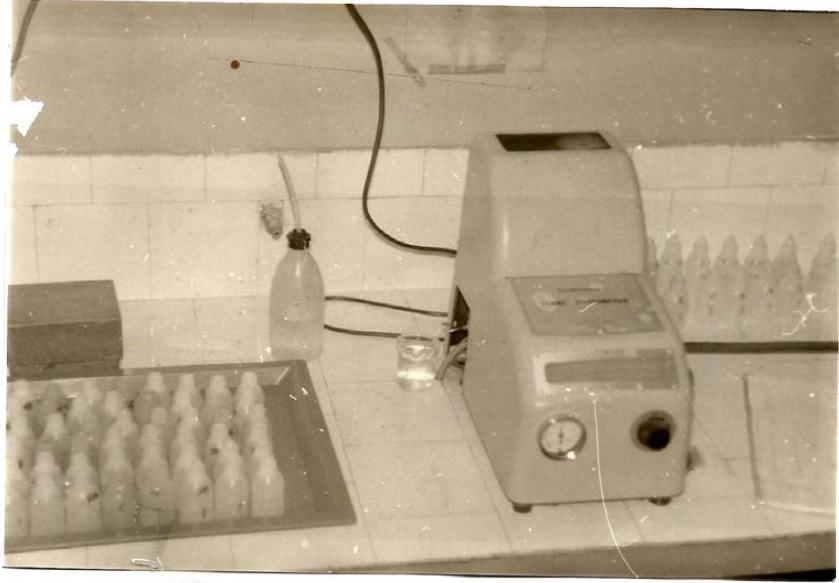 Photo 1, of corne flame flogophometer.
As soon as we complete the measurements, we of photometer and we identify in meq/lit the concertation apply the numerical results on the concentration curve of $\mathsf{Na}+$ cations.
In order to calculate the total cation exchange for every sample we must know
- (a) the concentration of the solution (Cx) and
- $(\beta)$ to make one reduction from 5 grams of weight of each sample up to 100 grams., that is:
$$
\mathrm {X} = 2 0. 0 0 0 \mathrm {c c}
$$
Then follows the reduction of concertation (Cx) of 1000 cc, into 20.000 cc:
Concentration Cx is=: Cx.meq in 1000 cc
X; in 20.000 cc
$$
X = C x 2 0. 0 0 0 / 1 0 0 0 = C x. 2 0
$$
And because the dilution of solution is deca tional, the concentration becomes: Cx X 2X 10.
$$
C.E.C. = C_x \times 2 \times 10 \, (\text{readings of instrument curve}) = C_x \tag{1}
$$
More specifically, the flame photometer readings (in Na + ions) are placed on the concentration curve of the instrument and for each sample the concentration is in meq/100 g of soil.
This result, i.e., the reading of the instrument curve for each sample, is multiplied by formula (1) by 2 and then by 10. Thus, the CEC value is in meq/100 g. of each soil sample. (Table 8). For comparison two extra samples were tested, one of pure industrial bentonite as clay material with a high swelling capacity revealing CEC 72 meq/ 100gr and one of pure industrial kaolinite as a material with a low swelling capacity, revealing CEC 6 meq/ 100gr. (Table 8.). As it was identified, the CEC for the Greek swelling soils varied between 20 meq/ 100gr to 70 meq/ 100gr. One soil sample from Viotia province (Area 8) revealed CEC 70 meq/ 100gr, like that of industrial bentonite.
## V. PH DETERMINATION
The soil pH determination was measured according to BS 1377: Part 3: 1990 9: The results of the measurements for 300 soil samples from the Greek territory are reported on Table 9. For each CEC test, several samples were collected in a distance of $100~\mathrm{cm}$ from the surrounded soil and tested with a $\mathsf{pH}$ meter. As we can see, the recorded values are varying between $\mathsf{pH} = 7.50$ and 9.46. Sridharan (1999) and QJEG (1990) have reported similar values and said that soil $\mathsf{pH}$ is important for CEC of clay soil because as $\mathsf{pH}$ increases (becomes less acid), the number of negative charges on the colloids increase, thereby increasing CEC. Schofield (1949), Rich and Thomas (1960) and Rich (1962), reported that soils having $\mathsf{pH}$ values higher than 7, have high CEC values. Such soils are suitable for stabilization with lime and cement. Also, Kolias (1965) working for the Road Research Laboratory Transport, (TRRL), reports for UK $\mathsf{pH}$ values higher than 7. After all these, it is obvious that results reported on Table 9 concerning $\mathsf{pH}$ values for Greek clay soils varies between $\mathsf{pH} = 7.50$ and $\mathsf{pH} = 9.46$ and are close to those reported from other countries above.
## VI. THE MINERALOGICAL ANALYSIS OF CLAY FRACTION X-RAY
The crystalline mineralogical components of the clay soils were identified by the powder method of x ray diffraction analysis. The clay samples were tested using a Philips diffractometer, scanning with copper radiation and nickel filter (Cuka), and working with power of $40\mathrm{KV}$ and $20\mathrm{mA}$. Before testing one US No 40 sieve was used to remove the non-clay minerals. The hydrometer method (BS 1377, part 2, para 7.4.) was also used to isolate the silt and clay fraction. The oxygen peroxide method (BS 1377, part 3) was used to purify each sample from organic content. In some clay samples was noticed that the three main clay minerals, montmorillonite, kaolinite, chlorite, were giving not clear peaks. In that case, the suggested by Wilson's (1987) method was used, and the samples were special treated with glycerin and heated up to $120^{\circ}\mathrm{C}$, in order to distinguish the montmorillonitic peak. The mineralogical composition of 25 clay samples (Table 7) was determined by x ray diffraction analyses, one sample of each area, by the method described by Brindley and Brown (1980). The quantitative analyses were obtained by the method described by Bayliss (1986).
## VII. CORRELATION OF CEC, LIQUID LIMIT, PLASTICITY LIMIT AND PERCENT OF MONTMORILLONITE
In order for the reader to understand the importance of calculating the ion exchange capacity of clay (CEC), it was decided for the first time to make a correlation between important mechanical parameters of the clay soil. It should be emphasized that these laboratory tests are, on the one hand, expensive and on the other hand very specific, which are not performed in simple laboratories, but only in research centers, therefore they should be requested only for large and serious technical projects.
The correlation between the values of the ion-exchange capacity of clay and the Atterberg Limits (liquid limit and plasticity index) together with the montmorillonite percent, have been made in selected soil samples (Table 7). These samples were initially tested for CEC, and at the same time there were tested for montmorillonite percentage by the x-ray method, made at the IGME institute. From the results of the measurements on Table 7, the Graph 1 emerged, where the CEC values were placed on the x-axis, the Montmorillonite, and PI values were placed on the y axis, and as we can see, in Graph 1 there is a linear relationship of the form $Y = \alpha x + \beta$ with correlation coefficient $R^2$ moderately satisfactory, indicating that there is an influence on the mechanical properties of the soil, when it has a strong ion exchange capacity. In Graph 2 the CEC values were plotted versus Liquid limit values and we can see one exponential relation of the type $Y = \alpha b^{x}$ with strong coefficient of regression $R^2$.
From graphs one and two we can conclude In diagram 1 between percent of montmorillonite and CEC, there is one linear relation having the type
$\mathsf{Y} = \alpha \mathsf{x} + \beta$ and medium coefficient of regression $R^2 = 0.7267$
- In diagram 1 between plasticity index (PI) and cation exchange capacity (CEC) there is one linear relation of the type $\mathbf{Y} = \alpha \mathbf{x} + \beta$ and one medium coefficient of regression $R^2 = 0.7235$.
- In diagram 2 between liquid limit (LL) and cation exchange capacity (CEC) there is one exponential relation of the type $\mathsf{Y} = \mathsf{ab}^{\mathsf{x}}$ with a strong coefficient of regression $R^2 = 0.8178$.

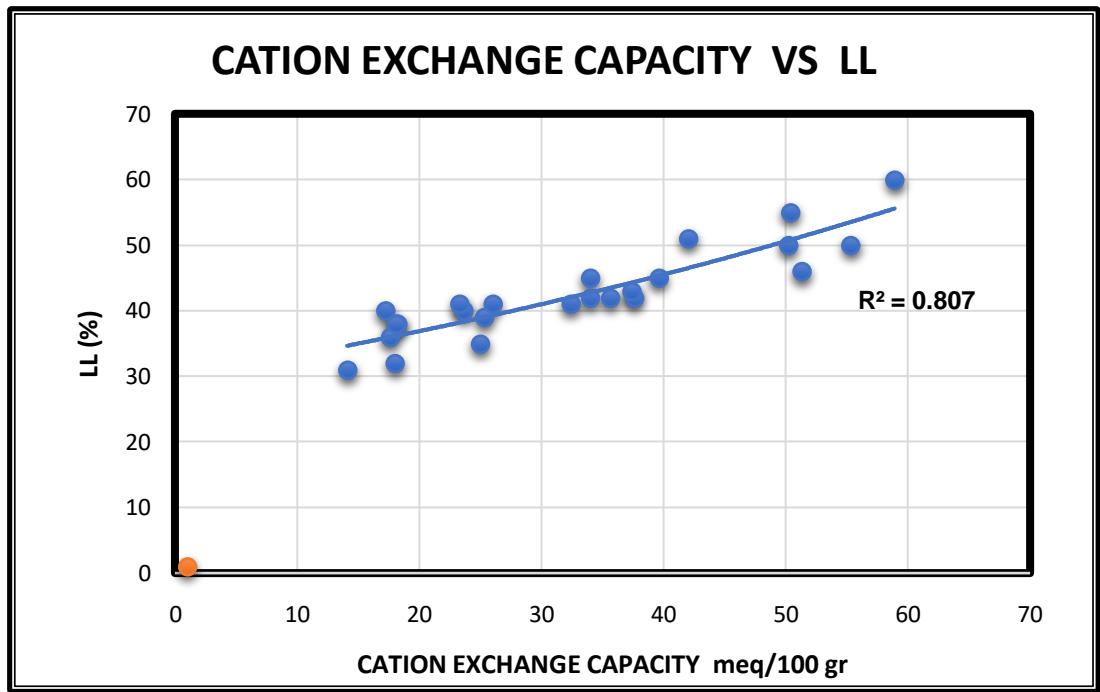 Graph 1: One attempt of Linear relation among CEC, Atterberg limits and montmorillonite%. Graph 2: One attempt of exponential relation among CEC and liquid limits
Table 7: Correlation between CEC Liquid limit, Plastic limit and percent of montmorillonite.
<table><tr><td>CEC</td><td>Montm</td><td>PI</td></tr><tr><td>55,3</td><td>35</td><td>47</td></tr><tr><td>58,9</td><td>45</td><td>45</td></tr><tr><td>17,2</td><td>10</td><td>24</td></tr><tr><td>51,3</td><td>30</td><td>30</td></tr><tr><td>37,6</td><td>33</td><td>35</td></tr><tr><td>37,4</td><td>35</td><td>23</td></tr><tr><td>35,6</td><td>33</td><td>28</td></tr><tr><td>50,2</td><td>31</td><td>29</td></tr><tr><td>34</td><td>19</td><td>35</td></tr><tr><td>17,6</td><td>10</td><td>20</td></tr><tr><td>25,3</td><td>11</td><td>28</td></tr><tr><td>18,2</td><td>16</td><td>19</td></tr><tr><td>42</td><td>30</td><td>35</td></tr><tr><td>18,1</td><td>19</td><td>22</td></tr><tr><td>32,4</td><td>28</td><td>32</td></tr><tr><td>56,9</td><td>43</td><td>41</td></tr><tr><td>50,4</td><td>40</td><td>43</td></tr><tr><td>34</td><td>27</td><td>28</td></tr><tr><td>18</td><td>25</td><td>20</td></tr><tr><td>14,1</td><td>21</td><td>24</td></tr><tr><td>26</td><td>14</td><td>22</td></tr><tr><td>23,3</td><td>13</td><td>27</td></tr><tr><td>25</td><td>15</td><td>20</td></tr></table>
Table 8: Results of CEC with acid acetate method and flogophotometer.
<table><tr><td>Samples</td><td colspan="2">Location</td><td>Concentration of Na+</td><td>Readings of corne flame</td><td>C.E.C. meq /100 gr.</td></tr><tr><td>sample-10</td><td>Ritsona</td><td>km=64+000</td><td>79</td><td>2.73</td><td>55.3</td></tr><tr><td>SAMPLE-2</td><td>ATHINA-LAMIA</td><td>-km=.73+300</td><td>84</td><td>2.93</td><td>58.9</td></tr><tr><td>SAMPLE-3</td><td>ATHINA-LAMIA-,</td><td>km=.77+000</td><td>79</td><td>2.72</td><td>55.1</td></tr><tr><td>SAMPLE-4</td><td>ATHINA-LAMIA,</td><td>km=.84+300</td><td>82</td><td>2.84</td><td>57.6</td></tr><tr><td>SAMPLE-5</td><td>ATHINA-LAMIA,</td><td>km=.85+400</td><td>80</td><td>2.80</td><td>56.2</td></tr><tr><td>SAMPLE-13</td><td>Aliartos town--viotia</td><td></td><td>58</td><td>1.75</td><td>35.1</td></tr><tr><td>SAMPLE-12</td><td>THIVES-CITY</td><td></td><td>71</td><td>2.45</td><td>49.8</td></tr><tr><td>SAMPLE-17</td><td>Thespies-town--viotia</td><td></td><td>61</td><td>1.80</td><td>36.0</td></tr><tr><td>SAMPLE 17 A</td><td>Thespies town--viotia</td><td></td><td>58</td><td>1.68</td><td>27.8</td></tr><tr><td>SAMPLE-9</td><td>THIVES -CITY</td><td></td><td>31</td><td>0.85</td><td>17.2</td></tr><tr><td>SAMPLE-14</td><td>ORHOMENOS-CITY</td><td></td><td>60</td><td>1.79</td><td>36.7</td></tr><tr><td>SAMPLE-15</td><td>Anthohori town--viotia</td><td></td><td>92</td><td>3.50</td><td>70.0</td></tr><tr><td>SAMPLE-8</td><td>Kastro town--viotia</td><td></td><td>65</td><td>2.11</td><td>48.6</td></tr><tr><td>SAMPLE-7</td><td>Ypato town--viotia</td><td></td><td>77</td><td>2.58</td><td>51.3</td></tr><tr><td>SAMPLE-11</td><td>SXIMATARI--ATTIKHS</td><td></td><td>69</td><td>2.53</td><td>50.1</td></tr><tr><td>SAMPLE-16</td><td>Dombrena town.</td><td></td><td>64</td><td>1.88</td><td>37.6</td></tr><tr><td>SAMPLE-56</td><td>KOMARA-EVROS km=.3+500</td><td></td><td>63</td><td>1.86</td><td>37.4</td></tr><tr><td>SAMPLE-57</td><td>KOMARA-EVROS km=.4+500</td><td></td><td>64</td><td>2.07</td><td>41.2</td></tr><tr><td>SAMPLE-58</td><td>KOMARA-EVROS km=.6+500</td><td></td><td>65</td><td>2.17</td><td>43.4</td></tr><tr><td>SAMPLE-21</td><td>FERRES-CITY -EVROS</td><td></td><td>60</td><td>1.81</td><td>37.0</td></tr><tr><td>SAMPLE-18</td><td>ORMENIO-EVROS km 6+ 500</td><td></td><td>60</td><td>1.78</td><td>35.6</td></tr><tr><td>SAMPLE-19</td><td>ORMENIO-EVROS km 7+ 000</td><td></td><td>48</td><td>1.30</td><td>26.0</td></tr><tr><td>SAMPLE-20</td><td>ORMENIO-EVROS km 7+ 450</td><td>38</td><td>1.13</td><td>22.7</td></tr><tr><td>SAMPLE-29</td><td>RODOS-ISLAND</td><td>72</td><td>2.56</td><td>50.2</td></tr><tr><td>SAMPLE-35</td><td>Livadi town--pieria</td><td>62</td><td>1.82</td><td>36.4</td></tr><tr><td>SAMPLE-36</td><td>Exohi town--pieria</td><td>64</td><td>1.94</td><td>39.6</td></tr><tr><td>SAMPLE-37</td><td>Keramidi town--pieria</td><td>60</td><td>1.70</td><td>34.0</td></tr><tr><td>SAMPLE-49</td><td>KIPARASSOS-KRETA</td><td>40</td><td>1.14</td><td>23.3</td></tr><tr><td>SAMPLE-51</td><td>Xinomilia--preveza</td><td>44</td><td>1.24</td><td>25.3</td></tr><tr><td>SAMPLE-52D</td><td>Despo --preveza</td><td>36</td><td>0.91</td><td>18.2</td></tr><tr><td>SAMPLE-22</td><td>Despo km= 60+500</td><td>68</td><td>2.12</td><td>42.4</td></tr><tr><td>SAMPLE-23</td><td>Despo km =.58 +500</td><td>55</td><td>1.62</td><td>25.1</td></tr><tr><td>SAMPLE-34</td><td>ITEA - CITY</td><td>34</td><td>0.89</td><td>17.4</td></tr><tr><td>SAMPLE-40</td><td>Nestani—Tripoli =A</td><td>34</td><td>0.84</td><td>16.8</td></tr><tr><td>SAMPLE-41</td><td>Nestani—Tripoli =B</td><td>35</td><td>0.90</td><td>18.1</td></tr><tr><td>SAMPLE-42</td><td>Nestani—Tripoli =C</td><td>78</td><td>2.78</td><td>53.7</td></tr><tr><td>SAMPLE-27</td><td>EGINA ISLAND</td><td>82</td><td>2.86</td><td>57.2</td></tr><tr><td>SAMPLE-32</td><td>ARTA-CITY</td><td>56</td><td>1.62</td><td>32.4</td></tr><tr><td>SAMPLE-24</td><td>Agia Anna -Evia Island</td><td>50</td><td>1.38</td><td>27.4</td></tr><tr><td>SAMPLE-25</td><td>Agia Anna -Evia Island</td><td>81</td><td>2.84</td><td>56.9</td></tr><tr><td>SAMPLE-26</td><td>Agia Anna -Evia Island</td><td>46</td><td>1.22</td><td>24.4</td></tr><tr><td>SAMPLE-33</td><td>ERYTHRES-CITY</td><td>80</td><td>2.80</td><td>50.4</td></tr><tr><td>SAMPLE-44</td><td>Sterna town--korinthos</td><td>60</td><td>1.78</td><td>34.0</td></tr><tr><td>SAMPLE-38</td><td>Spathovouni--korinthos</td><td>33</td><td>0.88</td><td>17.9</td></tr><tr><td>SAMPLE-46</td><td>Agios Basilios --korithos</td><td>30</td><td>0.72</td><td>14.4</td></tr><tr><td>SAMPLE-39</td><td>NEMEA - km 5+700</td><td>42</td><td>1.18</td><td>23.6</td></tr><tr><td>SAMPLE-53</td><td>PATRA CITY</td><td>49</td><td>1.58</td><td>30.5</td></tr><tr><td>SAMPLE-31</td><td>LAMIA CITY</td><td>48</td><td>1.30</td><td>26.0</td></tr><tr><td>SAMPLE-54</td><td>LESVOS ISLAND</td><td>81</td><td>2.80</td><td>56.1</td></tr><tr><td>SAMPLE-50</td><td>AGIA GALINI - KRETA</td><td>35</td><td>0.90</td><td>17.6</td></tr><tr><td>SAMPLE-30</td><td>LARISSA CITY</td><td>57</td><td>1.63</td><td>25.2</td></tr><tr><td>extra</td><td>Industrial Bentonite</td><td>94</td><td>3.60</td><td>72.0</td></tr><tr><td>extra</td><td>Industrial Kaolinite</td><td>14</td><td>0.30</td><td>6.0</td></tr></table>
Table 9: Results of pH measurements in the areas where ion exchange was measured
<table><tr><td>Samples</td><td>Location</td><td>CEC meq /100 gr.</td><td>n</td><td>pH</td><td>N</td></tr><tr><td>Δ-10</td><td>Ritsona km= 64+000</td><td>55.3</td><td>1</td><td>8.45</td><td>6</td></tr><tr><td>Δ-2</td><td>ATHINA-LAMIA -km=.73+300</td><td>58.9</td><td>1</td><td>8,59</td><td>4</td></tr><tr><td>Δ-3</td><td>ATHINA-LAMIA-,km=.77+000</td><td>55.1</td><td>1</td><td>8,40</td><td>4</td></tr><tr><td>Δ-4</td><td>ATHINA-LAMIA, km=.84+300</td><td>57.6</td><td>1</td><td>8,10</td><td>3</td></tr><tr><td>Δ-5</td><td>ATHINA-LAMIA, km=.85+400</td><td>56.2</td><td>1</td><td>8.25</td><td>3</td></tr><tr><td>Δ-6</td><td>ATHINA-LAMIA, -km=.87+850</td><td>55.8</td><td>1</td><td>7.75</td><td>5</td></tr><tr><td>Δ-13</td><td>Aliartos town--viotia</td><td>35.1</td><td>1</td><td>8,30</td><td>5</td></tr><tr><td>Δ-12</td><td>THIVA-CITY</td><td>49.8</td><td>1</td><td>8,04</td><td>5</td></tr><tr><td>Δ-17</td><td>Thespies town-- viotia</td><td>36.0</td><td>1</td><td>8,28</td><td>6</td></tr><tr><td>Δ-17-A</td><td>Thespies--viotia</td><td>27.8</td><td>1</td><td>7.93</td><td>4</td></tr><tr><td>Δ-9</td><td>THIVA-CITY</td><td>17.2</td><td>1</td><td>7.95</td><td>4</td></tr><tr><td>Δ-14</td><td>Orhomenos town--viotia</td><td>36.7</td><td>1</td><td>8,17</td><td>4</td></tr><tr><td>Δ-15</td><td>Anthohori-town--viotia</td><td>70.0</td><td>1</td><td>7.90</td><td>5</td></tr><tr><td>Δ-8</td><td>Kastro-town--viotia</td><td>48.6</td><td>1</td><td>8,58</td><td>8</td></tr><tr><td>Δ-7</td><td>Ypato-town--viotia</td><td>51.3</td><td>1</td><td>8.53</td><td>8</td></tr><tr><td>Δ-11</td><td>SHIMATARI-ATTIKHS</td><td>50.1</td><td>1</td><td>7.65</td><td>5</td></tr><tr><td>Δ-16</td><td>Dombrena town--viotia</td><td>37.6</td><td>1</td><td>8.30</td><td>10</td></tr><tr><td>Δ-56</td><td>KOMARA-EVROS-km=.3+500</td><td>37.4</td><td>1</td><td>7.91</td><td>3</td></tr><tr><td>Δ-57</td><td>KOMARA-EVROA-km=.4+500</td><td>41.2</td><td>1</td><td>8,02</td><td>3</td></tr><tr><td>Δ-58</td><td>KOMARA-EVROS-km=.6+500</td><td>43.4</td><td>1</td><td>8,25</td><td>3</td></tr><tr><td>Δ-21</td><td>FERRES-EVROS</td><td>37.0</td><td>1</td><td>7.80</td><td>5</td></tr><tr><td>Δ-18</td><td>ORMENIO-EVROS km= 6+ 500</td><td>35.6</td><td>1</td><td>8.23</td><td>2</td></tr><tr><td>Δ-19</td><td>ORMENIO-EVROS, km= 7+ 000</td><td>26.0</td><td>1</td><td>8,16</td><td>2</td></tr><tr><td>Δ-20</td><td>ORMENIO-EVROS, km= 7+ 450</td><td>22.7</td><td>1</td><td>7.91</td><td>2</td></tr><tr><td>Δ-29</td><td>RODOS-ISLAND</td><td>50.2</td><td>1</td><td>8.73</td><td>3</td></tr><tr><td>Δ-35</td><td>Livadi town--pieria</td><td>39.6</td><td>1</td><td>7.96</td><td>3</td></tr><tr><td>Δ-36</td><td>Exhi town--pieria</td><td>34.0</td><td>1</td><td>8.44</td><td>6</td></tr><tr><td>Δ-37</td><td>Keramidi town--pieria</td><td>36.4</td><td>1</td><td>8.68</td><td>3</td></tr><tr><td>Δ-49</td><td>KYPARYSSOS-CRETA</td><td>23.3</td><td>1</td><td>7.75</td><td>5</td></tr><tr><td>Δ-51</td><td>Xinomilia --preveza</td><td>25.3</td><td>1</td><td>8,01</td><td>3</td></tr><tr><td>Δ-52</td><td>Despo--preveza</td><td>18.2</td><td>1</td><td>7.94</td><td>3</td></tr><tr><td>Δ-22</td><td>Despo km= 60+500</td><td>42.4</td><td>1</td><td>8.20</td><td>3</td></tr><tr><td>Δ-23</td><td>Despo km= 58 +500</td><td>25.1</td><td>1</td><td>7.89</td><td>3</td></tr><tr><td>Δ-34</td><td>ITEA-CITY</td><td>17.4</td><td>1</td><td>8.26</td><td>6</td></tr><tr><td>Δ-40</td><td>Nestani-Tripoli-A</td><td>16.8</td><td>1</td><td>7.98</td><td>3</td></tr><tr><td>Δ-41</td><td>Nestani—Tripoli-B</td><td>18.1</td><td>1</td><td>8.09</td><td>4</td></tr><tr><td>Δ-42</td><td>Nestani—Tripoli-C</td><td>53.7</td><td>1</td><td>8.26</td><td>4</td></tr><tr><td>Δ-27</td><td>EGINA-ISLAND</td><td>57.2</td><td>1</td><td>8.53</td><td>3</td></tr><tr><td>Δ-32</td><td>ARTA-CITY</td><td>32.4</td><td>1</td><td>8.04</td><td>4</td></tr><tr><td>Δ-24</td><td>Agia Anna-Evia--Island</td><td>27.4</td><td>1</td><td>7.83</td><td>3</td></tr><tr><td>Δ-25</td><td>Agia Anna-Evia--Island</td><td>56.9</td><td>1</td><td>8.65</td><td>3</td></tr><tr><td>Δ-26</td><td>Agia Anna-Evia-Islan.</td><td>24.4</td><td>1</td><td>7.81</td><td>3</td></tr><tr><td>Δ-33</td><td>ERITHRES--CITY</td><td>50.4</td><td>1</td><td>7.90</td><td>5</td></tr><tr><td>Δ-44</td><td>Sterna town--korinthos</td><td>34.0</td><td>1</td><td>8.30</td><td>4</td></tr><tr><td>Δ-38</td><td>Spathvouni--korinthos</td><td>17.9</td><td>1</td><td>7.72</td><td>5</td></tr><tr><td>Δ-46</td><td>Agios Basilios--korinthos</td><td>14.4</td><td>1</td><td>8.40</td><td>9</td></tr><tr><td>Δ-39</td><td>Nemea km = 10+800</td><td>23.6</td><td>1</td><td>8.35</td><td>5</td></tr><tr><td>Δ-53</td><td>PATRAS-CITY</td><td>30.5</td><td>1</td><td>8.54</td><td>6</td></tr><tr><td>Δ-31</td><td>LAMIA-CITY</td><td>26.0</td><td>1</td><td>7.74</td><td>9</td></tr><tr><td>Δ-54</td><td>LESVOS-ISLAND</td><td>56.1</td><td>1</td><td>8.48</td><td>9</td></tr><tr><td>Δ-50</td><td>AGIA GALINI-CRETA</td><td>17.6</td><td>1</td><td>7.76</td><td>3</td></tr><tr><td>Δ-30</td><td>LARISSA-CITY</td><td>25.2</td><td>1</td><td>7.85</td><td>3</td></tr><tr><td>Extra</td><td>Industrial Bentonite</td><td>72.0</td><td>1</td><td>10.5</td><td>1</td></tr><tr><td>Extra</td><td>Industrial Kaolinite</td><td>6.0</td><td>1</td><td>5.2</td><td>1</td></tr></table>

## VIII. CONCLUSIONS
- The results of the investigation indicate that a general relationship exists between the cation
- exchange capacity of a soil and variances of the liquid and plasticity limit values as well as for montmorillonite percent. The relation between cation exchange capacity percent and montmorillonite% with plasticity index is linear with a moderate coefficient of regression $R^2 = 0.7267$. The relation between cation exchange capacity percent and and liquid limit values is exponential with a strong coefficient of regression $R^2 = 0.8178$, as the clay content increased.
- As it was identified, the CEC for the Greek swelling soils varied between 20 meq/100gr to 70 meq/
- 100gr. One soil sample from Viotia province (Area 8) revealed CEC 70 meq/ 100gr, like that of industrial bentonite.
- The homogeneity of the PH measurements made in 300 soil samples is also remarkable (table 9). This
- fact means that in the Greek clay soils the PH values are similar with what is described in the International Bibliography.
### UNAKNOWLEDGES
For the fulfillment of the experiments the author wishes to say thank you:
- (a) Public works central laboratory of the Ministry of Environment, Perseus street, Athens.
- (b) Institute of national research of the Ministry for Agriculture, (EΘΙΑΓΕ), Likovricy suburb of Athens.
Generating HTML Viewer...
References
34 Cites in Article
G Brindley (1964). Appendix: Report on the Work of the Nomenclature and Liaison Committee of the Clay Minerals Society, 1963–4.
Brown Brindley (1980). Crystal structures of clay minerals and x-ray identification.
P Büscher,N Koedam,D Van Speybroeck (1990). Cation‐exchange properties and adaptation to soil acidity in bryophytes.
John Christodoulias (2018). Geotechnical Properties of Problem Soils in Greece.
Solomon Adewuyi*,Ayomide Olugbade,Uchenna Ukwu,Nathaniel Dauda,Vivian Osadebe,Patience Ishieze,Chinenye Aruah,Adebisola Fadoju (2007). Optimizing Sweet Potato Productivity through Precision Propagation by Vine Cutting Position and Variety Synergy in Tropical Nigeria.
De,J Villiers,M Jackson (1967). Cation exchange capacity variations with pH in soil clays.
De,J Villiers,M Jackson (1967). Alumnus chlorite origin of pH dependent cation exchange capacity variations.
R Driscoll (1984). A review of British experience of expansive clay problems.
Gray Nia,David Lumsdon,Stephen Hillier (2018). Effect of pH on the cation exchange capacity of some halloysite nanotubes Published online.
R Grim (1953). Clay Mineralogy.
Ralph Grim (1955). Petrographic Study of Clay Materials.
M Jackson (1962). Soil chemical analysis.
A Jenning,D Kinkner (1990). Radiation monitoring around United States nuclear test areas, calendar year 1989.
J Havlin (2013). Soil Fertility and Fertilizers, 8th Edition.
W Kelley (1948). Cation exchange in soils.
W Kelley (1955). Interpretation of Chemical Analyses of Clays.
G Karunaratne,S Chew,A Sinha,S Lee (2001). Consolidation behaviour of bentonitekaolinite mix.
(2008). Glossary.
Barge La,G Lindsey,L (2012). Interpreting a Soil Test Report.
Theologuos Mimides,Theodora Perraki (1987). Evaluation of the attenuating properties of selected Greek clays for toxic inorganic elements in landfill sites.
J Mitchell,Sogak (2005). Fundamentals of soil behavior.
R Mitra,K Rajagopalan (1952). ORIGIN OF THE BASE-EXCHANGE CAPACITY OF CLAYS AND SIGNIFICANCE OF ITS UPPER LIMITING VALUE.
W Morin,W Parry (1971). Geotechnical Properties of Ethiopian Volcanic Soils.
Prakash Keshavamurthy (2016). INAEL Letters.
John Reganold,James Harsh (1985). Expressing cation exchange capacity in milliequivalents per 100 grams and in SI units.
C Rich,G Thomas (1960). The Clay Fraction Of Soils.
B Raymahashay,B Sahu (1980). Compaction characteristics of clay -mineral mixtures.
C Rich (1962). REMOVAL OF EXCESS SALT IN CATION-EXCHANGE-CAPACITY DETERMINATIONS.
A Sridhara (1999). Volume change behaviour of expansive soils.
H Thomson (1850). On the absorbent power of soils.
L Thomson (1957). Soils and Soil Fertility.
C Weaver,L Pollard (1973). Chapter 15 Trioctahedral 1:1 Clay Minerals.
Assoc Woodward-Clyde (1967). A Review paper on Expansive Clay Soils.
P Van Erp,V Houba,J Reijneveld,M Van Beusichem (2001). RELATIONSHIP BETWEEN MAGNESIUM EXTRACTED BY 0.01<i>M</i>CALCIUM CHLORIDE EXTRACTION PROCEDURE AND CONVENTIONAL PROCEDURES.
Explore published articles in an immersive Augmented Reality environment. Our platform converts research papers into interactive 3D books, allowing readers to view and interact with content using AR and VR compatible devices.
Your published article is automatically converted into a realistic 3D book. Flip through pages and read research papers in a more engaging and interactive format.
Our website is actively being updated, and changes may occur frequently. Please clear your browser cache if needed. For feedback or error reporting, please email [email protected]
Thank you for connecting with us. We will respond to you shortly.