
I. INTRODUCTION
People are often susceptible to making mistakes during analyses or, possibly, when trying to determine relationships between multiple features. This fact, makes it difficult for them to seek out solutions to certain problems. Data mining involves the utilization of sophisticated data analysis tools to get previously unknown, valid patterns, and relationships in the datasets[1]. These tools can include statistical models, mathematical algorithms, and machine learning methods [2].
Consequently, data processing consists of quite a collection and managing data, it also includes analysis and prediction [1].
The classification technique is capable of processing a sort of data than regression and is growing in popularity [3].
II. DATASET USED
The IRIS dataset contains three different classes of IRIS plants depending on their pattern . Each class of IRIS plant contain fifty objects. The attributes that already predicted belongs to a category of IRIS plant. The list of attributes presents within the IRIS is often described as categorical, nominal, and continuous. The experts have mentioned that the info set is complete i.e. there isn't any missing value found in any attribute of this data set [6].
This research makes use of the documented IRIS dataset, which contains three classes of fifty instances each. The 150 instances, which are equally divided between the three classes, hold the subsequent four numeric attributes:
1. Sepal length - continuous
2. Sepal width - continuous
3. Petal length - continuous
4. Petal width –continuous
And therefore the fifth attribute "Variety" is that the predictive attribute which identifies which class of the following belongs the instance: IRIS Setosa, IRISVersicolor, or IRIS Virginica .
III. CLASSIFIERS USED
In this paper, we compared the proficiency assessment of IRIS variety for two tree based classifiers: Random Forest and J48 Classifiers.
a) Random Forest Classifier
Random Forest [7] is considered one of the best "off-the-shelf" classifiers for high-dimensional data. Random forest is a mix of tree predictors sampled autonomously count on the values of a random vector following an equivalent distribution for all trees of the forest. The generalization error of random forest classifier depends on the association between the individual trees inside the forest and the strength of them. The dataset divided into a training dataset to learn each tree, and the remaining of the data set is used to estimate error and variable importance. Class assignment is formed according to the number of votes for any of the trees, to apply the model of the results. it's almost like bagged decision trees with hardly some key differences as given below:
For every split point, the search isn't overall p variables but just over m (number of tested) variables (where, e.g, m = [p/3])
No pruning necessary. Trees are often grown until each node contains just only a few observations. The Random Forest gave better prediction, and almost no parameter adjustment is necessary.
b) J48 Classifier
The J48 classifier is an extension of the decision tree C4.5 algorithm for classification [8], which creates a binary tree. It's the foremost useful decision tree approach for classification problems. This system constructs a tree to model the classification process. After the tree is made, the algorithm is applied to every tuple within the database and leads to classification for that tuple [9].
Algorithm J48 [9]:
INPUT: P//Training data OUTPUT DT //Decision tree DTBUILD (*P) { DT = φ; DT = Create root node and label with splitting attribute; DT = Add arc to root node for each split predicate and label; For each arc do P = Database created by applying splitting predicate to P; If stopping point reached for this path, then DT' = create leaf node and label with appropriate class; Else DT' = DTBUILD(P); DT = add DT' to arc; }
The absent values are ignored by J48 while building a decision tree, i.e. the known information about the attribute values for the other records is helpful to predict the value for that item. The idea is to divide the data into a range based on the attribute values for that element which are identified in the training sample .
IV. PERFORMANCE MEASURES USED
Various scales are wont to gauge the performance of the classifiers.
a) Classification Accuracy (CA)
Classification accuracy presents the percent of correctly classified instance in the test dataset. We calculate it by dividing the correctly classified instances by the total number of instance multiplied by 100.
b) Mean Absolute Error (MAE)
Mean absolute error is that the average of the variance between predicted and actual value altogether test cases. It's an honest measure to measure performance.
c) Root Mean Square Error (RMSE)
Root mean squared error is employed to scale dissimilarities between values. It's determined by taking the root of the mean square error.
d) Confusion Matrix (CM)
A confusion matrix is a tool checking in particular how often the predictions are correct compared to reality in classification problems.
V. RESULTS AND DISCUSSION
In this work, to evaluate the performance of the different Tree-based Classifiers (Random Forest and J48), we used a well-known open-source tool in the machine learning field called "WEKA". The performance is tested using two methods, first by splitting the dataset into training (70%) and testing (30%) datasets, as well as using different Cross-Validation methods.
a) Performance of Random Forest Classifier
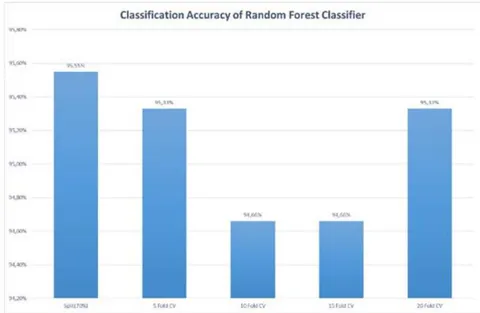
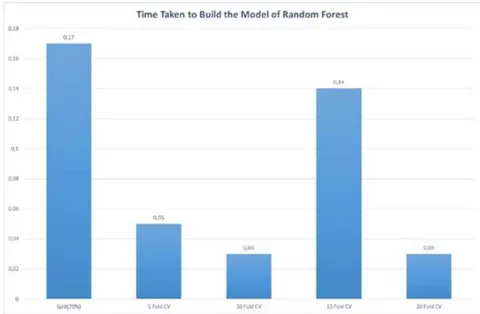
Table 1 show the global evaluation summary of Random Forest Classifier using both of the test modes: splitting and different cross-validation methods. Fig.1 and Fig.2 display the performance of Random Forest Classifier in terms of Classification Accuracy and time taken to build the model. From Table I to Table VI we gave the confusion matrix for different test modes.
By applying these test modes using Random Forest Classifier, we got 95.55% accuracy, spending 0.17s on building the model for the split. Using different cross-validation methods to check their performance, we obtained around 94.99% accuracy, spending 0.06s on building the model.
| Test Mode | Correctly Classified Instances | Incorrectly Classified Instances | Accuracy | Mean Absolute Error | Root Mean Squared Error | Time Taken to Build Model (Sec) |
| Split (70%) | 43 | 2 | 95.55% | 0.0363 | 0.1532 | 0.17 |
| 5 Fold CV | 143 | 7 | 95.33% | 0.037 | 0.1531 | 0.05 |
| 10Fold CV | 142 | 8 | 94.66% | 0.0408 | 0.1624 | 0.03 |
| 15Fold CV | 142 | 8 | 94.66% | 0.0385 | 0.1613 | 0.14 |
| 20Fold CV | 143 | 7 | 95.33% | 0.0379 | 0.1558 | 0.03 |
| Setosa | Versicolor | Virginica | Actual (Total) | |
| Setosa | 14 | 0 | 0 | 14 |
| Versicolor | 0 | 16 | 0 | 16 |
| Virginica | 0 | 2 | 13 | 15 |
| Predicted (Total) | 14 | 18 | 13 | 45 |
| Setosa | Versicolor | Virginica | Actual (Total) | |
| Setosa | 50 | 0 | 0 | 50 |
| Versicolor | 0 | 47 | 3 | 50 |
| Virginica | 0 | 4 | 46 | 50 |
| Predicted (Total) | 50 | 51 | 49 | 150 |
| Setosa | Versicolor | Virginica | Actual (Total) | |
| Setosa | 50 | 0 | 0 | 50 |
| Versicolor | 0 | 47 | 3 | 50 |
| Virginica | 0 | 4 | 46 | 50 |
| Predicted (Total) | 50 | 51 | 49 | 150 |
| Setosa | Versicolor | Virginica | Actual (Total) | |
| Setosa | 50 | 0 | 0 | 50 |
| Versicolor | 0 | 47 | 3 | 50 |
| Virginica | 0 | 5 | 45 | 50 |
| Predicted (Total) | 50 | 52 | 48 | 150 |
| Setosa | Versicolor | Virginica | Actual (Total) | |
| Setosa | 50 | 0 | 0 | 50 |
| Versicolor | 0 | 47 | 3 | 50 |
| Virginica | 0 | 4 | 46 | 50 |
| Predicted (Total) | 50 | 51 | 49 | 150 |
b) Performance of J48Classifier
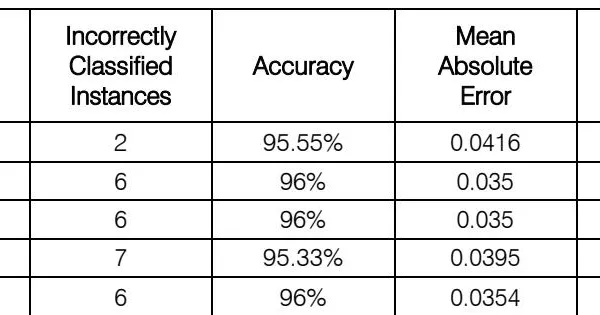
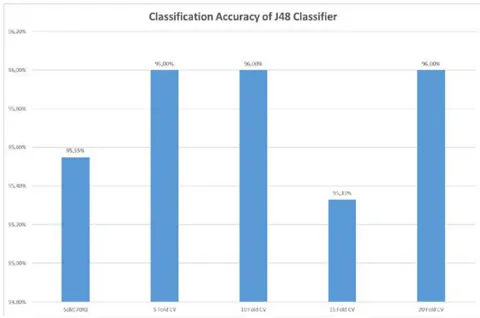
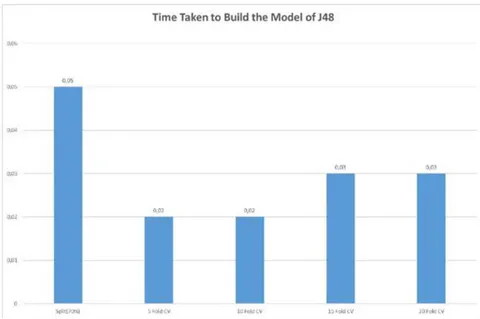
Table VII show the global evaluation summary of J48classifier using both of the test modes: splitting and different cross-validation methods. Fig.3 and Fig.4 display the performance of J48classifier in terms of classification accuracy and time taken on building the model. From Table VIII to Table XI we gave the confusion matrix for different test modes.
By applying these test models using J48 classifier we got 95.55% accuracy, spending 0.05s on building the model for the split mode. Using different cross-validation methods to check their performance, on average we obtained around 95.83% accuracy, spending 0.025s to build the model.
| Test Mode | Correctly Classified Instances | Incorrectly Classified Instances | Accuracy | Mean Absolute Error | Root Mean Squared Error | Time Taken to Build Model (Sec) |
| Split (70%) | 43 | 2 | 95.55% | 0.0416 | 0.1682 | 0.05 |
| 5Fold CV | 144 | 6 | 96% | 0.035 | 0.1582 | 0.02 |
| 10Fold CV | 144 | 6 | 96% | 0.035 | 0.1586 | 0.02 |
| 15Fold CV | 143 | 7 | 95.33% | 0.0395 | 0.1758 | 0.03 |
| 20Fold CV | 144 | 6 | 96% | 0.0354 | 0.1586 | 0.03 |
| Setosa | Versicolor | Virginica | Actual (Total) | |
| Setosa | 14 | 0 | 0 | 14 |
| Versicolor | 0 | 16 | 0 | 16 |
| Virginica | 0 | 2 | 13 | 15 |
| Predicted (Total) | 14 | 18 | 13 | 45 |
| Setosa | Versicolor | Virginica | Actual (Total) | |
| Setosa | 49 | 1 | 0 | 50 |
| Versicolor | 0 | 47 | 3 | 50 |
| Virginica | 0 | 2 | 48 | 50 |
| Predicted (Total) | 49 | 50 | 51 | 150 |
| Setosa | Versicolor | Virginica | Actual (Total) | |
| Setosa | 49 | 1 | 0 | 50 |
| Versicolor | 0 | 47 | 3 | 50 |
| Virginica | 0 | 2 | 48 | 50 |
| Predicted (Total) | 49 | 50 | 51 | 150 |
| Setosa | Versicolor | Virginica | Actual (Total) | |
| Setosa | 49 | 1 | 0 | 50 |
| Versicolor | 0 | 47 | 3 | 50 |
| Virginica | 0 | 3 | 47 | 50 |
| Predicted (Total) | 49 | 51 | 50 | 150 |
| Setosa | Versicolor | Virginica | Actual (Total) | |
| Setosa | 49 | 1 | 0 | 50 |
| Versicolor | 0 | 47 | 3 | 50 |
| Virginica | 0 | 2 | 48 | 50 |
| Predicted (Total) | 49 | 50 | 51 | 150 |
VI. COMPARISON OF RANDOM FOREST AND J48 CLASSIFIERS
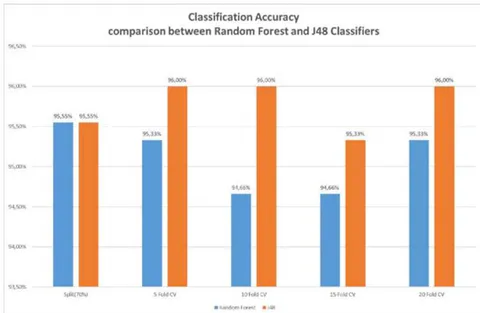
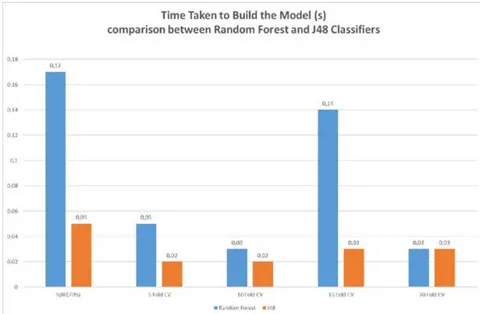
Fig. 5 and Fig. 6 illustrate a comparison between Random forest and J48 according to classification accuracy and time taken on building the model.
Through the comparison of the performance using training set (70%) process and various cross-validation methods between Random Forest and J48 classifiers depending on time taken on building the model, CA, MAE, and RMSE values, we reached that J48 classifier outperforms Random Forest.
VII. CONCLUSION
This research work compares the efficiency of Random Forest and J48 Classifiers for IRIS variety prediction. The test is accomplished using WEKA 3.9in a machine with a processor i5-2430M 2.40 GHz and 4.00GB in RAM. Also, we compare the performance of both of the classifiers in terms of different scales of effectiveness evaluation. At last, we observed that J48classifier performs best than Random Forest classifier for IRIS variety prediction by taking different measures, including classification accuracy, Mean Absolute Error, and Time Taken to Build the Model.