
I. INTRODUCTION
The increase in global connectivity and rapid expansion of computer usage and computer networks has made the security of the computer system an important issue; with the industries and cyber communities being faced with new kinds of attacks daily. The high complexity of intrusion poses a great challenge to the protection of cyberinfrastructure and the Confidentiality, integrity, and availability of sensitive information stored on them. The state of computer security is complicated, it is difficult to have a system that is completely free from attacks. The nature and the means of executing cyberattacks make it prevalent. Cyber-attacks are easy and cheap to execute, all that is required to stage a cyber-attacks are computer system and internet access, the nature of internet makes launching a cyber-attack is less risky than physical attacks, and not constrained by geographical distance. [1]. Network traffics contain different types of protocols and services which accounted for the multiple features in the network packet. Some of these features are redundant or irrelevant and does not contribute the classification of the network packets as either attack or normal network packets. The redundant features are the primary causes of increasing the false alarm rate (FAR) and decrease in detection accuracy. Feature Selection (FS) Techniques are the methods used to determine the relevant features of a dataset. It is an efficient way to reduce the dimensionality of a problem [2]. Different FS techniques existed in classification and clustering problems. They are i) Filter method ii) Wrapper Method and iii) Embedded method. The filter methods are used to select the features based on the scores in various statistical correlations. Wrapper method uses a greedy approach in feature selection. It evaluates all possible combination and produces the result for Machine learning. The embedded method combines the advantage of two models. Filtered Feature selection algorithms can be grouped into two categories from the point of view of a method's output: feature-ranking and feature-subset selection. Feature-subset selection focuses on selecting best subset of features that satisfies an evaluation criterion, feature-ranking on the other hand ranks features according to certain evaluation criterial, which measures the relevance of individual feature to the target class, and select the set of ranked features that gives the best evaluation performance, the drawback of this methods is that, a features that is not relevant to the target class on its own, can be very relevant when combined with others features.
The objectives of feature-ranking are three-folds: improving the prediction performance of the predictors, providing faster and more cost-effective predictors, and providing a better understanding of the underlying process that generated the dataset . The FS also reduces the computational time to implement an online Network Intrusion Detection System (NIDS) . The efficiency of the FS methods is measured by its accuracy at removing noisy and redundant features . The quality of the network traffics /dataset does not only help to build effective NIDS but also shows its potential efficiency during deployment in a real-life operating environment. NIDS analyze and monitor network traffic to detect suspicious activities and vulnerability in the system [6]. The effectiveness of NIDS is evaluated based on its ability to correctly identify network traffics as attacks traffic or benign traffics (normal) in a comprehensive dataset that contains normal and abnormal behaviors [7].
Feature-ranking techniques ranked features independently without involving any learning algorithm based on statistics, information theory, or some functions of classifier's outputs [8]. It consists of scoring each feature according to a particular evaluation criterion [9]. Several authors have proposed various features selection methods. In the work of Wang and Gombault [9], IG and Chi-squared were applied to extract nine most important features from the forty one features to build Bayesian Network and C 4.5 decision tree classifiers to detect DDoS attack in the network. Results obtained shows that the detection accuracy remains the same while the overall efficiency improved. Authors in [10] proposed a multi-filter feature selection techniques that combines the results four filter selections methods on NSL-KDD intrusion network dataset to achieve an optimum selection. C4.5 decision tree evaluation of the thirteen optimal selected features out of forty one features shows a high detection rate and classification accuracy when compared to the forty-one features and other classification techniques. [11] Proposed a feature selection method based on Decision Dependent Correlation (DDC). Mutual information of each feature and decision is calculated and top 20 important features {feature no.: 3, 5, 40, 24, 2, 10, 41, 36, 8, 13, 27, 28, 22, 11, 14, 17, 18, 7, 9 and 15} are selected and evaluated by SVM classifier. The classified result is detection accuracy. [12] Applied Information Gain (IG), Correlation-based (CFS), Gain Ratio (GR) feature selection to reduce the dimensionality of NSL-KDD dataset, and built a decision tree classifiers of the three feature selection methods. The three classifier recorded an improved performance than the classifier built with the whole NSL-KDD dataset. [13] Proposed a feature selection method that combined three filter methods; Gain ratio, Chi-squared and Relief F (triple-filter) in a cluster-based heterogeneous Wireless sensor network (WSN) for attacks classification. 14 important features of the NSL-KDD intrusion detection benchmark dataset out of the 41 original features were extracted for intrusion detection classifier. Results obtained show that the proposed method can effectively reduce the number of features with a high classification accuracy and detection rate in comparison with other filter methods.
II. METHODOLOGY
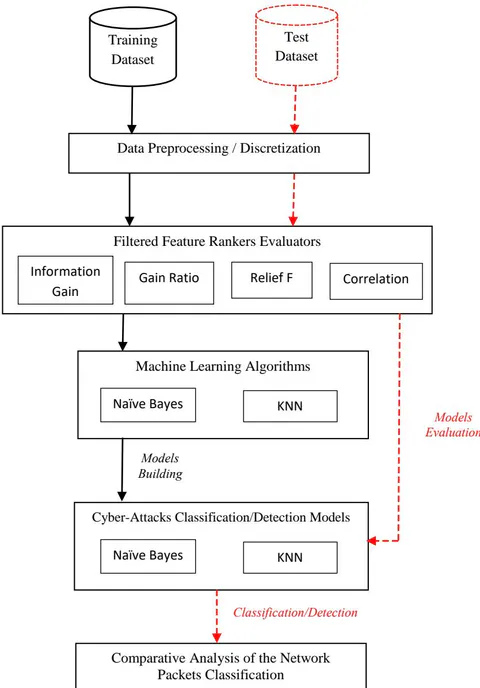
The proposed architecture of the Comparative Analysis of Selected Filtered Feature Rankers Evaluators for Cyber Attacks Detection is depicted in Figure 1. The discretization of the UNSW-NB15 dataset was first carried out to make it suitable for machine learning. Four Filtered Feature Rankers Evaluators algorithms; (Information Gain, Relief F, Gain Ration, and Correlation) rankers were used to rank and select the optimal relevant features of training and testing UNSW-NB15 intrusion datasets. The training dataset with the all it feature and the reduced features of the training datasets were used to train the K Nearest Neighbors (KNN, and Naive Bayes' algorithms. The testing dataset with the all it features and the reduced features of the testing dataset were used to evaluate the two classifiers. The model's training is depicted in black arrow lines while the model's evaluation is depicted in red arrow lines in the figure. The results of the evaluation for each reduced dataset were analyzed.
a) Description of UNSW-NB15 Dataset
The UNSW NB-15 dataset was developed using the IXIA Perfect Storm tool by the cybersecurity research group at the Australian Center for Cyber Security . It is a fusion of normal network traffic packets, and synthetic modern-day network traffics attacks. The training and testing contain 82,332 and 174,341 records with 49 features each, respectively . The dataset comprises nine attack categories and normal traffic, and it is suitable for the effective detection of existing and new attacks . The details of both attack and normal traffic, coupled with the records in the training and testing categories, are presented in Table 1.
| Training | Testing | |||
| Names of Attack | No of Connection | Percentage Distribution | No of Connection | Percentage Distribution |
| Reconnaissance | 3496 | 4.25 | 10491 | 5.98 |
| Dos | 4089 | 4.9 | 12264 | 6.99 |
| Exploit | 11132 | 13.52 | 33393 | 19.04 |
| Shellcode | 378 | 0.46 | 1133 | 0.65 |
| Fuzzers | 6062 | 7.36 | 18184 | 10.37 |
| Backdoor | 583 | 0.71 | 1746 | 1.00 |
| Analysis | 672 | 0.82 | 2000 | 1.14 |
| Generic | 18871 | 22.92 | 40000 | 22.81 |
| Worms | 44 | 0.05 | 130 | 0.07 |
| Total No of Attacks | 45332 | 55.06 | 119341 | 68.06 |
| Normal | 37000 | 44.94 | 56000 | 31.94 |
| Total No of Connections | 82332 | 100.00 | 175341 | 100.00 |
b) Data Munging and Analytic
This section outlines the Feature Rankers Evaluators and the machine learning techniques used for this study.
i. Description of Attributes Selection Evaluators
Attributes Selection Evaluator ranks features based on their relevant to the target class, ranking is a way of evaluating relevant features and selecting a minimal set of features based on given criteria in order to build simple models, that take less time to compute and become more understandable Feature ranking evaluation criterion compute the score of feature (fi) of the training dataset. By convention a high score implies important (relevant) of the feature to the target class and select the k highest ranked features according to S. This is usually not optimal, but computationally efficient and often preferable to other, more complicated feature selection methods that involve searching through the entire search space. In this study, we use four feature-ranking techniques; Correlation Attribute Evaluator (CAE), Gain Ratio Attribute Evaluator (GAE), Information Gain attribute Evaluator (IGAE) and Relief F Attribute Evaluator (RFAE).
a. Correlation Attribute Evaluator (CAE)
Correlation Attribute Evaluator (CAE), evaluate Attribute using correlation analysis. The correlation between each attributes x and the target class Y, can be measured by finding correlation coefficient. A good feature is expected to have a higher correlation coefficient between it and target class. In correlation attribute evaluator method the attributes are considered based on their values where each value is treated as an indicator. CAE handles only nominal attributes input for evaluation and it uses Pearson's formula for computing correlation coefficient. for a candidate feature and regression target Y the Pearson correlation coefficient is given by
where cov designates the covariance and var the variance.
b. Information Gain attribute Evaluator (IGAE)
Information gain (IG) measures the amount of information in bits about the class prediction, if the only information available is the presence of a feature and the corresponding class distribution. Concretely, it measures the expected reduction in entropy (uncertainty associated with a random feature) [15], it is given by equation 2.
Info Gain (Class, feature) = H (target class (Y)) - H (target class(Y) | feature (X))
Whereis the entropy of the target class, andis the entropy of the target class given a certain attribute X.
The entropy of the target class Y is given by equation (3).
Equation (4) gives the entropy of target class Y after observing feature X.
c. Gain Ratio Attribute Evaluator (GRAE)
Gain ratio (GR) is a modification of the information gain that reduces its bias. It considered the number and size of branches in choosing an attribute. It assess the value of an attribute by measuring its gain ratio with respect to the target class . The root attribute is the attribute of the UNSW-NB15 with the highest gain ratio, the gain ratio is the ratio of the information gain and the split information for the attribute as presented in equation 5.
The information gain of attribute X is given by equation 2.
The Split information value of an attribute is chosen by taking the average of all the values in the domain of current attribute. It is given by equation 6.
Where n is the number of instances in the UNSW-NB15 training dataset.
d. Relief Attribute Evaluator (RFAE)
Relief Attribute Evaluator (RFAE) sample an instance recurrently using distance function taking into consideration the value of the given attribute for the nearest instance of the same and different class . The original Relief algorithm, proposed by Kira and Rendell , is a two-class filtering algorithm for features normalized to . Each feature is initially assigned a zero weight. An A-dimensional training example R is chosen randomly and the Euclidean distance to all other instances calculated. Denote the nearest hit in the same class H, and the nearest miss in a different-class M. Since a good feature R[A] should be able to separate class values, it should have a small distance to H and a large distance to M. Hence W[A] is adjusted to reward good features and penalize poor ones. The final selection of features is made by selecting those large W[A], (that is. those that exceed a given threshold.)
ii. Description of Machine learning techniques
Two machine learning algorithms, namely; KNN and Naïve Bayes were used in this study to build the intrusion detection system.
a. K-Nearest Neighbor
Let and qt represent the instance to be classified and the other instances in the dataset having the same number of features as P respectively, K-nearest neighbor Euclidean distance between and is defined in equation 7.
From equation (3), a given instance will be classified as the attack categories having majority attacks among top k closest instance to the given instance.
b. Naïve Bayes
Given the UNSW-NB15 intrusion detection dataset that have X number of attributes called the predictors and another attribute y called the class label, with ten members , the Naive Bayes probability that a class will be assigned to a given unlabelled instance X is given in equation 8.
Maximum posterior probability for classifying a new instance attack categories is given in Equation 9.
c) Performance Evaluation Metrics
Performance evaluation metrics play significant roles in assessing the predictive performance of the model and determining the model's fitness for the classification purpose. The confusion matrix, also known as the error matrix, is one of the most intuitive and easiest metrics used for finding the correctness and accuracy of the model. It has four possible outcomes, which are; True Positive (TP, Attack Network Packets detected as Attack Packets), True Negative (TN, Normal Network Packets Detected as Normal Packet), False Positive (FP, Attack Network Packets detected as Normal Packet), and False Negative (FN, Normal Network packets detected as Attack Packet). Detection accuracy, False alarm rate and precision are the three metrics used to evaluate the performances of the
Intrusion detection classifiers of the four reduced dataset.
i. Accuracy
Accuracy (ACC) is the ratio of all correctly classified network packets to the total number of instances in the intrusion test dataset, it is given by equation.1. An accuracy of 1 implies error rate of 0 and an accuracy of 0 indicate error rate of 10.
ii. False Positive Rate (FPR) or False Alarm Rate (FAR)
False Positive Rate (FPR) or False Alarm Rate (FAR) is the proportion of actual network attacks cases that were predicted as Normal packets by the model. FPR should be as low as possible to avoid unwanted false alarms. it is given by equation 11.
iii. Precision
Precision is the ratio of correctly predicted positive observations to the total predicted positive observations. High precision relates to the low false positive rate. it is given by equation 12.
III. EXPERIMENTAL SETUP AND RESULTS DISCUSSION
Four feature selection rankers were used to select the relevant features of the UNSW-NB15 intrusion dataset to build Intrusion Detection System. Two classification models (Naïve Bayes and KNN) were used to build the Intrusion detection system for the cyberattacks detection and classification of Network traffic in a computer network. The relevant features of the UNSW-NB15 intrusion detection dataset selected by the four (4) filter features rankers are presented in Table 2. Relief F features ranker selected thirteen (13) features, Information Gain features ranker selected fourteen (15) features, Gain ration selected fifteen (14) features, while correlation ranker selected eleven (11) features. It was observed that Proto, Service and Ct_dst_sport_ltm were the only features that were commonly selected by the feature selection algorithms. Thus, they were the features observed to be the most relevant based on the four methods of evaluating the relevance and having the greatest importance in the detection and classification of attack packets in the network traffics.
| Relief F (13) | Gain Ratio (14) | Information Gain (15) | Correlation Ranker (11) |
| proto, service, state, smean, ct_dst_src_ltm Sttl, ct_state_ttl, ct_srv_src, ct_dst_sport_ltm, ct_srv_dst, dttl, ct_dst_ltm, ct_src_ltm | Proto, service, smean, ct_state_ttl, ct_dst_sport_ltm, ct_dst_dport_ltm, ct_srv_dst, Sbytes, dbytes, rate, dmean,dpkts, dur, sload | proto, service, state, smean, swin, sttl, ct_state_ttl, dwin, ct_dst_sport_ltm, ct_src_dport_ltm, Sbytes, dttl, tcprtt, stcpb, dtcpb | proto, service, state, ct_srv_src, ct_dst_src_ltm, swin, sttl, Dwin, ct_dst_sport_ltm, ct_src_dport_ltm, ct_srv_dst |
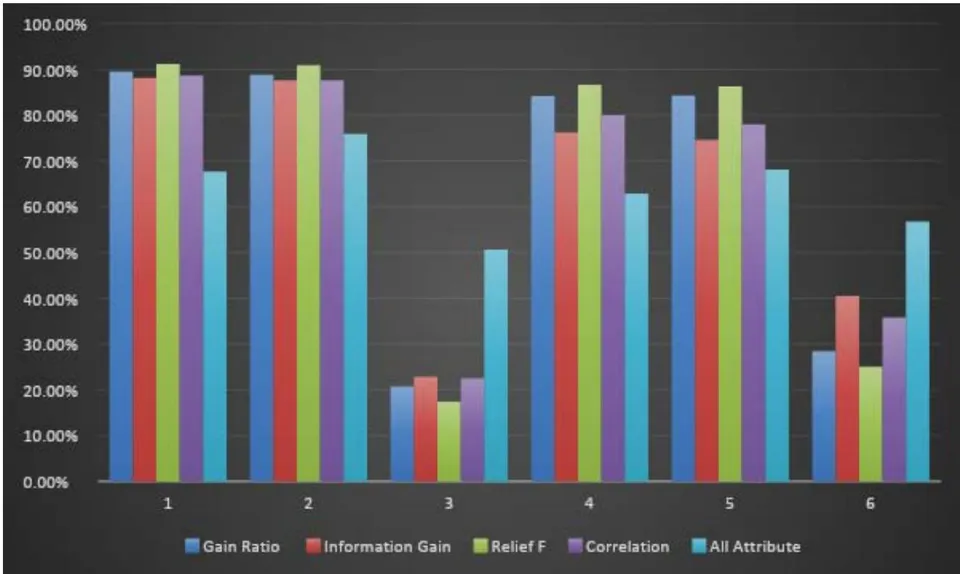
These reduced selected features with the complete features were used to build Intrusion detection systems of Naïve Bayes and KNN. The UNSW-NB15 testing dataset was used to evaluate all the classifiers. The confusion matrix and the performance of the KNN and Naïve Bayes classifiers with each of the selected features of the ranking feature technique is presented in Table 3 and 4 respectively. From tables 3 and 4, it shows that KNN and Naive Bayes intrusion detection models of Relief F selected features that identified thirteen (13) features recorded the best performance in terms of detection accuracy, classification precision and false alarm rate. The Intrusion detection models of KNN and Naïve Bayes of the fourteen (14) features identified by the Gain Ratio recorded the second best performance in terms of the selected performance metrics. Correlation and information Gain recorded the third and the fourth performances among the Rankers Features Selection Techniques respectively. Intrusion detection models of the two classifier with all of features of the UNSW-NB15 intrusion detection network dataset recorded the least and poorest performance, this result shows the importance and ability of the Rankers Features Selection Techniques to improve the performance of intrusion detection models.
The comparison analysis of the two classifiers shows that, KNN intrusion detection models recorded better detection accuracy, precision and false alarm rate than the Naïve Bayes model in the classification of UNSW-NB15 intrusion detection network dataset, it can be further deduced that the Relief F features selection method with KNN is the best-performing algorithm for the detection of network packets of UNSW-NB15 intrusion detection dataset. The comparison analysis of the selected Rankers Features Selection Techniques with each machine learning algorithms, based on the selected performance metrics is illustrated in Figure 2.
| Rankers Features Selection Techniques | Number of selected Features | Confusion Matrix | Performance Metrics | |||||
| TP | TN | FP | TP | Accuracy | Precision | FAR | ||
| Gain Ratio | 14 | 106023 | 50900 | 13318 | 5100 | 89.50% | 88.84% | 20.74% |
| Information Gain | 15 | 104572 | 49908 | 14769 | 6092 | 88.10% | 87.62% | 22.84% |
| Relief F | 13 | 108503 | 51420 | 10838 | 4580 | 91.21% | 90.92% | 17.41% |
| Correlation | 11 | 104572 | 50826 | 14769 | 5174 | 88.63% | 87.62% | 22.52% |
| All Attribute | 49 | 90572 | 28026 | 28769 | 27974 | 67.64% | 75.89% | 50.65% |
| Rankers Features Selection Techniques | Number of selected Features | Confusion Matrix | Performance Metrics | |||||
| TP | TN | FP | TP | Accuracy | Precision | FAR | ||
| Gain Ratio | 14 | 100629 | 47007 | 18712 | 8993 | 84.20% | 84.32% | 28.47% |
| Information Gain | 15 | 89042 | 44576 | 30299 | 11424 | 76.20% | 74.61% | 40.47% |
| Relief F | 13 | 102983 | 48937 | 16358 | 7063 | 86.64% | 86.29% | 25.05% |
| Correlation | 11 | 93072 | 47186 | 26269 | 8814 | 79.99% | 77.99% | 35.76% |
| All Attribute | 49 | 81272 | 29026 | 38069 | 26974 | 62.90% | 68.10% | 56.74% |
IV. CONCLUSIONS
In this research, Comparative Analysis of Selected Filtered Feature Rankers Evaluators for Cyber Attacks Detection was proposed using UNSW-NB15 intrusion detection network dataset. The dataset contained nine attacks and one normal traffic types with 49 features some of which were not suitable for the effective detection of existing and new attacks. Four selected Filtered Feature Rankers Evaluators ((Information Gain, Relief F, Gain Ratio, and Correlation) were applied to the dataset to select it suitable and relevant features to model intrusion detection systems of KNN and Naïve Bayes machine learning algorithms. The Results of the features ranking shows that Relief F features ranker selected thirteen (13) features, Information Gain features ranker selected fourteen (15) features, Gain ration selected fifteen (14) features, while correlation ranker selected eleven (11) features. Features selected by Relief F recorded the best performance, Gain Ratio recorded the second best performance. Correlation and information Gain recorded the third and the fourth performances respectively, while the use of all the features recorded the least and poorest performance, this result shows the importance and ability of the Rankers Features Selection Techniques to improve the performance of intrusion detection models. All the KNN models recorded better performance than all Naïve Bayes models. The models' performance were measured in terms of Classification /detection accuracy, precision and false alarm rate. The results further show models of KNN with the reduced features of Relief F features selection method recorded the best overall performance for the detection of network packets of UNSW-NB15 intrusion detection dataset.
a) Ethical Standard Funding
Conflict of Interest
The corresponding author states that there is no conflict of interest.