Three samples of water from Kwale, Nembe, and Kula in the Niger Delta were collected and characterized, and the following properties: pH, Temperature, Dissolved Oxygen, Turbidity, Acidity, Alkalinity, Electrical conductivity, Salinity, Oil and Grease, Total Hydrocarbon (THC), Heavy metals, BTEX and Poly Aromatic Hydrocarbon (PAH) were determined. The result of some of the key parameters showed that the Salinity of the Kula water sample is highest with a salt concentration of 13,115mg/L (at 30°C) followed by the Nembe water sample with a salt concentration of 2,500mg/L (at 29.68°C) and Kwale with a small salt concentration of 60mg/L (at 28.67°C). The electrical conductivity of the three water samples followed the same trend as salinity with Kula, Nembe, and Kwale water samples having electric conductivity of 20,101µS/cm (at 30°C), 1,489µS/cm (at 29.68°C), and 122µS/cm (at 28.67°C) respectively.
## I. INTRODUCTION
Seawater, or salt water, is water from a sethe or ocean. On average, seawater in the world's oceans has a salinity of about $3.5\%$ (35 g/L, 599
Author $\rho$: Reservoir Engineer and Data Scientist, Directorate of Hydrocarbons and Other Energy Resources, Republic of Benin.
Author G: FHN 26 Limited (First Hydrocarbon) Block W Shell Estate Edjeba, Warri, Delta State Nigeria.
mM). This means that every kilogram (roughly one litre by volume) of seawater has approximately 35 grams (1.2 oz) of dissolved salts (predominantly sodium $\left(\mathrm{Na}^{+}\right)$ and chloride $\left(\mathrm{Cl}^{-}\right)$ ions). The average density at the surface is $1.025\mathrm{kg / L}$. Seawater is denser than fresh and pure water (density $1.0\mathrm{kg / L}$ at $4^{\circ}\mathrm{C}$ $(39^{\circ}\mathrm{F})$ because the dissolved salts increase the mass by a larger proportion than the volume. The freezing point of seawater decreases as salt concentration increases. At typical salinity, it freezes at about $-2^{\circ}\mathrm{C}$ $(28^{\circ}\mathrm{F})$ (Chester & Roy, 2012). The coldest seawater ever recorded (in a liquid state) was in 2010, in a stream under an Antarctic glacier, and measured $-2.6^{\circ}\mathrm{C}$ $(27.3^{\circ}\mathrm{F})$. Seawater pH is typically limited to a range between 7.5 and 8.4. However, there is no universally accepted reference pH scale for seawater and the difference between measurements based on different reference scales may be up to 0.14 units (Chester & Roy, 2012).
Most of the seawater has a salinity of between $31\mathrm{g / kg}$ and $38\mathrm{g / kg}$, which is $3.1 - 3.8\%$, seawater is not uniformly saline throughout the world. Where mixing occurs with fresh water runoff from river mouths, near melting glaciers, or vast amounts of precipitation (e.g. Monsoon), seawater can be substantially less saline. The most saline open sea is the Red Sea, where high rates of evaporation, low precipitation, low river run-off, and confined circulation result in unusually salty water. The salinity in isolated bodies of water can be considerably greater still - about ten times higher in the case of the Dead Sea. Historically, several salinity scales were used to approximate the absolute salinity of seawater. A popular scale was the "Practical Salinity Scale" where salinity was measured in "practical salinity units (PSU)". The current standard for salinity is the "Reference Salinity" scale with the salinity expressed in units of "g/kg" (Corwin & Lesch, 2013).
The density of surface seawater ranges from about 1020 to $1029\mathrm{kg} / \mathrm{m}^3$ depending on the temperature and salinity. At a temperature of $25^{\circ}\mathrm{C}$, salinity of $35\mathrm{g / kg}$ and 1 atm pressure, the density of seawater is $1023.6\mathrm{kg} / \mathrm{m}^3$ (Feistel, 2008). Deep in the ocean, under high pressure, seawater can reach a density of $1050\mathrm{kg} / \mathrm{m}^3$ or higher. The density of seawater also changes with salinity. Brines generated by seawater desalination plants can have salinities up to $120\mathrm{g / kg}$. The density of typical seawater brine of $120\mathrm{g / kg}$ salinity at $25^{\circ} \mathrm{C}$ and atmospheric pressure is $1088 \, \mathrm{kg/m}^3$ (Millero et al., 2008).
The pH of seawater is limited to the range of 7.5 to 8.4 while thermal conductivity is $0.6\mathrm{W / mK}$ at $25^{\circ}C$ and a salinity of $35~\mathrm{g / kg}$. The thermal conductivity decreases with increasing salinity and increases with increasing temperature (Shargawy et al., 2010). Seawater contains more dissolved ions than all types of freshwaters (Millero et al., 2008). However, the ratios of solutes differ dramatically. For instance, although seawater contains about 2.8 times more bicarbonate than river water, the percentage of bicarbonate in seawater as a ratio of all dissolved ions is far lower than in river water. Bicarbonate ions constitute $48\%$ of river water solutes but only $0.14\%$ of seawater (Millero, et al., (2008). Differences like these are due to the varying residence times of seawater solutes; sodium and chloride have very long residence times, while calcium (vital for carbonate formation) tends to precipitate much more quickly. The most abundant dissolved ions in seawater are sodium, chloride, magnesium, sulfate, and calcium. Its osmolarity is about $1000\mathrm{m / l}$ (Millero et al., 2008).
Small amounts of other substances are found, including amino acids at concentrations of up to 2 micrograms of nitrogen atoms per liter which are thought to have played a key role in the origin of life.
The composition of the total salt component is $\mathrm{Cl}^-$ (55%), $\mathrm{Na}^+$ (30.6%), $\mathrm{SO}_2^-$ (7.7%), $\mathrm{Mg}^{2+}$ (3.7%), $\mathrm{Ca}^{2+}$ (1.2%), $\mathrm{K}^+$ (1.1%), and Others (0.7%). Note that the unit of the above composition is in wt/wt, not wt/vol or vol/vol. Sea water elemental composition is given below.
The ocean has a long history of human waste disposal on the assumption that its vast size makes it capable of absorbing and diluting all noxious material (Larson & Carl-Fedrik 2021). While this may be true on a small scale, the large amounts of sewage routinely dumped have damaged many coastal ecosystems, and rendered them life-threatening. Pathogenic viruses and bacteria occur in such waters, such as Escherichia coli, Vibrio cholerae the cause of cholera, hepatitis A, hepatitis E, and polio, along with protozoans causing giardiasis and cryptosporidiosis. These pathogens are routinely present in the ballast water of large vessels, and are widely spread when the ballast is discharged (Larson & Carl-Fedrik 2021).
Nkoro River is in Rivers State in the Niger Delta area of Nigeria. The Salinity, dissolved oxygen, pH, and surface water temperature conditions of this River were studied for a period of one year (January – December 2008), and the following results were obtained (Abovei, 2009) The response of estuarine fishes to changes in salinity, dissolved oxygen, pH and surface water temperature conditions does not only enhance our biological understanding of estuarine fish but contributes to the understanding of the potential effects of anthropogenic impacts on estuarine fish species.
Dissolved oxygen meter of the model: Oxy-Guard Handy MK II was used in measuring dissolved oxygen and temperature. pH was measured using a pH meter (model: Hanna Instrument model No. H1 8915 ATC) while salinity was measured using a saline meter, model: New S-100. for each of the parameters. The probe end of the meter was dipped into the river while the value at the pointer of the scale was read off and recorded. The measurements were taken while inside the canoe along Nkontoru – Job Ama, which is part of the Nkoro river system. Dissolved oxygen (DO) was measured in milligrams per liter (mg/l); temperature in °C (degrees centigrade); and salinity in parts per thousand (ppt). Salinity values ranged from 5% (September) to 17% (February and March). Dissolved Oxygen values ranged from 6mg/l (January, April, July, and October) to 10mg/l (September). pH values ranged from 6.1(August) to 8.5 (November) and Temperature values ranged from $24.0^{\circ}\mathrm{C}$ (July) to $32.0^{\circ}\mathrm{C}$ (March).
Salinity values ranged from $12.8 \pm 0.30$ (%) (Station 4) to $13.3 \pm 0.10$ (%) (Station 3). Dissolved Oxygen values ranged from $3.2 \pm 0.1 \, \text{mg/l}$ (Station 3) to $7.3 \pm 0.16 \, \text{mg/l}$ (Station 1). pH values ranged from $7.3 \pm 0.17$ (Station 1) to $7.7 \pm 0.14$ (Station 3) and Temperature values ranged from $27.3 \pm 0.24$ (Station 1) to $33.7 \pm 0.21$ (Station 3). There was no significant difference in salinity and pH between stations, but dissolved oxygen, and temperature showed significant differences between stations ( $P \# 0.05$ ). The results of the correlation matrix analysis showed a significant correlation between the variables at different stations. The association between the environmental variables in the Nkoro River was generally similar because the water at the stations was seemingly from the same source, the Atlantic Ocean through the Bonny River. A positive association was observed indicating functional similarity. The varying magnitude of the relationship between the water variables in the lower Bonny River of the Niger Delta was attributed to the micro habit difference study of Salinity, Dissolved Oxygen, PH, and surface temperature conditions in the Nkoro River the of Niger Delta.
The study area for this research is Kwale, Nembe, and Kula Rivers.
### a) KWALE
Kwale is the most populous community of the Uwkuani-speaking people of Delta State, Nigeria, and is located within the colonial Warri province (FRN, 2006). Kwale is generally considered a city especially considering its oil and gas reserves which can be utilized to transform the town and neighboring communities into a modern city (Mart Oil Resources Launches New Brand Identity, 2018). Kwale is host to oil and gas companies, some of which have a presence in different parts of the African city such as a gas flow facility which is situated at Ebedei nearby the Umukwuta area, and another at Ebendo and Umusadege with a pipeline running from Aboh and river Ase creek (TheNation, 2018). The location of the Kwale city in the Nigerian map is shown in fig 1.
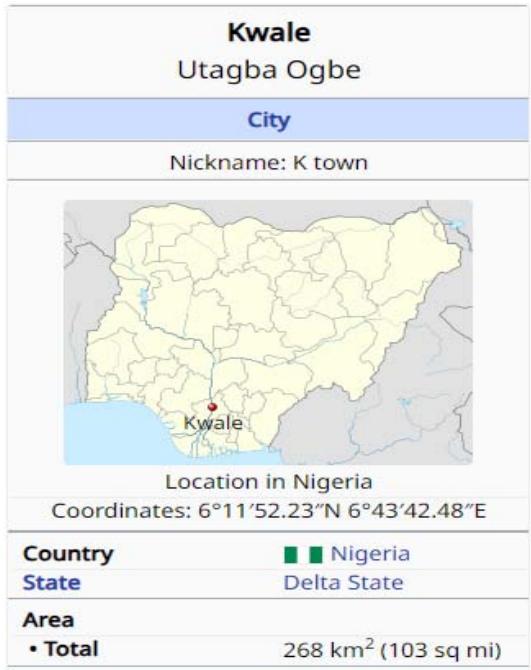 Fig. 1: Location of Kwale on the Nigerian map. (Ukwuani, 2021)
### b) NEMBE
Nembe is the headquarters of the Nembe Local Government of Bayelsa State in Nigeria. Its geographical coordinates are $4^{\circ}32'23''$ North, $6^{\circ}24'$ East (The Bayelsa State Oil & Environmental Commission, 2022). It is a low-lying coastal area in the mangrove swamp rural area of the Niger Delta. The Nembe kingdom hosts international oil and gas companies like SPDC and ENI Nigeria. The presence of these companies has given rights to a lot of oil exploration and exploitation activities (NLGA, 2021). They also lamented years of oil spillages that have destroyed their environment, aquatic life, as well as air and water pollution and called on the Bayelsa State Oil and Environmental Commission (BSOEC) and international communities to come to their rescue (The Guardian Nigeria News, 2019). The location of the Nembe city in the Nigerian map is shown in fig. 2.
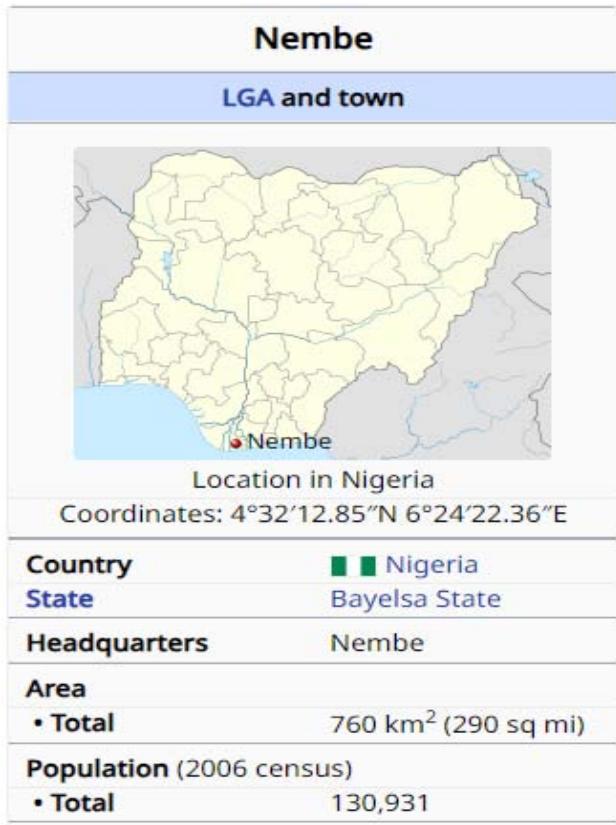 Fig. 2: Location of Nembe on the Nigerian map. (NAD, 2022)
### c) KULA
The Kula tribe of the Ijaw people lives in Akuku Toru Local Government Area, southwestern Rivers State, Nigeria (Talbot, 1932). The Kula people did not originally speak Kalabarias their language but have lost their real language due to trade and close interactions with the Kalabari. The small Kalabari-speaking tribe is sometimes classified as a Kalabari community rather than its tribe (Alagoa, 2001). The tribe seat is the town of Kula (also known as Anyame-Kula or Anyaminama-Kula) founded and established by King Sara. Kula is situated in the southwestern axis of Rivers State of Nigeria – under the Akuku – Toru Local Government Area of Rivers State (Alagoa, 1971). Its geographical coordinates are $4^{\circ}20'$ 29' North and $6^{\circ}38'$ 46" East. It is a low-lying coastal area in the mangrove swamp region of the Niger Delta, with a few feet above the mean sea level, located very close to the Atlantic Ocean (Alagoa, 1964). The location of the Kula city in the Nigerian map is shown in Fig. 3.
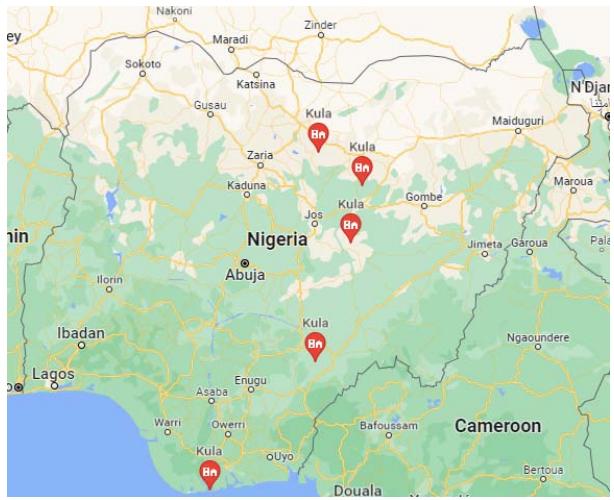 Fig. 3: Location of Kula in the Nigerian map. (Pacheco Pereira, 1505-1520)
This research aims to compare the characteristics of the saltwater in Kwale, Kula, and Nembe water which would form the framework for further research work by scholars on the one hand and enable the marine and construction industry to take the correct decision from the design and conceptual stage of marine projects to be sited as well as marine vessels and equipment to be used in this region in particular and the Niger Delta in general.
## II. MATERIALS AND METHOD
### a) Sample Collection
Saltwater samples were collected from the Rivers in Nembe (Bayelsa), Kula (Rivers), and Kwale
(Delta) as follows. Water sampling bottles were thoroughly washed and dried. The sampling bottles were then dipped into the seawater at sampling points to collect the required volume of the water sample.
Three samples have been collected from each area (Nembe, Kula, and Kwale).
### b) Characterization of Salt Water Samples
The standard methods below were used to characterize the saltwater samples to determine the presence and composition of the marine saltwater components that were relevant to the study and listed in Table 1.
Table 1: Standard Parameters for the Characterization of Salt Water Samples
<table><tr><td>S/N</td><td>Parameters</td><td>Standard Method</td></tr><tr><td>1</td><td>pH</td><td>APHA 4500A</td></tr><tr><td>2</td><td>Temperature</td><td>APHA 4500A</td></tr><tr><td>3</td><td>Dissolved oxygen (DO)</td><td>APHA 4500-0</td></tr><tr><td>4</td><td>Turbidity</td><td>APHA 5.0NTU</td></tr><tr><td>5</td><td>Acidity</td><td>APHA 2310B</td></tr><tr><td>6</td><td>Alkalinity</td><td>APHA 2320B</td></tr><tr><td>7</td><td>Electrical conductivity</td><td>APHA 2510 B</td></tr><tr><td>8</td><td>Salinity</td><td>ASTM D6529</td></tr><tr><td>9</td><td>Oil & grease</td><td>EPA 418.1/413.2</td></tr><tr><td>10</td><td>Total hydrocarbon content (THC)</td><td>EPA 418.1/413.2</td></tr><tr><td>11</td><td>Heavy metals</td><td>AAS UNICAMM 939</td></tr><tr><td>12</td><td>BTEX</td><td>ASTM D3328</td></tr><tr><td>13</td><td>PAH</td><td>ASTM D 3328-78</td></tr></table>
## III. RESULTS AND DISCUSSIONS
The results of the physiochemical and heavy metal characterization of the salt water samples are stated in Table 2, Table 3, Table 4, and Figure 5. The results in Table 2 showed that the salinity of the Kula water sample is highest with a salt concentration of 13,115mg/L (at $30^{\circ}\mathrm{C}$ ) followed by the Nembe water sample with a salt concentration of 2,500mg/L (at $29.68^{\circ}\mathrm{C}$ ) and Kwale with a little salt concentration of 60mg/L (at $28.67^{\circ}\mathrm{C}$ ).
Table 2: Physiochemical and heavy metal characterization of salt water sample (Physiochemistry and heavy metals)
<table><tr><td>S/N</td><td>Parameters</td><td>Method</td><td>Kwale</td><td>Nembe</td><td>Kula</td><td>Dpr Limits</td><td>Fmenv Limits</td></tr><tr><td>1</td><td>pH</td><td>APHA 4500-HB</td><td>7.68</td><td>7.37</td><td>7.26</td><td>6.5-8.5</td><td>6.5-8.5</td></tr><tr><td>2</td><td>Temperature (°C)</td><td>APHA 2550B</td><td>28.67</td><td>29.68</td><td>30.01</td><td>30</td><td>35</td></tr><tr><td>3</td><td>EC(μ/cm)</td><td>APHA 2510B</td><td>122</td><td>1489</td><td>20101</td><td></td><td></td></tr><tr><td>4</td><td>Salinity (Mg/L)</td><td>APHA 25208</td><td>60</td><td>2,500</td><td>13,115</td><td>-</td><td>2000</td></tr><tr><td>5</td><td>DO(Mg/L)</td><td>APHA 4500OC</td><td>5.14</td><td>4.49</td><td>4.85</td><td>10.50</td><td></td></tr><tr><td>6</td><td>Turbidity (NTU)</td><td>APHA 2130C</td><td>10.00</td><td>35.50</td><td>25.50</td><td>10</td><td></td></tr><tr><td>7</td><td>Alkalinity (Mg/L)</td><td>APHA 2320B</td><td>41.00</td><td>35.00</td><td>51.00</td><td></td><td></td></tr><tr><td>8</td><td>Acidity (Mg/L)</td><td>APHA 2310B</td><td>9.00</td><td>0.50</td><td>11.00</td><td></td><td></td></tr><tr><td>9</td><td>(THC) (Mg/L)</td><td>API 45 & EPA 4184/4132</td><td>0.114</td><td>0.410</td><td>0.727</td><td></td><td></td></tr><tr><td>10</td><td>As (Mg/L)</td><td>APHA 3111C</td><td><0.011</td><td><0.011</td><td>0.030</td><td></td><td></td></tr><tr><td>11</td><td>Cd (Mg/L)</td><td>APHA 3111C</td><td>0.009</td><td>0.114</td><td>0.681</td><td>-</td><td>0.5</td></tr><tr><td>12</td><td>Ni (Mg/L)</td><td>APHA 3111C</td><td>0.021</td><td>0.087</td><td>0.059</td><td></td><td></td></tr><tr><td>13</td><td>Fe (Mg/L)</td><td>APHA 3111C</td><td>2.072</td><td>4.424</td><td>10.099</td><td>1</td><td></td></tr><tr><td>14</td><td>Zn (Mg/L)</td><td>APHA 3111C</td><td>1.126</td><td>2.575</td><td>6.037</td><td>01</td><td>0.02</td></tr><tr><td>15</td><td>Hg (Mg/L)</td><td>APHA 3111D</td><td><0.015</td><td><0.015</td><td><0.015</td><td>01</td><td></td></tr><tr><td>16</td><td>Ba (Mg/L)</td><td>APHA 3111D</td><td><0.013</td><td>0.078</td><td>0.145</td><td></td><td></td></tr><tr><td>17</td><td>V (Mg/L)</td><td>APHA 3111D</td><td><0.019</td><td><0.019</td><td><0.019</td><td></td><td></td></tr></table>
Expectedly and as shown in Table 2 the electric conductivity of the three water samples followed the same trend as the salinity with Kula, Nembe, and Kwale water samples having electric conductivity of $20,101\mu \mathrm{S / cm}$ (at $30^{\circ}\mathrm{C}$ ), $1,489\mu \mathrm{S / cm}$ (at $29.68^{\circ}\mathrm{C}$ ), and $122\mu \mathrm{S / cm}$ (at $28.67^{\circ}\mathrm{C}$ ) respectively. This is because the more saline water body contains more quantity of ions that help to conduct charges in the water hence soluble salts are usually added to water to improve the electrical conductivity of the water often used as electrolyte. This is consistent with the work by Fedorov (2002) who established that the salinity of seawater is proportional to the conductivity of the water. The iron content in the three water samples was observed to also follow a similar trend with the Kula water sample having an Iron concentration of $10.099\mathrm{mg / L}$ while Nembe and Kwale water samples had an Iron concentration of $4.424\mathrm{mg / L}$ and $2.072\mathrm{mg / L}$ respectively.
The Polyaromatic hydrocarbon content in the three water samples is shown in Table 3. The result showed that the Nembe water sample has the highest polyaromatic hydrocarbon of $0.969\mathrm{mg / L}$ (with traces of pyrene) followed by the Kwale water sample with $0.705\mathrm{mg / L}$ (with traces of acenaphthylene, phenanthrene, anthracene, and fluoranthene) and the Kula water sample with $0.229\mathrm{mg / L}$ polyaromatic hydrocarbon (with traces of pyrene). One of the main differences in the areas of saltwater is that Kwale water is richer pyrene than those of Nembe and Kula and the inverse is noticed for acenaphthylene, phenanthrene, anthracene, and fluoranthene components.
Table 3: Polyaromatic Hydrocarbon characterization of salts water sample
<table><tr><td>S/N</td><td>Parameters (PAH Components (mg/L))</td><td>Methods</td><td>Kwale</td><td>Nembe</td><td>Kalu</td></tr><tr><td>1.</td><td>Naphthalene</td><td>EPA 8100</td><td>0.006</td><td>0.002</td><td><0.001</td></tr><tr><td>2.</td><td>Acenaphthene</td><td>EPA 8100</td><td>0.004</td><td>0.033</td><td>0.065</td></tr><tr><td>3.</td><td>Acenaphthylene</td><td>EPA 8100</td><td><0.001</td><td>0.013</td><td><0.001</td></tr><tr><td>4.</td><td>Fluorine</td><td>EPA 8100</td><td>0.010</td><td>0.008</td><td>0.012</td></tr><tr><td>5.</td><td>Phenanthrene</td><td>EPA 8100</td><td><0.001</td><td>0.011</td><td>0.013</td></tr><tr><td>6.</td><td>Anthracene</td><td>EPA 8100</td><td><0.001</td><td>0.006</td><td>0.006</td></tr><tr><td>7.</td><td>Fluroanthene</td><td>EPA 8100</td><td><0.001</td><td>0.012</td><td>0.008</td></tr><tr><td>8.</td><td>Pyrene</td><td>EPA 8100</td><td>0.018</td><td><0.001</td><td><0.001</td></tr><tr><td>9.</td><td>Benz (a) anthracene</td><td>EPA 8100</td><td>0.023</td><td>0.029</td><td>0.006</td></tr><tr><td>10.</td><td>Chrysene</td><td>EPA 8100</td><td>0.028</td><td>0.010</td><td>0.008</td></tr><tr><td>11.</td><td>Benzon (b) fluoranthene</td><td>EPA 8100</td><td>0.044</td><td>0.108</td><td><0.001</td></tr><tr><td>12.</td><td>Benzo (k) fluoranthene</td><td>EPA 8100</td><td>0.030</td><td>0.038</td><td>0.010</td></tr><tr><td>13.</td><td>Benzo (a) pyrene</td><td>EPA 8100</td><td>0.031</td><td>0.103</td><td>0.022</td></tr><tr><td>14.</td><td>Indeno (1,2,3-c,d) pyene</td><td>EPA 8100</td><td>0.179</td><td>0.168</td><td>0.023</td></tr><tr><td>15.</td><td>Dibenz (a,h) anthracene</td><td>EPA 8100</td><td>0.170</td><td>0.172</td><td>0.025</td></tr><tr><td>16.</td><td>Benzon (g,h,i) perylene</td><td>EPA 8100</td><td>0.162</td><td>0.250</td><td>0.024</td></tr><tr><td></td><td>Total (Mg/L)</td><td></td><td>0.705</td><td>0.964</td><td>0.229</td></tr></table>
Table 4: Total Petroleum Hydrocarbon, TPH characterization of salts water sample
<table><tr><td>S/N</td><td>Parameters Aliphatic Components (Mg/L)</td><td>Methods EPA 3510C</td><td>Kwale</td><td>Nembe</td><td>Kula</td></tr><tr><td>1</td><td>n-Octane (C8)</td><td>EPA 3510C</td><td><0.001</td><td><0.001</td><td><0.001</td></tr><tr><td>2</td><td>n-Nonane (C9)</td><td>EPA 3510C</td><td><0.001</td><td><0.001</td><td><0.001</td></tr><tr><td>3</td><td>n-Decane (C10)</td><td>EPA 3510C</td><td><0.001</td><td><0.001</td><td><0.001</td></tr><tr><td>4</td><td>n-Undecane (C11)</td><td>EPA 3510C</td><td><0.001</td><td><0.001</td><td><0.001</td></tr><tr><td>5</td><td>n-Dodecane (C12)</td><td>EPA 3510C</td><td><0.001</td><td>0.001</td><td><0.00</td></tr><tr><td>6</td><td>n-Tridecane (C13)</td><td>EPA 3510C</td><td><0.001</td><td>0.001</td><td>0.007</td></tr><tr><td>7</td><td>n-Tetradecane (C14)</td><td>EPA 3510C</td><td>0.005</td><td>0.002</td><td>0.004</td></tr><tr><td>8</td><td>n-Pentadecane (C15)</td><td>EPA 3510C</td><td><0.001</td><td>0.006</td><td>0.006</td></tr><tr><td>9</td><td>n-Hexadecane (C16)</td><td>EPA 3510C</td><td>0.009</td><td>0.002</td><td>0.004</td></tr><tr><td>10</td><td>n-Heptadecane (C17)</td><td>EPA 3510C</td><td><0.001</td><td>0.002</td><td>0.006</td></tr><tr><td>11</td><td>Pristine</td><td>EPA 3510C</td><td><0.001</td><td>0.009</td><td>0.009</td></tr><tr><td>12</td><td>n-Octadecane (C18)</td><td>EPA 3510C</td><td>0.005</td><td>0.003</td><td>0.006</td></tr><tr><td>13</td><td>Phytane</td><td>EPA 3510C</td><td>0.008</td><td>0.010</td><td>0.022</td></tr><tr><td>14</td><td>n-Nonadecane (C19)</td><td>EPA 3510C</td><td>0.009</td><td>0.004</td><td>0.012</td></tr><tr><td>15</td><td>n-Eicosane (C20)</td><td>EPA 3510C</td><td>0.007</td><td>0.002</td><td>0.005</td></tr><tr><td>16</td><td>n-Henelcosane (C21)</td><td>EPA 3510C</td><td>0.011</td><td>0.009</td><td>0.022</td></tr><tr><td>17</td><td>n-Docosane (C22)</td><td>EPA 3510C</td><td>0.011</td><td>0.030</td><td>0.071</td></tr><tr><td>18</td><td>n-Tricisane (C23)</td><td>EPA 3510C</td><td>0.010</td><td>0.047</td><td>0.110</td></tr><tr><td>19</td><td>n-Tetracosane (C24)</td><td>EPA 3510C</td><td>0.015</td><td>0.074</td><td>0.218</td></tr><tr><td>20</td><td>n-Pentacosane (C25)</td><td>EPA 3510C</td><td>0.196</td><td>0.139</td><td>0.502</td></tr><tr><td>21</td><td>n-Hexacosane (C26)</td><td>EPA 3510C</td><td>0.173</td><td>0.077</td><td>0.421</td></tr><tr><td>22</td><td>n-Heptacosane (C27)</td><td>EPA 3510C</td><td>0.031</td><td>0.108</td><td>0.410</td></tr><tr><td>23</td><td>n-Octacosane (C28)</td><td>EPA 3510C</td><td>0.019</td><td>0.246</td><td>0.426</td></tr><tr><td>24</td><td>n-Nonacosane (C29)</td><td>EPA 3510C</td><td>0.061</td><td>0.226</td><td>0.450</td></tr><tr><td>25</td><td>n-Triacontane (C30)</td><td>EPA 3510C</td><td>0.028</td><td>0.397</td><td>0.710</td></tr><tr><td>26</td><td>n-Hentriacontane(C31)</td><td>EPA 3510C</td><td>0.106</td><td>0.302</td><td>0.505</td></tr><tr><td>27</td><td>n-Dotriacontane (C32)</td><td>EPA 3510C</td><td>0.052</td><td>0.197</td><td>0.501</td></tr><tr><td>28</td><td>n-Tritracontane (C33)</td><td>EPA 3510C</td><td>0.015</td><td>0.117</td><td>0.246</td></tr><tr><td>29</td><td>n-Tetratriacontane (C34)</td><td>EPA 3510C</td><td>0.034</td><td>0.235</td><td>0.217</td></tr><tr><td>30</td><td>n-Pentatriacontane (C35)</td><td>EPA 3510C</td><td>0.023</td><td>0.729</td><td>0.254</td></tr><tr><td>31</td><td>n-Hexatriacontane (C36)</td><td>EPA 3510C</td><td>0.021</td><td>0.377</td><td>0.150</td></tr><tr><td>32</td><td>n-Heptatriacontane (C37)</td><td>EPA 3510C</td><td>0.021</td><td>0.191</td><td>0.296</td></tr><tr><td>33</td><td>n-Octatriacontane (C38)</td><td>EPA 3510C</td><td>0.037</td><td>0.031</td><td>0.198</td></tr><tr><td>34</td><td>n-Nonatriacontane (C39)</td><td>EPA 3510C</td><td>0.025</td><td>0.062</td><td>0.062</td></tr><tr><td>35</td><td>n-Tetracontane (C40)</td><td>EPA 3510C</td><td>0.028</td><td>0.052</td><td>0.048</td></tr><tr><td></td><td>Total TPH (Mg/L)</td><td></td><td>1.001</td><td>3.662</td><td>5.450</td></tr></table>
The above result also showed that n-pentacosane concentration is the highest component of the TPH in the Kula and Kwale water sample while n-hexacosane concentration is the highest component of the TPH in the Nembe water sample. This explains why the Nembe water sample is cloudier than the Kwale and Kula water samples.
Table 5 shows the BTEX composition of the three water samples. The result showed that Benzene and Xylene concentrations were highest in the Nembe water sample and lowest in the Kula water sample while the Ethylbenzene concentration was highest in Kwale than Nembe water sample.
Table 5: BTEX components characterization of salts water sample
<table><tr><td>S/N</td><td>Parameters</td><td>Methods</td><td>Kwale</td><td>Nembe</td><td>Kalu</td></tr><tr><td></td><td>BTEX Components</td><td>EPA 8021</td><td></td><td></td><td></td></tr><tr><td>1.</td><td>Benzene</td><td>EPA 8021</td><td>0.14</td><td>0.37</td><td>0.06</td></tr><tr><td>2.</td><td>Toluene</td><td>EPA 8021</td><td><0.01</td><td>0.09</td><td>0.04</td></tr><tr><td>3.</td><td>Ethylbenzene</td><td>EPA 8021</td><td>0.11</td><td>0.04</td><td><0.01</td></tr><tr><td>4.</td><td>(m, p, o)-Xylene</td><td>EPA 8021</td><td>0.15</td><td>0.19</td><td>0.08</td></tr><tr><td></td><td>Total BTEX (Mg/L)</td><td></td><td>0.40</td><td>0.69</td><td>0.18</td></tr></table>
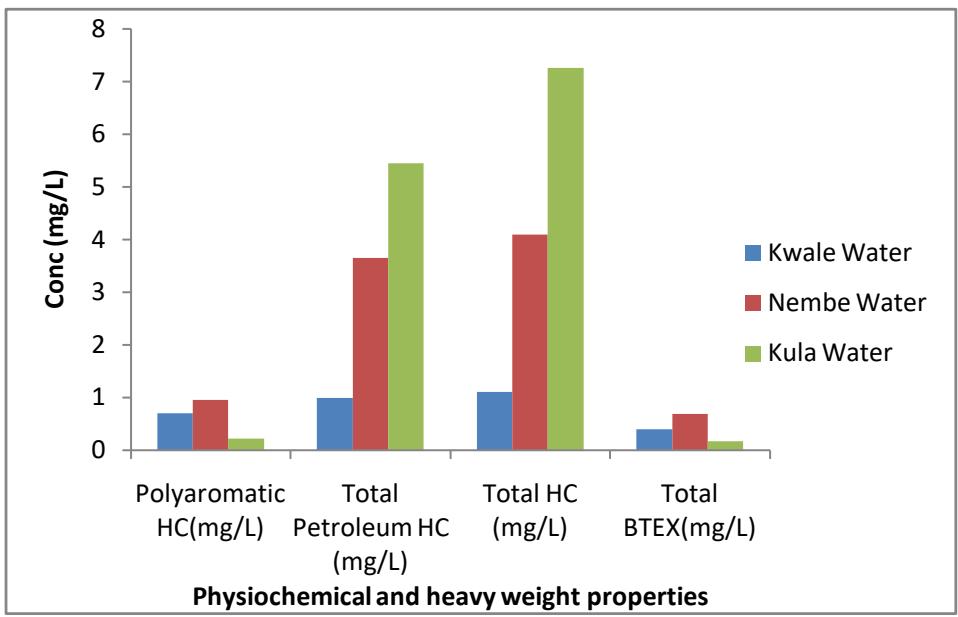 Fig. 4: Initial concentration of the major hydrocarbon family and heavy metal in Kwale, Nembe, and Kula water Samples
Figure 4 is a column chart showing the result summary of the initial composition of the major hydrocarbon family and heavy metal in the three different water samples. The result showed that the aliphatic and poly aromatic hydrocarbon composition in the water samples is highest in Nembe water followed by Kula water while Kwale has the least of these components. But in BTEX composition the total BTEX is highest in Nembe water, followed by Kwale and the least of these components is in Kula water.
## IV. CONCLUSION
The main parameters used in the characterization of Kwale, Nembe, and Kula water bodies are Salinity, electric conductivity, polyaromatic hydrocarbon, and BTEX have shown that these parameters showed that the three water bodies are significantly different from one another even though they are all part of the Niger Delta. The salinity value for Kula River which is closest to the Atlantic Ocean and takes its source from the Atlantic Ocean was shown to have the highest (13,115mg/l at $30^{\circ}\mathrm{C}$ ) followed by Nembe (2,500mg/l at $29.68^{\circ}\mathrm{C}$ ) water body and the least salinity value is from Kwale water body (60mg/l at $28.67^{\circ}\mathrm{C}$ ). This is expected because the closer you are to the ocean the higher its salinity value. Kwale is fresh water with very little salinity value as it is the most distant from the Atlantic Ocean among the three water bodies. The electric conductivity of the three water samples is also consistent with the salinity trend with Kula, Nembe, and Kwale water samples having electric conductivity of $20,101\mu \mathrm{S} / \mathrm{cm}$ (at $30^{\circ}\mathrm{C}$ ), $1,489\mu \mathrm{S} / \mathrm{cm}$ (at $29.68^{\circ}\mathrm{C}$ ), and $122\mu \mathrm{S} / \mathrm{CM}$ (at $28.67^{\circ}\mathrm{C}$ ) respectively. This is expected because electric conductivity is a function of the availability of ions in water which is proportional to the salinity of water. Based on this result corrosion is relatively expected to be highest around the Kula area more than the other two marine environments if all other factors that can cause corrosion remain the same. On the other hand, Kula could be the preferred environment to site a salt-producing industry. The Total Hydrocarbon (THC) content in the Kula water sample is the highest $(0.727\mathrm{mg} / \mathrm{l})$ followed by Nembe $(0.411\mathrm{mg} / \mathrm{l})$ and the least for the Kwale water sample. This may be due to increased oil spill and bunkering activities in the Kula environment with a lot of crude oil production activities followed by Nembe and then Kwale. Among the three water bodies the various hydrocarbon family composition of the three water bodies showed that Polyaromatic hydrocarbon in the Nembe water sample has the highest value of $0.969\mathrm{mg} / \mathrm{l}$ (with traces of pyrene) followed by the Kwale water sample with
0.705mg/l (with traces of acenaphthylene, phenanthrene, anthracene and fluoranthene) and Kula water sample with 0.229mg/l (with traces of pyrene). Interestingly the results also showed that n-pentacosane concentration is the highest component of the Total Petroleum Hydrocarbon (TPH) family in the Kula and Kwale water samples while n-hexacosane concentration is the highest component of the TPH in the Nembe water sample. This explains why the Nembe water sample is cloudier than the Kwale and Kula water samples. Finally, in BTEX composition, the total BTEX is highest in Nembe water, followed by Kwale and the least of these components is in Kula water.
Generating HTML Viewer...
References
15 Cites in Article
(2018). Delta to build three modular refineries.
(2016). Figure 4.5. Aboriginal identity population by both sexes, total - age, % change (2006 to 2016), Canada and census metropolitan areas and census agglomerations, 2016 Census – 25% Sample data.
Wilcox G. I. (2018). Economics of Palm Kernel Oil Processing in Ahoada East Local Government Area, Rivers State, Nigeria.
Lekan Sanni (2022). People’s Perceived Developmental Impacts of Creating States and Local Government Areas in Southwestern Nigeria.
(2019). Oil Spill: Bayelsa communities slam oil firms over neglect.
Charles Oyibo,Walson Paminola,Wakedei Ere,Mary Osoru-Jenkins (2022). SANITATION-SAFETY- PLANNING (SSP), THE NEXUS FOR CLIMATE RESILENCE, SANITION AND HEALTH IN BAYELSA STATE.
Florence Etuwe Oghiator (2021). Affixes in English Language and Ukwuani Language: A Contrastive Study.
K Fedorov (2018). Formula for converting the electrical conductivity of seawater into salinity with digital temperature salinity probe under average ocean conditions.
Apha (2013). Standard Parameters for the Characterization of Saltwater Samples.
R Feistel (2008). A Gibbs function for Seawater Thermodynamics from -6 to 80 o C and Salinity up to 120 g kg-1.
D Larsson,Carl-Fredrik Flach (2021). Antibiotic resistance in the environment.
F Millero,R Feistel,D Write (2008). The Composition of Standard Sea Water and the Definition of Reference Composition Salinity Scale Deep Sea Research Part I Oceanographic Research Papers.
P Pacheco Esmeralda De Situ Orbis.
M Shargawy,V Lienhard,H John,S Zubaer (2010). The Thermo-Physical Properties of Sea Water.
No ethics committee approval was required for this article type.
Data Availability
Not applicable for this article.
How to Cite This Article
Ifeanyi Eddy Okoh. 2026. \u201cComparative Characterization of Saltwater from Kula, Nembe, and Kwale in the Niger Delta, Nigeria\u201d. Global Journal of Research in Engineering - J: General Engineering GJRE-J Volume 24 (GJRE Volume 24 Issue J1): .
Explore published articles in an immersive Augmented Reality environment. Our platform converts research papers into interactive 3D books, allowing readers to view and interact with content using AR and VR compatible devices.
Your published article is automatically converted into a realistic 3D book. Flip through pages and read research papers in a more engaging and interactive format.
Three samples of water from Kwale, Nembe, and Kula in the Niger Delta were collected and characterized, and the following properties: pH, Temperature, Dissolved Oxygen, Turbidity, Acidity, Alkalinity, Electrical conductivity, Salinity, Oil and Grease, Total Hydrocarbon (THC), Heavy metals, BTEX and Poly Aromatic Hydrocarbon (PAH) were determined. The result of some of the key parameters showed that the Salinity of the Kula water sample is highest with a salt concentration of 13,115mg/L (at 30°C) followed by the Nembe water sample with a salt concentration of 2,500mg/L (at 29.68°C) and Kwale with a small salt concentration of 60mg/L (at 28.67°C). The electrical conductivity of the three water samples followed the same trend as salinity with Kula, Nembe, and Kwale water samples having electric conductivity of 20,101µS/cm (at 30°C), 1,489µS/cm (at 29.68°C), and 122µS/cm (at 28.67°C) respectively.
Our website is actively being updated, and changes may occur frequently. Please clear your browser cache if needed. For feedback or error reporting, please email [email protected]
Thank you for connecting with us. We will respond to you shortly.