High throughput genomic data analysis is becoming an increasingly integral part of biomedical research. The information derived from gene expression analysis helps in diagnosing the treatment modality given to the patient. However, the amount of data is humongous and becomes complex to examine manually. Unsupervised machine learning algorithms perform complex tasks on an unlabelled data by clustering to comprehend the underlying structure and behaviour of the pattern. Clustering microarray data, examines the differential expressed genes found by grouping the genes based on the similarity of the expression values. In this study, we propose to elucidate the best clustering algorithm for gene expression data on various clinical conditions. The proposed study was carried on three gene expression datasets of Severe acute respiratory syndrome, Amyotrophic lateral sclerosis and Parkinson’s disease. Differentially expressed genes were found at three p-values 0.01, 0.05, 0.001 and the most significant number of genes were retrieved at p-value 0.05. We experimented the differential expressed genes on three clustering algorithms, namely Hierarchical clustering, k-means clustering and fuzzy clustering of the three diseases. The performance of the three clustering algorithms was evaluated using the internal validity index, wherein Hierarchical clustering was found to be best for gene expression data.
## I. INTRODUCTION
Microarray analysis refers in finding different patterns in the genes expressed under specific situation or in a specific cell and to look for associations between regulation of gene expression levels and phenotypic variations(Tarca AL, Romero R 2006).The advancement of microarrays was utilized to examine large number of genes within a sample in two distinct cell states such as in normal state or diseased state. Microarray used to unravel and observe the genes that change accordingly due to trigger of environmental factors by producing stimulating responses. The expression patterns in microarray are pivotal as it intends to comprehend over the two states i.e., whether a gene is under or over- expressed in a diseased region (Rodriguez-Esteban and Jiang 2017). The differential expressed genes track the patterns or evolution of novel genes in different diseases namely cancer, nervous disorders, and so on. In this study we focus on clustering techniques to capture the behaviour that have the similar patterns and functions by determining if the genes are correlated or dissimilar, or affiliated to the characteristics of the disease(Thalamuthu et al. 2006). We identified the differential expressed genes by using t-test in the control and treated samples of Severe acute respiratory syndrome (SARS), Amyotrophic lateral sclerosis (ALS), and Parkinson's disease (PD). We experimented the differential expressed genes with the three clustering techniques based on connectivity clustering model and centroid clustering such as Hierarchical clustering, k-means clustering and fuzzy clustering. The performance of clustering models was evaluated to comprehend the well-separation using Silhouette coefficient (Rousseeuw 1987). The proposed study approaches to annotate the suitable clustering technique for the different diseases.
## II. METHODS
### a) Experimental design
Each disease is affected by genetic or environmental factors. eneuro degenerative disorders namely PD and ALS and respiratory syndrome namely SARS. The three diseases were studied on, by collecting datasets from Gene Expression Omnibus (GEO) present in National Centre for Biotechnology Information (NCBI). The dataset comprises of two sections, namely the GPL platform and GSE series. We used GPL 201 Affymetrix Human HG-Focus Target Array for all the three diseases consisting of raw gene information. The GSE series provides the sample information for SARS(GSE53394), ALS(GSE41444) and PD (GSE20333). We selected the three gene expression series with primary focus on control and treated samples to interpret the differential expressed genes.
Firstly, the GSE53394series was to investigate the peripheral blood mononuclear cells from the gene expression samples of SARS patients in comparison with the healthy controls (Reghunathan et al. 2005). Here, the differential expressed genes from the SARS patients were not merely caused by the immune response against viral infection but were related to the presence of inherently inflammatory reactions. There was no majority of up-regulated genes leading to the conclusion that the SARS-CoV virus followed unfamiliar approach to avoid the host immune system. Secondly, the GSE20333 series were retrieved from the profiling of gene expression performed on human substantia nigra pars compacta (SNpc) of PDpatients, where the reduced expression of SKP1 gene resulted in the nonfunctioning of protein regulatory in PD patients(Grunblatt et al. 2004). The third gene expression series GSE41444 was based on ALS patients, the affected patients increased the activity of muscle atrophy due to correlated genes present in the gene network and lead to the development of muscle homeostasis(Bernardini et al. 2013).
### b) Dataset
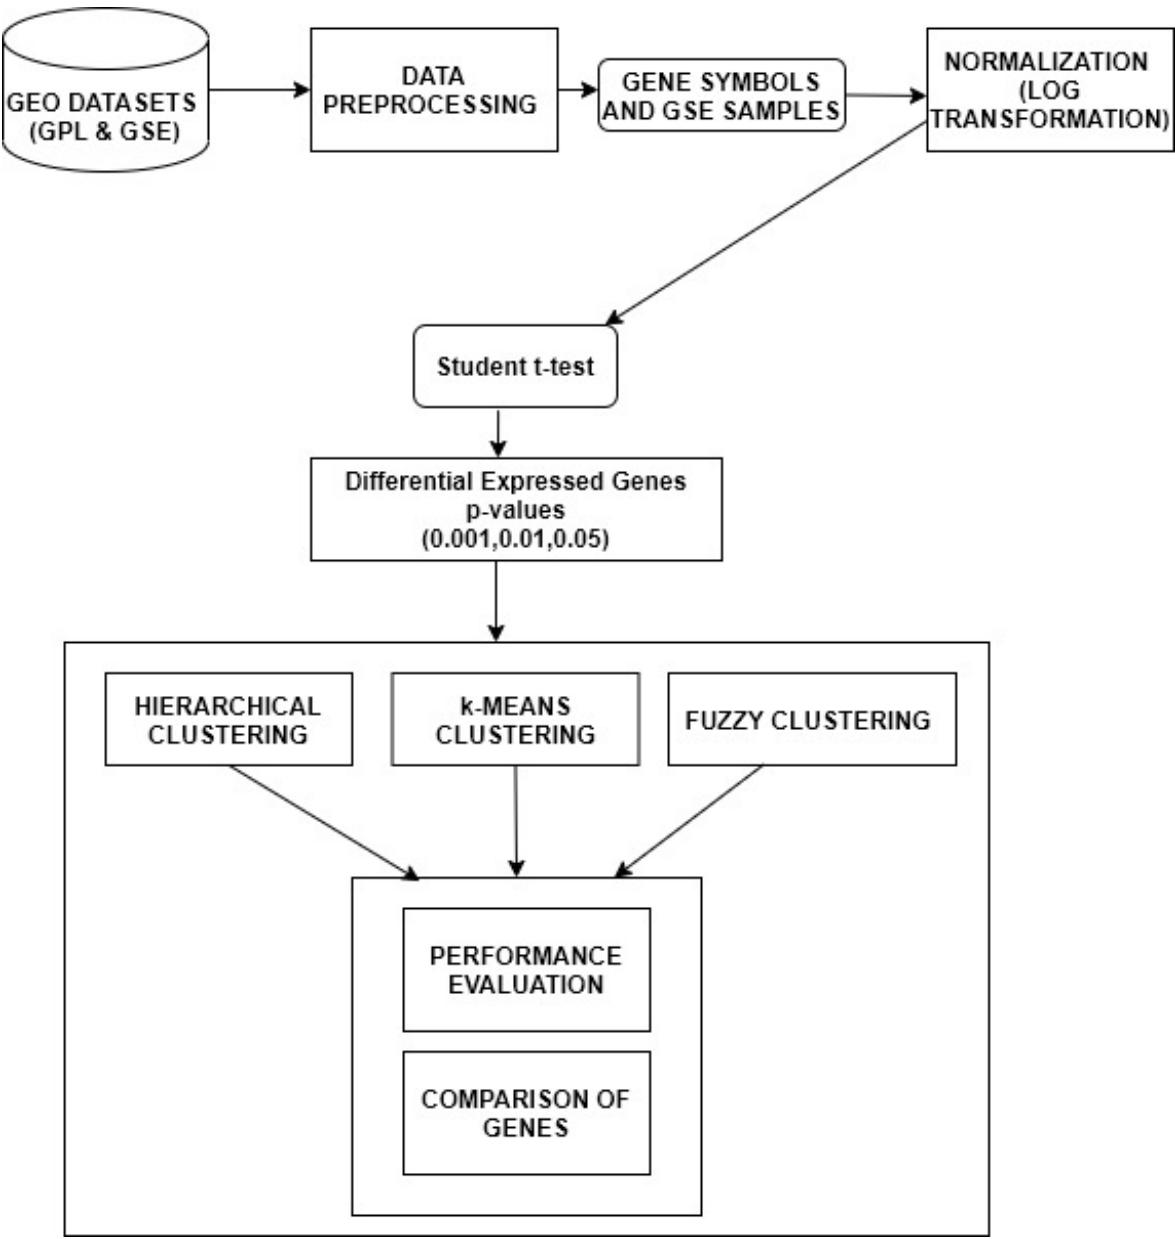
The three diseases were studied on, by collecting datasets from Gene Expression Omnibus (GEO) present in National Centre for Biotechnology Information (NCBI) to perform the gene expression analysis. The flowchart of gene expression analysis is portrayed in Figure 1. The GPL201 was used, which primarily consists of features such as ID, Gene symbols, Gene title, Gen Bank accession etc. But only two features i.e. ID and Gene symbols was selected for the pre-processing phase, since these attributes provide the prior gene information. The data from the GPL201 probe is merged with the GSE samples provides the converged dataset. In order to stabilize the variation of the gene expression levels, the process of normalization is required. Here, the normalization is carried out using $\log_2$ function for the pre-processed data. The normalization is visualized using histograms and box plot to apprehend the variation of intensities of variation before and after normalization (Bengtsson and Hossjer 2006). Normalization is necessary since the measurements hold different scales from different hybridizations(Steinhoff and Vingron 2006). Furthermore, the conversion of multiplicative errors into additive ones is one of the advantages of logarithmic normalization(Cui, Kerr, and Churchill 2003). Following that, the unpaired student t-test is performed on the normalized data to predict the differential expressed genes under the p-values. The unpaired student t-test was applied on the control and treated samples of the three gene expression datasets. The difference between the measurements indicates if a gene expressed is up or down-regulated in a particular disease. Furthermore, the unpaired t-test produces two values t-statistics and p-value in which p-value representing the probability of the observed data under the assumption indicating the null hypothesis is true. During the process, we experimented different levels of p-values at 0.01, 0.05 and 0.001 to observe the differential expressed genes. Additionally, the $\log_2$ fold change was carried out to check and apprehend the up and down regulated genes in the three diseases. In most of the cases, the fold change produces incorrect results due to the inability to capture the differentially expressed genes. The $\log_2$ was illustrated using volcano plots of the up and down regulated genes.
 Figure 1: Flowchart for gene expression analysis
The three clustering algorithms namely Hierarchical Clustering, K-means Clustering, Fuzzy Clustering are applied on differential expressed genes retrieved from p-values and compared using the internal validity index. The comparison is retrieved by taking genes formed under different perspective clusters in three different algorithms. Here, the best clustering algorithm is proposed based on biologically significant genes. Relatively, the three clustering techniques were applied on the differential expressed genes under the three p-values. For instance, the agglomerative strategy pairs the nearby samples first and adds them to the mean of samples and constructs them into clusters in a hierarchy. It merges the closest pair of clusters in order to obtain a single cluster, as it defines the cluster proximity. Similar genes with their respective computed values are ordered and clustered together provide higher expression level (Molla et al. 2004). Hierarchical clustering is visualized using heat maps by displaying the gene symbols providing the variation of intensities of the gene expression samples. The Euclidean distance is the mostly commonly distance measure in the clusters and the linkage criteria such as ward, complete and single was experimented, and complete linkage was chosen to perform well on the three diseases which associates the furthest neighbours. The distance between the two clusters is based on the most distant points in the different clusters $\mathrm{V}_{\mathrm{i}}$ and $\mathrm{V}_{\mathrm{j}}$ respectively. The Euclidean distance can be calculated as,
$$
\left\| a - b \right\| _ {2} = \sqrt {\sum_ {i} (a - b) ^ {2}} \quad \dots \tag {1}
$$
In agglomerative hierarchical clustering, the inter-cluster distance is being premediated in order to determine the distance between two separate clusters. The complete linkage method given by,
$$
\mathrm {d} \left(V _ {\mathrm {i}}, V _ {\mathrm {j}}\right) = \max \left\{\mathrm {d} (x, y) \mid x \in V _ {i}, y \in V _ {j} \right\} \quad \dots \dots \dots \dots \dots \dots \dots \dots \dots \dots \dots \dots \dots \dots \dots \dots \dots \dots \dots
$$
Each dendrogram represents the distance on which the cluster was formed. The dendograms cuts were observed and obtained at $k = 3$ based on the performance of the clusters. The k-means clustering algorithm works by predefining the number of clusters. Firstly, it will choose a random centroid for each data point. The algorithm groups repeatedly until no data point is left alone. Euclidean distance method is the distance used for the clustering the data point and the centroids. The significant genes are assigned to each cluster, and it is repeated until clusters assignments are stable. Here, the algorithm follows the assignment strategy. It defines the cluster centre and assigns the data point to the nearest cluster. The cluster centres are placed as far as possible for the best accuracy. The cluster centres are based on the dataset used. In these datasets, it assigns the genes according to three cluster centres. The iterations take place simultaneously when no more centroids could not move further between the data points. Finally, the squared error function is deployed for minimizing the objective function using the formula,
$$
S (V) = \Sigma \Sigma (\| x i - y j \|) 2 c i j = 1 c i = 1 \dots \tag {3}
$$
The optimal $k$ clusters were determined using the three methods such as elbow technique of total within sum of square, gap-statistics and silhouette score. One of the most popularly known for soft clustering of assigning data points to the cluster centre and influential methods is Fuzzy Clustering algorithm (Bezdek,1981). The algorithm predicts precariousness in the expression levels of the genes and targets the areas of tumour formation (Scaria et al. 2016). The important characteristics of FCM, it calculates based on the weighting components of the data points. It oscillates between 0 and 1 for each cluster formation. Furthermore, when it reaches infinity, the outcomes become the centre. FCM algorithm aids to recognize the patterns clearly, provides a precise interpretation of the genomics data. The FCM algorithm is calculated using the formula,
$$
\mathsf {D} (\cup , \vee) = \Sigma \Sigma (\mu i j) m \| x i - v j \| 2 c j = 1 n i = 1 \dots \dots \dots \dots \dots \tag {4}
$$
## III. RESULTS
The proposed technique has been implemented in the working platform of "R" (version 3.4). The GEO datasets for SARS (GSE53394), PD (GSE20333), ALS (GSE41444) are downloaded in this platform. With respects to the genomic datasets, Hierarchical Clustering, K-means Clustering and Fuzzy Clustering techniques are compared. The up-regulated and down-regulated genes identified using $\log_2$ fold change for the three diseases are depicted in Figure 2. The comparisons between the three clustering algorithms were made using silhouette coefficient. The number of overlaps found in the genes were also represented using Bioinformatics & Evolutionary Genomics Venn diagram tools. Table 1 portrays the number of samples used for each disease using GEO datasets and the number of samples used for each disease taken for experimentation from GEO datasets. It provides the details of number of genes expressed under the p-values 0.05,0.01,0.001 with the respective details of the disease. The performance of clustering for the different diseases were described based on silhouette coefficient for the optimal clusters (Table 2). For the PD, the p-value at 0.001 was not included for the clustering analysis, since there were a smaller number of genes found at this p-value.
Table 1: Observation of genes
<table><tr><td colspan="3">Dataset</td><td colspan="3">p-values</td></tr><tr><td>GEO Samples</td><td>Diseases</td><td>No of samples</td><td>0.001</td><td>0.01</td><td>0.05</td></tr><tr><td>GSE53394</td><td>SARS</td><td>14</td><td>426</td><td>1182</td><td>2293</td></tr><tr><td>GSE20333</td><td>PD</td><td>14</td><td>4</td><td>813</td><td>148</td></tr><tr><td>GSE41444</td><td>ALS</td><td>14</td><td>231</td><td>928</td><td>2469</td></tr></table>
Table 2: Performance of Clustering
<table><tr><td rowspan="2">GEO samples</td><td rowspan="2">Optimal k clusters</td><td rowspan="2">Clustering Algorithms</td><td colspan="3">Silhouette score (p-values)</td></tr><tr><td>0.001</td><td>0.01</td><td>0.05</td></tr><tr><td rowspan="3">GSE53394</td><td>3</td><td>Hierarchical</td><td>0.68</td><td>0.89</td><td>0.90</td></tr><tr><td>3</td><td>k-means</td><td>0.527</td><td>0.691</td><td>0.76</td></tr><tr><td>3</td><td>Fuzzy</td><td>0.341</td><td>0.361</td><td>0.427</td></tr><tr><td rowspan="3">GSE41444</td><td>3</td><td>Hierarchical</td><td>0.439</td><td>0.482</td><td>0.481</td></tr><tr><td>3</td><td>k-means</td><td>0.452</td><td>0.47</td><td>0.49</td></tr><tr><td>3</td><td>Fuzzy</td><td>0.411</td><td>0.452</td><td>0.478</td></tr><tr><td rowspan="3">GSE20333</td><td>3</td><td>Hierarchical</td><td>-</td><td>0.81</td><td>0.93</td></tr><tr><td>3</td><td>k-means</td><td>-</td><td>0.81</td><td>0.87</td></tr><tr><td>3</td><td>Fuzzy</td><td>-</td><td>0.535</td><td>0.526</td></tr></table>
The optimal clusters were experimented on different values at $k = 2$ and $k = 3$ and was chosen based on the elbow technique using the measures of gap statistics, within the sum of squares and performance of clustering. Figure 3 represents the optimal results of hierarchical clustering and provides the details of average silhouette width of each cluster obtained from the three different diseases.
From the results of the three clustering algorithms based on the validation of internal clustering indices, the hierarchical clustering performs well on the optimal cluster $k$ -value than $k$ -means and fuzzy clustering on a gene expression data on all the three different diseases. The fuzzy clustering executed poorly in all the three datasets, and the silhouette score remained relatively low around 0.5, that inherently indicates that soft clustering was not suitable for the gene expression data. With hierarchical clustering achieved the best silhouette score over the range of 0.9 at the p-value of 0.05 were most of the significant genes were retrieved from the two diseases such as SARS and PD and k-means obtained around 0.7- 0.8. For the ALS disease, the silhouette coefficient scored less in all the three clustering algorithms. From this study, it conquers that the connectivity-based clustering models provides the hierarchical analysis of genes on a gene expression data.
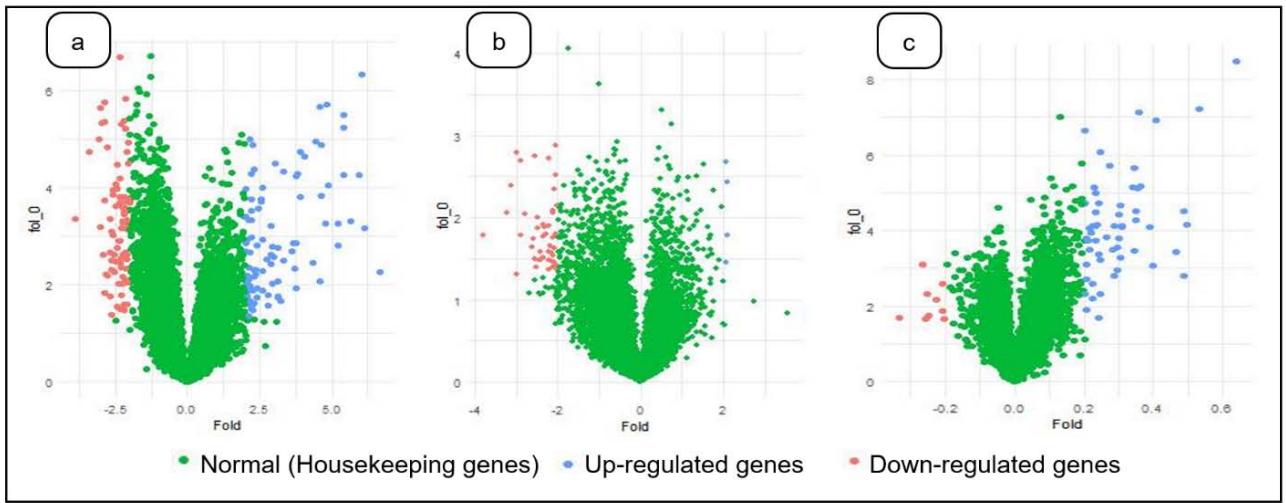 Figure 2: Log $_2$ fold change of a) Severe acute respiratory syndrome, b) Parkinson's Disease and c) Amyotrophic lateral sclerosis
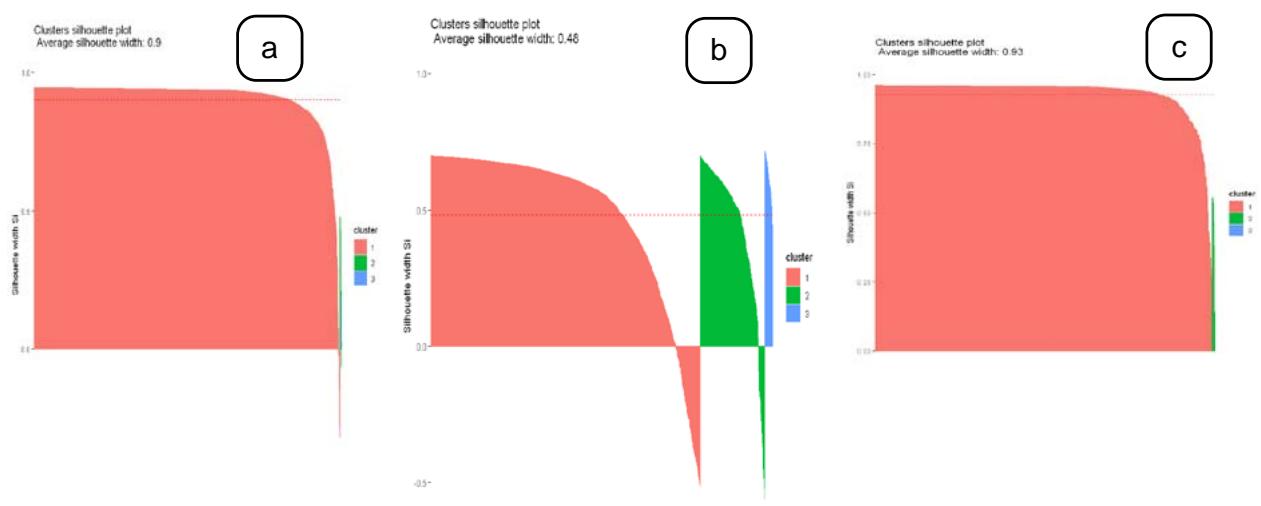 Figure 3: Silhouette scores of hierarchical clustering in a) Severe acute respiratory syndrome, b) Amyotrophic lateral sclerosis and c) Parkinson's Disease
## IV. DISCUSSION
From the study of the three diseases, it's found that the significant number of differentially expressed genes was found to be from the p-value0.05.Comparatively, the hierarchical clustering provides better clustering results using internal validity index. In order to comprehend the hierarchy of differentially expressed genes, whether they fall in the same cluster provides a definite clarity of similar biological functions and aids for the development of drug design. Renji and Manikandan found the genes such as LCN2, LTF and S100A9 were mostly up-regulated genes in the SARS patients (Reghunathan et al. 2005). While analysing the hierarchy of the three up-regulated genes at p-value 0.05 from the clusters, its remarkable that the genes LCN2 and LTF are evident from cluster 1 and fall in the same branch of the hierarchy indicating similarity whereas S100A9 gene was found to be in cluster 2 revealing 11 genes follow the similar biological pattern from cluster 2.
Grunblatt and Mandel in their study of gene expression analysis of PD patients established the genes responsible for degradation and dopamine oxidation(Grunblatt et al. 2004). The main significant genes involved in the process of dopaminergic toxicity were observed under the p-value 0.05 retrieved from the hierarchy at cluster k =3 wasEGLN1 accountable for stress, the reduction of dopamine was related to genes such as ALDH1A1, ARPP-21, and genes that caused the impairment of proteasome subunits namely PSMD8 and PSMA2 occurred on the same cluster i.e cluster 1. From this hierarchy of genes, its quite evident the above genes are similar and contribute to the neuro degenerative disorder. By experimenting the differential expressed genes in ALS disease(Bernardini et al. 2013) at cluster k=3,the correlated genes actively taking part in the mitochondrial metabolism obtained from the former network with the ACTN3 gene by speeding the disease in humans, in addition, PRKARIA, FOXO1 and FBP2fall under the cluster 2, indicating similarity function of the progression of the ALS disease. From the latter gene network, were CHRNA1 and TRIM32 are clustered together specify the critical activity of mitochondrial network. Hence, the differential expressed genes from all the three diseases provide homogenous biological activity and this similarity pattern is highly indicative and structurally evident in gene expression data using hierarchical clustering as compared to centroid clustering algorithms.
## V. CONCLUSION
In the proposed study, our aim was to identify the differential expressed genes, obtained at different levels in a sample. Moreover, the experimental results indicate that the differential expressed genes were enormous at p-value 0.05. All the three clustering algorithms were able to identify differentially expressed genes at p-value (0.01, 0.05 and 0.001). Each clustering algorithm provide specific challenges while grouping the gene expression data. Hierarchical clustering was found to be the suitable clustering algorithm on identifying the biologically significant genes as well as indicating the similar biological functions based on hierarchy of clusters in comparison with K-means and Fuzzy clustering. Thus, Hierarchical Clustering have paved the way for effective retrieval of significant genes in the microarray gene expression data.
### Funding
This work is a non-funded graduate student research.
#### Declarations
Ethics approval- Notapplicable
Availability of data and materials: The datasets used and/or analysed during the current study are available in the NCBI GEO database.
Conflict of interest: The authors declare that they have no conflict of interest.
Generating HTML Viewer...
References
10 Cites in Article
Henrik Bengtsson,Ola Hössjer (2006). Methodological study of affine transformations of gene expression data with proposed robust non-parametric multi-dimensional normalization method.
Camilla Bernardini,Federica Censi,Wanda Lattanzi,Marta Barba,Giovanni Calcagnini,Alessandro Giuliani,Giorgio Tasca,Mario Sabatelli,Enzo Ricci,Fabrizio Michetti (2013). Mitochondrial Network Genes in the Skeletal Muscle of Amyotrophic Lateral Sclerosis Patients.
Xiangqin Cui,M Kerr,Gary Churchill (2003). Transformations for cDNA Microarray Data.
E Gr�nblatt,S Mandel,J Jacob-Hirsch,S Zeligson,N Amariglo,G Rechavi,J Li,R Ravid,W Roggendorf,P Riederer,M Youdim (2004). Gene expression profiling of parkinsonian substantia nigra pars compacta; alterations in ubiquitin-proteasome, heat shock protein, iron and oxidative stress regulated proteins, cell adhesion/cellular matrix and vesicle trafficking genes.
Renji Reghunathan,Manikandan Jayapal,Li-Yang Hsu,Hiok-Hee Chng,Dessmon Tai,Bernard Leung,Alirio Melendez (2005). Expression profile of immune response genes in patients with Severe Acute Respiratory Syndrome.
Raul Rodriguez-Esteban,Xiaoyu Jiang (2017). Differential gene expression in disease: a comparison between high-throughput studies and the literature.
Peter Rousseeuw (1987). Silhouettes: A graphical aid to the interpretation and validation of cluster analysis.
Christine Steinhoff,Martin Vingron (2006). Normalization and quantification of differential expression in gene expression microarrays.
Adi Tarca,Roberto Romero,Sorin Draghici (2006). Analysis of microarray experiments of gene expression profiling.
Anbupalam Thalamuthu,Indranil Mukhopadhyay,Xiaojing Zheng,George Tseng (2006). Evaluation and comparison of gene clustering methods in microarray analysis.
No ethics committee approval was required for this article type.
Data Availability
Not applicable for this article.
How to Cite This Article
Dicky John Davis G. 2026. \u201cComparative Study of Three Clustering Algorithms for Microarray Data\u201d. Global Journal of Science Frontier Research - G: Bio-Tech & Genetics GJSFR-G Volume 22 (GJSFR Volume 22 Issue G1).
Explore published articles in an immersive Augmented Reality environment. Our platform converts research papers into interactive 3D books, allowing readers to view and interact with content using AR and VR compatible devices.
Your published article is automatically converted into a realistic 3D book. Flip through pages and read research papers in a more engaging and interactive format.
Our website is actively being updated, and changes may occur frequently. Please clear your browser cache if needed. For feedback or error reporting, please email [email protected]
Thank you for connecting with us. We will respond to you shortly.