## I. INTRODUCTION
The Body Mass Index (BMI) is used as a screening tool to identify possible weight problems of children and adolescents (1). On the other hand, the Centers for Disease Control and Prevention (CDC) and the American Academy of Pediatrics (AAP) recommend the use of BMI to detect overweight and obesity in children from 2 years of age (2) The Waist-Height Index, has also been suggested as an indicator of overweight and obesity, in children and adolescents, Matos-Imbert et al (3), in a study involving 118 patients, conclude that WHI has predictive value to detect alterations of SBP, PAD and obesity, in children and adolescents. Likewise, Currilem-Gatica et al (4), point out that WHI is a measure that has been incorporated, by correlating with indicators of cardiovascular risk in children and adolescents.
The Body Fat Percentage (BFP) represents a very useful indicator, if it is considered that BMI has the particularity of not providing information about the distribution of body fat, according to Moreno-González (5). This is an aspect of relevance, considering that abdominal fat and the distribution of fat in the body, represent a different risk and is the one that is associated with greater risk of cardiovascular disease, type 2 diabetes mellitus, cancer, among other diseases, in addition, the measurement of fat mass has been important given the growing problems of overweight and obesity, particularly in children and adolescents (6).
Bauce (7) has proposed the Weight-Waist Circumference Index (WWCI) as a useful indicator for diagnosing overweight and obesity in children and adolescents. Likewise, Bauce et al (8) when evaluating the ROC curve for the WWCI, conclude that it is an indicator with high discriminative capacity.
According to figures published by the WHO, the number of children and adolescents, aged between 5 and 19, who are obese, has multiplied by 10 worldwide, in the last four decades, and if this trend continues, according to a study carried out by the Imperial College of London and the World Health Organization, by 2022 there will be more children with obesity (9).
In the case of adolescent children, considered as such those who are between 10 and 19 years old, the WHO defines overweight as the BMI for age with more than one standard deviation above the median established in child growth patterns; and obesity as a BMI greater than two typical deviations above the median established in infant growth patterns (9,10). It also refers to the fact that BMI is considered the most universal, cheap and minimally invasive anthropometric indicator; although there is some reluctance when classifying a child as obese is required, if a direct measure of body fat is not taken into account (11).
In addition, according to UNICEF, in times of pandemic due to covid-19, it is estimated that some 370 million children in the world have lost access to essential meals since the closure of schools; and if no action is taken, the prevalence of childhood wasting can increase by up to $14\%$, equivalent to 6 or 7 million children with this condition (12). In addition, overweight and obesity in adolescents is a problem that increases in many countries, which in the long term generates serious effects, such as exposure to an increased risk of type 2 diabetes, cancer and cardiovascular diseases (10).
In Venezuela, data from the Food and Nutrition Surveillance System (SISVAN) and the National Institute of Nutrition (INN) report an increase in overweight in children aged 7 to 14 years, starting in 2000; and in a study conducted by the INN between 2008 and 2010, their results indicate that in children aged 7 to 12 years, $17.6\%$ are overweight and $9.8\%$ are obese; in children aged 13 to 17 years, $12.0\%$ overweight and $9.3\%$ obese (13). On the other hand, the Comprehensive Treatment Center for Obesity (CitoGroupVe), reveals that the obesity rate fell by a third between 2010 and 2017 due to the economic difficulties of recent years; such a decrease in the rate of obesity from 2011 to the present, went from $24\%$ to $11\%$, while that of overweight went from $30\%$ to $25\%$, and that of morbid obesity went from $1.74\%$ to $0.6\%$, although it does not report on the group that includes children and adolescents (14).
Therefore, this study is of interest to compare indicators of overweight and obesity in adolescents, in order to evaluate them using Body Mass Index (BMI), Waist-Height Index (WHI), Body Fat Percentage (BFP) and Weight-Waist Circumference Index (WWCI), and suggest the one that is most effective in diagnosing overweight and obesity in this age group.
## II. MATERIALS AND METHODS
Descriptive, cross-sectional, prospective and correlational study, based on a sample of 428 adolescents, aged between 13 and 19 years, educational institutions from three regions of Venezuela; of which $56.3\%$ are male and $43.7\%$ female. The variables Age, Weight, Height, Body Mass Index (BMI), Waist-Height Index (WHI), Body Fat Percentage (BFP) and Weight-Waist Circumference Index (WWCI) are considered. Informed consent was requested from the representatives of these adolescents, according to the World Medical Association, WMA (2013), related to the Declaration of Helsinki (15); we talked with the teachers of the institutions, to agree on the day of the visit, at which time we proceeded to make the measurements and obtain the necessary data.
The anthropometric indices were obtained by applying the following formulas:
<table><tr><td>Anthropometric Index</td><td></td><td></td><td>Reference</td></tr><tr><td>BMI</td><td>Quetelet formula</td><td></td><td>16</td></tr><tr><td>WHI</td><td>Carbajal-Azcona</td><td></td><td>17</td></tr><tr><td>BFP</td><td>Deurenberg et al</td><td>PGC = 1.2 x BMI + 0.23 x age - 10.8 x sex - 5.4 Male Sex=1 Female Sex=0</td><td>18</td></tr><tr><td>WWCI</td><td>Bauce et al</td><td></td><td>19-20</td></tr></table>
### Criteria used for classification
Children and adolescents were classified, according to the curves of BMI percentiles for age of the CDC (16) and the Caracas Cross-Sectional Study (17), in order to compare a national reference with an international one.
Classification according to the CDC (2015) ${ }^{(16)}$, you have to malnutrition, BMI $< p5$, (equivalent to Deficit); Healthy weight, $p5 \leq \text{BMI} < p85$, (equivalent to Norm3); Overweight $p85 \leq \text{BMI} < p95$; and Obesity BMI $\geq p95$ (equivalent to Excess BMI $\geq p85$ ).
The values taken as a national reference, according to the Caracas Transversal Study (CTS); are: Deficit, BMI $< p.3$; Normal: $p.3 \leq \text{BMI} < p.97$; Excess: BMI $\geq p.97^{(17)}$.
For the WHI, the values WHI $< 0.50$ Normal and WHI $\geq 0.51$ Risk (18) were considered, and for the WWCI the values corresponding to the percentiles.
For the Body Fat Percentage (BFP), the values suggested by Moreno $^{(19)}$ were taken into account, for the male sex: Low $(\text{BFP} < 10\%)$, Normal $(10\% \leq \text{BFP} < 20\%)$, Overweight $(20\% \leq \text{BFP} < 25\%)$ and Obesity $(\text{BFP} \geq 25\%)$; for females: Low $(\text{BFP} < 20\%)$, Normal
$(20\% \leq \mathrm{BFP} < 30\%)$, Overweight $(30\% \leq \mathrm{BFP} < 35\%)$ and Obesity (BFPC $\geq 35\%$ ).
To evaluate the Weight-Waist Circumference Index (WWCI), as it is a new indicator, the 85th Percentile was assumed as the reference value, which is close to the value of the mean and was classified according to the following categories: Deficit (WWCI< P5); Normal $(\mathsf{P}5\leq \mathsf{WWCl} < \mathsf{P}85)$; Overweight $(\mathsf{P}85\leq \mathsf{WWCl} < \mathsf{P}95)$ and Obesity $(\mathsf{WWC}\geq \mathsf{P95})^{(20 - 21)}$; and their equivalents Deficit (WWCI< P5), Normal $(\mathsf{p}5\leq \mathsf{WWCl} < \mathsf{P}85)$ and Excess (WWCI $\geq$ P85).
In addition, adolescents were classified, according to the indicators, with the same criteria; that is, according to the value of the percentiles and categories suggested by the WHO-CDC (22) to classify BMI; in such a way to compare under the same criterion the classification of the four indicators.
Descriptive statistical measures (mean, deviation, percentage), association (correlations, Chi square) and linear regression, and comparison of means and percentages, by sex and age group, were determined using the Student's t-test for independent samples.
## III. RESULTS
The quantitative analysis, based on the results, allows us to affirm that for the total sample, the averages of the four anthropometric indicators (WHI, WWCI, BMI and BFP) are similar, in the two sexes, with the exception of the BFP that is higher in the female sex. Likewise, the averages of the variables and indicators, compared by sex, are not statistically significant with the exception of the BFP $(p < 0.001)$ (Table 1).
By discriminating these results, by age groups, it is necessary that all the averages, with the exception of the WHI, increase with age (Table 2).
On the other hand, bivariate correlations were obtained between the variables and the indicators, and the results reveal that for the male sex there is a high positive correlation between Weight-Age (0.76); Size-Age (0.83); Weight-Height (0.81); Weight-WWCI(0.74); Weight-BMI (0.84) and moderate negative correlation between WHI-WWCI (-0.61). For the female sex there is a high positive correlation between Weight-Height (0.78); Weight-BMI (0.87); Weight-BFP (0.89); high negative correlation between WHI-WWCI (-0.79); there is also a moderate positive correlation between Age-Weight (0.65); and very high positive correlation between BMI-BFP (0.99). It is observed that for the female sex the Weight-Age and Age-Height correlations are lower; the Weight-BMI and Weight-BFP correlations are greater.
Regressions were obtained between BMI-WWCI, BMI-BFP and BMI-Weight, by sex and all have positive linear regression, with values of the coefficient of determination low in the case of BMI-WWCI; very high in the case of BMI-WWCI male sex, high in BMI-WWCI female; high in the case of BMI-Weight for both sexes (Figure 1).
Table 3 presents the values of the Median BMI and the BFP by age and sex, and it can be observed that they behave in a very similar way, because the values are similar for BMI, except for 18 years which is much higher in the female sex and at 19 years which is much higher in the male sex; in relation to the BFP, it has to behave similarly from 10 to 12 years in the male sex, is less than 13, 14 and 15 years, increases at 16 years, decreases at 17 years and increases from 18 to 19 years; in the female sex it increases from 10 to 16 years, decreases at 17 years, increases at 18 and falls again at 19 years; in addition to all ages, it is higher in the female sex.
The qualitative analysis of the data allows us to affirm that the classification of adolescents, according to each of the indicators, is for BMI according to the two criteria considered, the following:
BMI, according to the WHO/CDC criterion, classifies the total sample of adolescents in the Normal category with a lower percentage than the BMI/CTS criterion (87.8% vs 91.6%), although they turn out to be not significant $(p = 0.072)$; in addition, it classifies a higher percentage in the Excess category (11.2% vs 7.4%), which turns out to be statistically significant $(p = 0.06)$. When comparing the percentages by sex, in the WHO/CDC criterion, it classifies a higher percentage of the female sex in Normal (94.1% vs 83.0%); likewise, it classifies a higher percentage in the Excess category (16.2% vs 4.8%), which turns out to be significant $(p = 0.001)$.
For the BMI/CTS criterion, it must be classified $91.6\%$ in the Normal category, and of them the highest percentage of the female sex (93.5% vs 90.05), which turn out to be non-significant $(p = 0.196)$; in the Excess category it classifies $7.4\%$ and of them a higher percentage in the male sex (9.5% vs $4.8\%$ ) which are statistically not significant $(p = 0.067)$.
For WHI, WWCI and BFP, indicators, all three have to classify the same percentage of the total sample in the Normal category (80.3%; 79.6% and 79.8%); as well as equal percentage in the Excess category (14.5%; 15.5% and 15.0%). When discriminating by sex, the WHI classifies the same percentage in the two sexes (83.0%), and a similar percentage in the Excess category; the WWCI and the BFP classify a percentage in the Higher Normal category in the female sex (85.5% and 61.8%), and in the male sex they classify 75.1% and 52.7%, respectively; while in the Excess category they classify a higher percentage in the male sex (19.1% and 52.7%) (Table 2).
The comparison of these percentages, in the two categories, turns out to be statistically significant, for Normal with the WWCI $(p = 0.008)$ and for Excess $(p = 0.018)$; with the BFP in the Normal category they are significant $(p = 0.059)$ and in the Excess category they are not statistically significant $(p = 0.144)$.
When discriminating by age and sex, it is observed that for the WWCI and BMI indicators the average is higher in the male sex and for the WHI and BFP indicators it is higher in the female sex; in addition, for the WHI, WWCI and BMI indicators the median is higher in the female sex (Table 3).
## IV. DISCUSSION
For the discussion, the concern of the United Nations was taken into account, regarding No communicable Diseases, particularly overweight and obesity, since in May 2013 it convened a meeting with the heads of state, in order to treat the prevalence, morbidity and mortality of non-communicable diseases, which was held on September 19 and 20, 2011, and concluded that these diseases are a threat to the economies of member countries, as well as recognize the importance of assisting countries with fewer resources and intensifying measures taken; they also considered the "European Charter against Obesity, approved in November 2006; the Aruba Convention for Action Against Obesity, June 2011. (23).
In addition to this, there is the fact that the WHO has published figures related to overweight and obesity in children and adolescents, In such a way that in line with this proposal, the results of this work are obtained, which show that the averages of age, weight and height are higher in the male sex; for the WHI and BFP indicators they are higher in the female sex and for the WWCI and BMI indicators they are higher in the male sex. These results differ from those obtained by Ojeda Nahuelcura et al (24), who report similar averages for males and females, in age and weight, and slightly higher weight in males. When classifying them by age group, it is observed that in the group of 10 to 12 years the averages of age, weight, height, BMI, WWCI and BFP are higher in the female sex, and for the WHI they are equal in the two sexes; in the group of 13 to 15 years the average age is equal, weight, height, WHI and WWCI with higher averages in the male sex and for the BMI and BFP higher in the female sex; for the group 16 to 19 years, equal mean age and BMI, higher average in weight, height, WHI in the male sex, and higher in BFP for the female sex.
Regarding the classification of BMI, according to the WHO/CDC criterion, $87.8\%$ of adolescents are classified in the Normal category, and with the CTS criterion $91.6\%$ are classified in the Normal category; both percentages higher than those reported by Duin-Balza et al ${}^{(25)}$; on the other hand, these results are higher than those reported by Ojeda Nahuelcura et al ${}^{(24)}$ in a study of adolescents, with similar average age, who report $38.3\%$ in Normal. In relation to overweight and obesity, the WHO/CDC criterion classifies $11.2\%$ in Excess and the CTS criterion $7.5\%$, while the reference study classifies $48.9\%$ in Excess. Likewise, the average BMI value is $20.8 \pm 3.4 \mathrm{~kg/m^2}$, similar to that obtained by Guerrero et al ${}^{(26)}$, in a study of 150 adolescents from the central region of Venezuela. When discriminating by sex, the averages are similar and not significant ( $21.0 \pm 4.4$ and $20.5 \pm 3.4$ ), slightly higher than those reported by Bauce ${}^{(19)}$ in a sample of 304 schoolchildren, and higher than those obtained by Bauce ${}^{(27)}$ in a study that includes 484 students from Caracas ( $18.7 \pm 3.7$ and $18.6 \pm 3.2$ ). On the other hand, these two criteria classify in Excess $11.2\%$ and $7.5\%$, respectively, percentages that are statistically significant, in addition to those reported by Bauce ${}^{(28).}$. When discriminated by age group, it has to be that for the group of 10 to 12 years the average is $19.0 \pm 3.3 \mathrm{~kg/m^2}$; for group 13 to 15 years $21.3 \pm 4.1 \mathrm{~kg/m^2}$ and for group 16 to 19 years $23.3 \pm 3.3 \mathrm{~kg/m^2}$; values slightly higher than the averages reported by Bauce ${}^{(29)}$ $18.3 \pm 3.4 \mathrm{~kg/m^2}$; $20.14 \pm 2.7 \mathrm{~kg/m^2}$ and $22.3 \pm 3.1 \mathrm{~kg/m^2}$ for the groups 9 to 11 years, 13 to 15 years and 16 or more years, respectively.
Given these results about BMI, in different groups, which have a similar behavior, both for the total and for each sex, in addition to being non-significant differences, it can be said that this indicator remains reliable to evaluate overweight and obesity.
In relation to the WHI it can be observed that the average of the group is $0.45 \pm 0.1$, higher in the female sex, and the statistically significant difference; On the other hand, the WHI classifies $82.9\%$ in Normal and $17.1\%$ in Risk, and when discriminating by sex, it has to classify equal percentages of each sex in Normal, a value that differs from that reported by Matos-Imbert et al (30), who report much lower percentage; in Risk, the WHI classifies similar percentages, although slightly higher in the male sex, which turn out to be lower than those reported by these authors.
It should be borne in mind that according to Sánchez et al (31), the WHI is an indicator that "eliminates the need to compare with a pattern of percentiles, because they remain stable during growth, it does not vary between 6 and 14 years".
Regarding the BFP, the average is higher in the female sex, and the difference is statistically significant $(p < 0.001)$, which coincides with what Bauce (32) obtained in a group under 20 years old, which turn out to be statistically significant. When discriminating by age group, it has to be that for 10 to 12 years, the averages by sex are not significant, while for the groups 13 to 15 years and 16 to 19 years, the difference of the averages by sex if it is statistically significant $(p < 001)$; this result differs from that obtained in a study conducted by Herrera-Cuenca et al (33), which reveals that there is no significant difference between the percentages of obesity prevalence in children and adolescents, obtained by BMI and BFP. Additionally, it has to be that Bauce (7), in a study that included different age groups, it obtained a high correlation between the BFP, obtained by Deurenberg's formula, and the BMI for the group under 20 years and averages with significant difference between sexes. On the other hand, a study carried out by Padilla (34), reveals a correlation of 0.75 between BMI and BFP, while in this study a correlation of 0.99 and a coefficient of determination of 0.9916 have been obtained, which indicates that the variability of BMI is explained by $99.16\%$ by the variability of BFP; this result coincides with that obtained by Bauce in a study that includes 361 children aged 6 to 11 years, and the correlation between BMI and BFP is 0.99 for the male sex and for the female sex (35). In addition, the regressions between the BMI with the BFP and the WWCI, reflect the linear behavior and show the regression coefficient, for each of the two sexes, and behave in a much more homogeneous way than those reported by this same author, which means that these two indicators can be used with confidence to evaluate overweight and obesity in children and adolescents.
In another study conducted by Medina-Bustos et al (36), in which they incorporate the median by age and sex, it was observed that this is very similar in the two sexes, for the WHI, behavior that is the same in this study, with the exception of the age of 15 years, in which the median is higher in the female sex; for the IPCC the median is greater than 10 at 13 years and 15 years, as well as for BMI which is greater at 11, 15 and 18 years and the BFP at 10 and 13 to 19 years, higher in the female sex.
The relationship between BMI and BFP turns out to be stronger in this study, than that obtained by Di Gianfilippo et al (37), since the sex determination coefficient is close to value 1, so for the male sex it is 0.9908 and for the female sex it is 0.9802, which indicates that the variability of BMI is explained by $99.08\%$ and $98.02\%$ by the variability of the PGC, for the male and female sex, respectively.
## V. CONCLUSIONS
It is necessary to emphasize that for the evaluation of anthropometric measurements, the elaboration of indicators is indispensable, the which are combinations of the measurements made in each individual (38), according to this four indicators were identified: BMI, WHI, WWCI and BFP, to evaluate this group of adolescents, and taking into account the results and the discussion, it can be concluded that: BMI remains the most commonly used indicator to assess overweight and obesity.
The WHI, despite being an indicator that eliminates the need to compare with a pattern of percentiles, seems to over evaluate when classifying adolescents at Risk or Excess, both male and female; however, the averages by sex are not significant.
The WWCI, like the WHI, seems over-evaluated when classifying adolescents at Risk or Excess, although the averages by sex are not significant; however, it correlates moderately with BMI, 0.61 and 0.62, for males and females respectively.
The PGC seems to be the indicator that behaves best, since it classifies with percentages similar to those of BMI/CTS, in Excess, both male and female adolescents; In addition, it correlates highly with BMI, 0.99 and 0.89 for male and female respectively, and the averages by sex are statistically significant, as are the percentages, by sex in the Normal and Excess categories. In view of this, the BMI indicators, WWCI and BFP, can be combined, to form a Scale and evaluate groups of adolescents, in a more efficient and reliable way, with overweight and obesity.
To complement, Dr Bull said: "WHO encourages countries to strive to change environmental factors that increase the risk of obesity in our children. More specifically, it is necessary to reduce the consumption of very elaborate foods that are cheap, with high caloric content and low nutritional value. In addition, it is advisable that children devote less leisure time to sedentary activities and that include the use of screens. To this end, it is necessary to promote physical activity through sport and active recreation[^39].
Table 1: Average and deviation of anthropometric variables, by sex and age group
<table><tr><td>Sex</td><td>Age</td><td>Weight</td><td>Height</td><td>BMI</td><td>WHI</td><td>WWCI</td><td>BFP</td></tr><tr><td colspan="8">Muestra total</td></tr><tr><td>Male (n=241)</td><td>13,5±2,7</td><td>51,5±17,0</td><td>154,5±15,5</td><td>21,0±4,4</td><td>0,45±0,1</td><td>0,75±0,3</td><td>12,2±5,5</td></tr><tr><td>Female (n=187)</td><td>11,0±2,2</td><td>38,3±11,7</td><td>149,9±10,7</td><td>20,5±3,4</td><td>0,44±0,1</td><td>0,76±0,3</td><td>22,3±4,4</td></tr><tr><td>Total (n=428)</td><td>13,4±2,8</td><td>49,4±15,3</td><td>152,5±15,6</td><td>20,8±3,4</td><td>0,45±0,1</td><td>0,76±0,3</td><td>16,6±7,3</td></tr><tr><td>p</td><td>0,013</td><td>0,0001</td><td>0,0001</td><td>0,150</td><td>0,465</td><td>0,745</td><td>0,0001</td></tr></table>
Group from 10 to 12 years
<table><tr><td>Sex</td><td>Age</td><td>Weight</td><td>Height</td><td>BMI</td><td>WHI</td><td>WWCI</td><td>BFP</td></tr><tr><td>Male (n=93)</td><td>10,9±0,9</td><td>37,4±09,8</td><td>140,0±09,2</td><td>18,9±3,5</td><td>0,48±0,05</td><td>0,57±0,14</td><td>19,8±4,3</td></tr><tr><td>Female (n=89)</td><td>11,0±0,9</td><td>40,0±10,1</td><td>143,4±10,3</td><td>20,2±3,7</td><td>0,48±0,04</td><td>0,61±0,14</td><td>20,2±3,7</td></tr><tr><td>Total (n=182)</td><td>10,9±0,9</td><td>38,7±09,9</td><td>141,7±09,9</td><td>19,0±3,3</td><td>0,48±0,04</td><td>0,59±0,14</td><td>14,5±6,9</td></tr></table>
Groupfrom 13 a 15 years
<table><tr><td>Male
(n=93)</td><td>13,8±0,7</td><td>54,7±13,1</td><td>158,3±9,4</td><td>21,8±4,7</td><td>0,45±0,04</td><td>0,78±0,16</td><td>13,1±5,7</td></tr><tr><td>Female (n=55)</td><td>13,7±0,8</td><td>49,5±08,1</td><td>154,7±7,4</td><td>22,5±3,3</td><td>0,44±0,04</td><td>0,73±0,10</td><td>22,5±3,3</td></tr><tr><td>Total (n=148)</td><td>13,7±0,8</td><td>52,7±11,7</td><td>157,0±8,8</td><td>21,3±4,1</td><td>0,44±0,04</td><td>0,76±0,15</td><td>16,6±6,7</td></tr></table>
Groupfrom 16 a 19 years
<table><tr><td>Mañé
(n=55)</td><td>17,5±1,2</td><td>69,5±11,6</td><td>172,2±07,2</td><td>23,3±3,3</td><td>0,40±0,08</td><td>1,08±0,48</td><td>15,8±4,1</td></tr><tr><td>Female (n=42)</td><td>17,7±1,4</td><td>57,1±08,1</td><td>157,3±06,0</td><td>23,0±3,4</td><td>0,38±0,11</td><td>1,11±0,59</td><td>26,3±4,2</td></tr><tr><td>Total
(n=97)</td><td>17,6±1,2</td><td>64,4±12,3</td><td>165,9±10,0</td><td>23,3±3,3</td><td>0,39±0,10</td><td>1,10±0,50</td><td>20,4±6,6</td></tr></table>
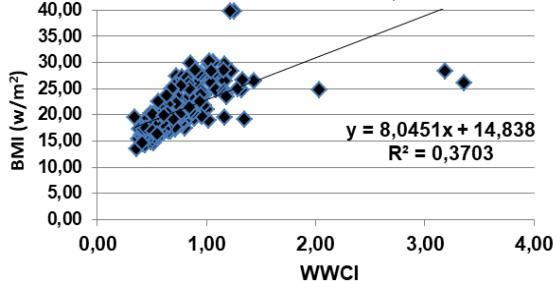 Figure 1-A. Relationship between BMI and WWCI in adolescents, male sex
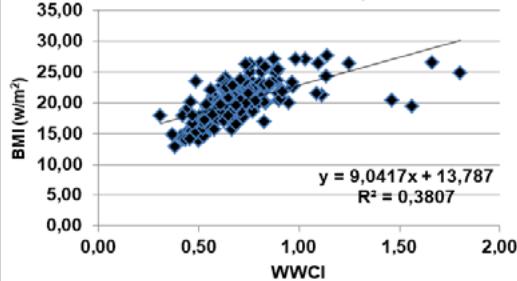 Figure 1-B. Relationship between BMI and WWCI in adolescents, female sex
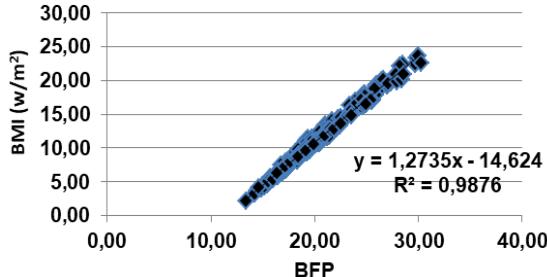 Figure 1-C. Relationship between BMI and BFP in adolescents, male sex
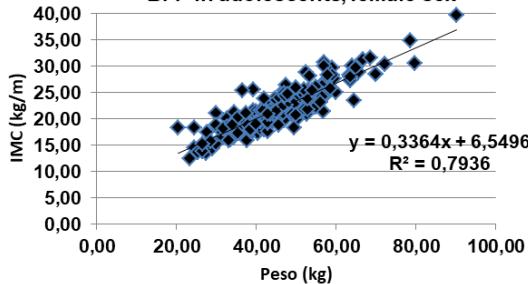 Figure 1-D. Relationship between BMI and BFP in adolescents, female sex
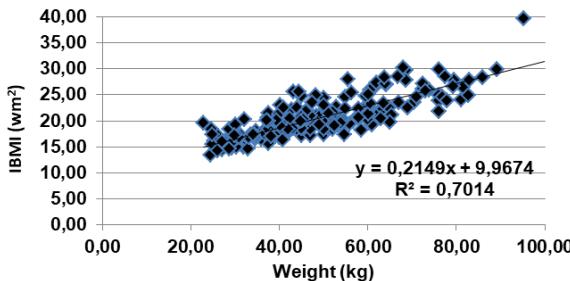 Figure 1-E. Relationship between BMI and Weight in adolescents, male sex
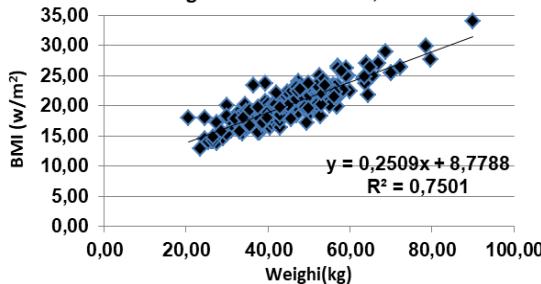 Figure 1-F. Relationship between BMI and Weight in adolescents, female sex Figure 1: Relationship between BMI and indicators WWCI, BFP and Weight, in adolescent by sex
Table 2: Percentage comparison of the classification of anthropometric indicators, according to percentiles, by sex, according to category
<table><tr><td rowspan="2"></td><td colspan="4">Deficit</td><td colspan="4">Normal</td><td colspan="4">Excess</td></tr><tr><td colspan="2">Male</td><td colspan="2">Female</td><td colspan="2">Male</td><td colspan="2">Female</td><td colspan="2">Male</td><td colspan="2">Female</td></tr><tr><td rowspan="2">IMC/Age CDC/OMS</td><td>n</td><td>%</td><td>n</td><td>%</td><td>n</td><td>%</td><td>n</td><td>%</td><td>n</td><td>%</td><td>n</td><td>%</td></tr><tr><td>2</td><td>0,8</td><td>2</td><td>1,1</td><td>200</td><td>83,0</td><td>175</td><td>94,1</td><td>39</td><td>16,2</td><td>9</td><td>4,8</td></tr><tr><td rowspan="2">IMC/Age CCSS</td><td>n</td><td>%</td><td>n</td><td>%</td><td>n</td><td>%</td><td>n</td><td>%</td><td>n</td><td>%</td><td>n</td><td>%</td></tr><tr><td>1</td><td>0,4</td><td>3</td><td>1,6</td><td>217</td><td>90,0</td><td>174</td><td>93,5</td><td>23</td><td>9,5</td><td>9</td><td>4,8</td></tr><tr><td rowspan="2">WHI</td><td>n</td><td>%</td><td>n</td><td>%</td><td>n</td><td>%</td><td>n</td><td>%</td><td>n</td><td>%</td><td>n</td><td>%</td></tr><tr><td>0</td><td>0,0</td><td>0</td><td>0,0</td><td>200</td><td>83,0</td><td>156</td><td>83,9</td><td>41</td><td>17,0</td><td>30</td><td>16,1</td></tr><tr><td rowspan="2">WWCI</td><td>n</td><td>%</td><td>n</td><td>%</td><td>n</td><td>%</td><td>n</td><td>%</td><td>n</td><td>%</td><td>n</td><td>%</td></tr><tr><td>14</td><td>5,8</td><td>7</td><td>3,8</td><td>181</td><td>75,1</td><td>159</td><td>85,5</td><td>46</td><td>19,1</td><td>20</td><td>10,8</td></tr><tr><td rowspan="2">BFP</td><td>n</td><td>%</td><td>n</td><td>%</td><td>n</td><td>%</td><td>n</td><td>%</td><td>n</td><td>%</td><td>n</td><td>%</td></tr><tr><td>92</td><td>38,2</td><td>61</td><td>32,8</td><td>127</td><td>52,7</td><td>115</td><td>61,8</td><td>22</td><td>9,1</td><td>10</td><td>5,4</td></tr></table>
Table 3: Median and standard deviation of BMI and PGC, by age and sex
<table><tr><td colspan="4">Male</td><td colspan="3">Female</td></tr><tr><td>Age</td><td>n</td><td>BMI (kg/m2) Median ± SD</td><td>BFP (%) Mediana ± SD</td><td>n</td><td>BMI (kg/m2) Median ± SD</td><td>BFP (%) Mediana ± SD</td></tr><tr><td>10</td><td>37</td><td>17,23±2,75</td><td>17,58±3,29</td><td>32</td><td>17,90±3,25</td><td>18,38±3,90</td></tr><tr><td>11</td><td>25</td><td>17,53±4,37</td><td>18,17±5,24</td><td>21</td><td>18,84±2,64</td><td>19,74±3,17</td></tr><tr><td>12</td><td>31</td><td>19,98±3,17</td><td>21,34± 3,80</td><td>36</td><td>20,07±2,73</td><td>21,45±3,28</td></tr><tr><td>13</td><td>39</td><td>20,53±4,09</td><td>11,43±4,91</td><td>30</td><td>20,15±2,75</td><td>21,77±3,30</td></tr><tr><td>14</td><td>37</td><td>20,80±2,86</td><td>11,98±3,44</td><td>13</td><td>19,91±2,44</td><td>21,71±2,93</td></tr><tr><td>15</td><td>16</td><td>19,93±8,37</td><td>11,16±10,05</td><td>13</td><td>21,18±2,82</td><td>23,47±3,37</td></tr><tr><td>16</td><td>16</td><td>22,53±3,44</td><td>14,52±4,13</td><td>10</td><td>23,04±2,21</td><td>25,93±2,65</td></tr><tr><td>17</td><td>16</td><td>21,12±3,57</td><td>13,06±4,28</td><td>6</td><td>21,44±2,87</td><td>24,24±3,45</td></tr><tr><td>18</td><td>5</td><td>21,73±2,51</td><td>14,02±3,01</td><td>7</td><td>26,40±2,87</td><td>30,42±4,67</td></tr><tr><td>19</td><td>19</td><td>25,84±2,85</td><td>19,18±3,42</td><td>18</td><td>22,95±3,84</td><td>26,51±4,60</td></tr></table>
Generating HTML Viewer...
References
38 Cites in Article
(2021). Childhood Overweight and Obesity.
Craig Hales,David Freedman,Lara Akinbami,Rong Wei,Cynthia Ogden (2021). Evaluation of alternative body mass index (BMI) metrics to monitor weight status in children and adolescents with extremely high BMI using CDC BMI-for-age growth charts.
M Ángela,Jairo Imbert,Xiomara Blanco Jiménez,Carina Rodríguez,La De,Alina Mota,Noemí Genao,Haydee Acevedo Rodríguez,Cueto,M Oan,Michelle Rosario,Azcona,Y Isi,Hernández (2021). Waist-Height Index and Body Mass Index as predictors of cardiometabolic risk in children and adolescents.
Cristian Curilem-Gatica,Fernando Rodríguez-Rodríguez,Atilio Almagià-Flores,Tuillang Yuing-Farías,Francisco Berral-De-La-Rosa (2016). Ecuaciones para la evaluación de la composición corporal en niños y adolescentes.
Moreno González,M (2010). Waist circumference: an important and useful measurement of cardiometabolic risk.
Arnulfo Ramos-Jiménez,Rosa Hernández-Torres,Miguel Murguía-Romero (2018). Anthropometric equations for the calculation of body fat in young adults.
Gerardo Bauce (2021). Proposal for an Indicator for Overweight and Obesity: Weight Waist Circumference Index (WWCI).
Gerardo Bauce,Mary Moya-Sifontes (2021). Análisis de la curva ROC en la evaluación de indicadores antropométricos.
Paho) (2021). Underweight, short stature and overweight in adolescents and young women in Latin America and the Caribbean. Anthropometric of the adolescent.
Who (2021). Obesity and overweight.
De Onis,Mercedes (2022). Percentiles de peso, talla e índice de masa corporal de escolares de Mendoza. Comparación con la referencia de la Organización Mundial de la Salud.
(2020). Lograr que las ciudades y los asentamientos humanos sean inclusivos, seguros, resilientes y sostenibles.
Inger Padilla (2022). Estudio de prevalencia de sobrepeso-obesidad y factores asociados en escolares de Río Gallegos 2005.
(2019). Centro Integral de Tratamiento para la Obesidad.
Wma (2013). World Medical Association. World Medical Association Declaration of Helsinki Ethical Principles for Medical Research Involving Human Subjects.
Cdc (2000). CDC Growth Charts for the United States: Methods and Developmen.
María Feliu,Inés Fernández,Nora Slobodianik (2013). IMPORTANCIA DE LA NUTRICION EN EL TRASTORNO POR DEFICIT DE ATENCION E HIPERACTIVIDAD (TDAH).
C Moreno (2012). Definición y Clasificación de la Obesidad.
G Bauce (2021). Three indicators for overweight and obesity: BMI, CC and P/CC-index in children and adolescents: Pilot study.
Gerardo Bauce,Moya-Sifontes Mz (2019). Dos fórmulas para calcular el IMC, y su relación con otros indicadores antropométricos en adultos.
Cdc (2000). CDC Growth Charts for the United States: Methods and Developmen.
Naciones Unidas (2011). 65/66. Convocación del cuarto período extraordinario de sesiones de la Asamblea General dedicado al desarme.
Rodrigo Ojeda Nahuelcura,Mauricio Cresp Barría (2011). Correlación entre Índice de Masa Corporal y Circunferencia de Cintura en una Muestra de Niños, Adolescentes y Adultos con Discapacidad de Temuco, Chile.
Duin-Balza Amanda,Sosa-Canache Beatriz,Hernández-Hernández Rafael,Camacho Carlos,Juan Camacho,Carlos (2018). Factores de riesgo cardiovascular en adolescentes.
Guerrero Arkady,Sánchez-Jeager (2009). Índice de Masa Corporal según grado de desarrollo puberal en varones venezolanos.
Gerardo Bauce (2017). Relación entre el IMC, la Circunferencia de Cintura y el Índice de Forma del Cuerpo (ABSI), en niños y adolescentes.
Gerardo Bauce (2022). Obesity in children and adolescents, as measured by BMI and ideal weight: case educational institutions in Caracas, Venezuela. Obesity in children and adolescents, as measured by BMI and ideal weight: case educational institutions in Caracas.
Jesús De La Cruz Llanos,Eduardo Macedo Yacila (2011). Estudio sobre la relación entre el Consumo de Lácteos y el Estado Nutricional (Sobrepeso/Obesidad): Hallazgos encontrados en la cohorte mayor del estudio “Niños del Milenio” (2006-2013), en cuatro países en vías de desarrollo (Etiopía, India, Perú y Vietnam).
Matos Imbert Ángela,M Blanco,Jiménez Jairo,Rodríguez Xiomara,La De,Fernández Carina,Acevedo Genao Alina,Rochits Rodríguez Noemí,Reynoso Cueto Haydee,M Rosario Joan,Jiménez Azcona Michelle,M,Ortiz Hernández Isi,Y (2021). Índice cintura-talla e índice de masa corporal como predictores de riesgo cardiometabólico en niños y adolescentes.
José Guzman Mallqui (2018). Factores de riesgo no modificables e IMC y su relación con el índice cintura/talla en pacientes atendidos en el consultorio de pediatria del Hospital Dos de Mayo. Lima, julio 2013 - febrero 2014.
Gerardo Bauce (2022). Índice de masa corporal, peso ideal y porcentaje de grasa corporal en personas de diferentes grupos etarios.
Velásquez Herrera Cuenca Marianella,Rodríguez Jesús,Berrisbeitia Greta,Abreu Mariela,Zambrano Néstor,Yépez Yajaira,Alex Reina,Axia,Peggy Vergara,Yorde Samar,Karina Samar,Hernández Karina,Pablo (2013). Obesidad en escolares venezolanos y factores de riesgo para el desarrollo de diabetes tipo 2.
Padilla José (2014). Relación del índice de masa corporal y el porcentaje de grasa corporal en jóvenes venezolanos.
José Bauce,G (2022). Comparison of Anthropometric Indicators of Overweight and Obesity, in Children and Adolescents.
Medina Bustos,Marcos,Luizaga Lopez Marcela,Abasto Gonzales Susan,Mamani Ortiz Yercin,Pacheco Luna,Sandra (2017). Masa grasa corporal en escolares y adolescentes en la zona de la Tamborada Cochabamba, Bolivia.
Martha Di Gianfilippo,María José Calvo,Mervín Chávez,Yariana Chacín,Roberto Añez,Joselyn Rojas,Valmore Bermúdez (2013). Prevalencia de sobrepeso y obesidad en escolares de la parroquia Coquivacoa del municipio Maracaibo -Venezuela.
Suverza-Fernández Araceli,Haua Navarro Karime (2010). El ABCD de la Evaluación del Estado de Nutrición.
No ethics committee approval was required for this article type.
Data Availability
Not applicable for this article.
How to Cite This Article
Gerardo Jose Bauce. 2026. \u201cComparison of Anthropometric Indicators of Overweight and Obesity, in Adolescents from Three Regions of Venezuela\u201d. Global Journal of Science Frontier Research - G: Bio-Tech & Genetics GJSFR-G Volume 22 (GJSFR Volume 22 Issue G1).
Explore published articles in an immersive Augmented Reality environment. Our platform converts research papers into interactive 3D books, allowing readers to view and interact with content using AR and VR compatible devices.
Your published article is automatically converted into a realistic 3D book. Flip through pages and read research papers in a more engaging and interactive format.
Our website is actively being updated, and changes may occur frequently. Please clear your browser cache if needed. For feedback or error reporting, please email [email protected]
Thank you for connecting with us. We will respond to you shortly.