

I. INTRODUCTION
Yogurt is considered to be the most well-known milk product in the world (Pomsanam et al., 2014). The advantage of yogurt as one of the functional food is scientifically recognized as having physiological benefits beyond those of elementary nutrition to human health, and this is also giving a reason why it tends to becomes popular today (Weerathilake et al., 2014; McKinley, 2005; Murphy et al., 2015; ohijanheimo and Sandell, 2009).
Furthermore, scientific research indicated that the consumption of the recommended level of milk and dairy products as a part of a healthy diet could contribute and reduce the risk of many diseases (sandholomSarrela 2003). According to Andreson and Gilliland (1999), fermented dairy products and probiotic bacteria decrease the absorption of cholesterol. There are many types of yogurts, but now, the frozen yogurt is most popular in the market (Chandan et al., 2006). Many studies have been conducted about the customer's perception in the various field (Gurnert et al. 2000 and 1996).
The purchasing characteristics of a customer can help in explaining how consumers get satisfaction and become loyal to the product. Therefore, the information about consumer features and satisfaction of yogurt is needed to make accurate decision in the marketing of yogurt. In this regard, various studies have been conducted internationally, however, little attention has been given here in Pakistan. (Wantasenet, al., (2007)) have studied consumer satisfaction of yogurt in Manado. (Hlédik and Lógó, (2017)) had discussed product experiences and consumer preferences related to the selection of yogurt's brand. Similarly, (Košičiarová et al., (2017); Tait et al., (2018)) had worked on the consumer behaviors in the purchase of yogurt. Besides, (Hossain et al. (2012)) was studied the quality comparison and acceptability of yogurt with fruit juices.
(Kusumastuti, 2012) studied the perceptions and buying choice of customers towards yogurt in Malang City, East Java Province, Indonesia. The quantitative data is collected by questionnaires are distributed to 400 respondents. These respondents belong to the rural and urban area of Malang City. It is observed from the Chi-square test that factors such as age, education, occupation, and income level are greatly influencing urban consumers' perception of yogurt in urban areas. Whereas, gender and income level are affecting on consumers 'perception of yogurt in suburban areas.
In the NARC, yogurt is prepared at Animal Sciences Institute (ASI) and is also sold at the PATCO shop in NARC. Unfortunately, no study has been undertaken with regard to consumer perception about yogurt at the Social Science Research Institute (SSRI) of NARC. Based on this background, the present study is designed in collaboration with PATCO, NARC, with the following objectives: To assess yogurt buying and consumption preferences of respondents and also to determine the satisfaction level of respondents who purchase yogurt from PATCO, NARC.
II. MATERIAL AND METHODS
Data for this study is collected through questionnaires, including information such as Socio-economic characteristics of the respondents. Such that the yogurt purchase and preferences, satisfaction level, factors affecting purchase decisions by consumers, and suggestions are required for further improvement. The questionnaires were filled by the customers who visited the PATCO shop at NARC. Only, twenty-seven customers have filled in the questionnaires. Additionally, the Chi-square test was performed to assess the perception of consumers about yogurt. Minitab software was used for analysis.
III. RESULTS AND DISCUSSION
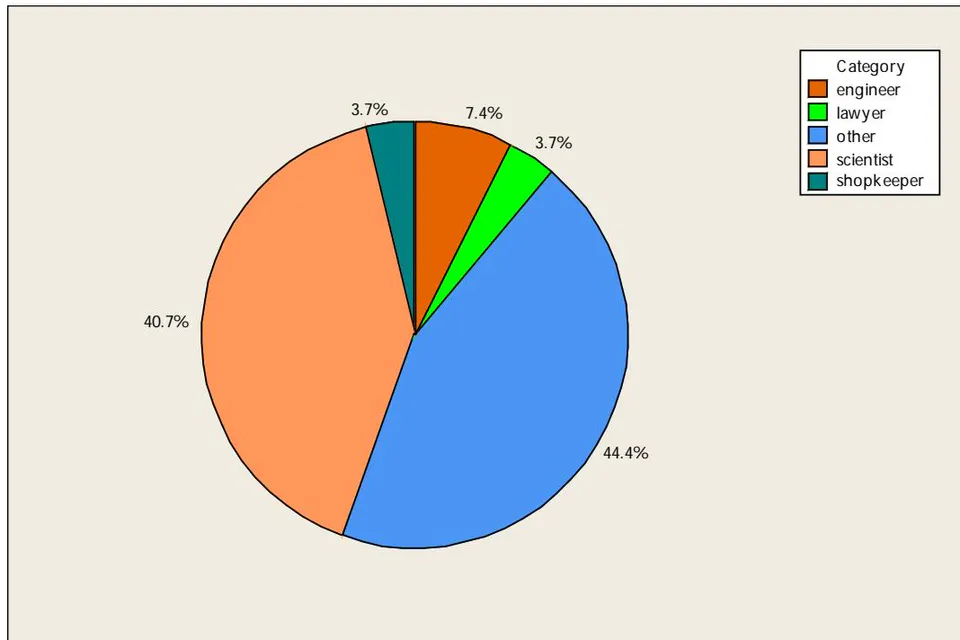
Socio-economic characteristics of respondents are summarized in Table 1. Majority of the respondents are less than 40 years of age. The percentage of male members is a higher than as compared to female members. Mostly, the respondents had higher degree than bachelor's. Almost of the respondents were married. With regards to different professionals, the majority of yogurt buyers were scientists and also belonged to other professions or employment are depicted in Figure 1.
| Age | No | Percent |
| <40 | 17 | 62.96 |
| 41-60 | 4 | 14.81 |
| >60 | 6 | 22.22 |
| Total | 27 | 100 |
| Gender | ||
| Male | 18 | 66.67 |
| Female | 9 | 33.33 |
| Education | ||
| Metric | 3 | 13.64 |
| Inter | 2 | 9.09 |
| Bachelor | 3 | 13.64 |
| Above | 14 | 63.64 |
| Total | 22 | 100 |
| Marital Status | ||
| Married | 22 | 81.48 |
| Unmarried | 5 | 18.52 |
| Total | 27 | 100 |
| Profession | ||
| Engineer | 2 | 7.41 |
| Lawyer | 1 | 3.70 |
| Scientist | 11 | 40.74 |
| Shopkeeper | 1 | 3.70 |
| Other | 12 | 44.44 |
| Total | 27 | 100 |
| NARC | ||
| Employee | 11 | 40.74 |
| No | 16 | 59.26 |
| Yes | 27 | |
| Total |
The respondents' purchase preference for yogurt is depicted in Table 2. The total number of respondents was 27, and out of them, 16 were NARC employees. Among these 27 NARC employees, four purchased yogurt daily, three weekly, and nine of them bought yogurt on some other days. On the other hand, the total number of outsiders was 11, and four of them purchased yogurt daily. Moreover, the same number of NARC employees and outsiders purchased yogurt daily. Two outsiders purchased yogurt weekly, and five of them bought some other time. With regards to the query about the reason for buying yogurt from PATCO, NARC, 7 out of a total of 16 NARC employees responded that they buy it from the PATCO shop because of its taste. On the flip side, nine members answered that they purchase yogurt for its quality and quantity. The majority of NARC employees 15 purchased yogurt for themselves, whereas nine respondents outside NARC reported that they bought it for their own use. In terms of quantity, both NARC employees and outsiders purchased two boxes of yogurt (400 grams per box), whereas; few of the outsiders also bought three boxes. The results of Chi-square indicated no difference in buying behavior of NARC employees and outsiders, because the p-values of the Chi-square test are greater than the level of significance.
Likewise, the preference for yogurt purchase was inquired with regards to having children or not. It was observed that of 18 respondents having children, seven claimed that they purchased yogurt daily, three weekly, and 8 of them purchased it some other time. There was a total of 9 respondents with no children, and only one of them reported daily purchase of yogurt.
Whereas most of them, six respondents bought it on other occasions. Additionally, 18 respondents having children, eight respondents purchased yogurt for its taste, and ten bought for quality. There was almost equal proportion of respondents without children in terms of taste and price preference of yogurt. It was observed that the 11 respondents having children purchased one box at a time.
The Chi-square test values corresponding to the daily and weekly purchases of yogurt as well as for taste and quality preferences are insignificant. Because the p-values of the Chi-square test greater than 5% level of significance. Therefore, we have sufficient evidence to conclude that yogurt buying preferences remain the same as respondents with or without children. Furthermore, the yogurt buying preference concerning having children varies because the Chi-square test value is large and having a p-value of less than 0.01 level of significance.
| NARC Employee | Daily | Weekly | Others | Taste | Quality | Self | Others | Quantity (No) | |||
| 1 | 2 | 3 | |||||||||
| Yes | 4(14.81) | 3(11.11) | 9(33.33) | 7 | 9 | 15 | 1 | 1 | 4 | 0 | |
| No | 4(14.81) | 2(7.41) | 5(18.52) | 6 | 5 | 9 | 2 | 3 | 6 | 2 | |
| Total | 8(29.63) | 5(18.52) | 14(51.85) | 13 | 14 | 24 | 3 | 1 | 10 | 2 | |
| Chi-square value | |||||||||||
| Have children | Daily | Weekly | Others | Taste | Quality | Self | Others | Quantity (No) | |||
| 1 | 2 | 3 | |||||||||
| Yes | 7(38.89) | 3(16.67) | 8(44.44) | 844.44 | 1055.56 | 18(100) | 0 | 11 | 6 | 1 | |
| No | 1(11.11) | 2(22.2) | 6(66.67) | 5(55.56) | 4(44.44) | 6(66.7) | 333.33 | 4 | 4 | 1 | |
| Total | 8(29.63) | 5(18.52) | 14(51.85) | 13(48.5) | 14(51.85) | 24(88.89) | 3(11.11) | 15 | 10 | 2 | |
| Chi-square value | |||||||||||
The preference of yogurt purchase with regards to the level of education is described in Table 3. It is described as 18 respondents are having an education of 14 years. Out of 18 respondents, five purchase yogurt daily, three weekly and ten on some other days. Similarly, the eight respondents buy it for its taste and 10 for quality. Interestingly, 17 respondents purchase yogurt for others, including friends and relatives. If we talk about the quantity of yogurt, we can see that most of the respondents (10) purchase one box of yogurt, whereas six respondents buy two boxes and 2 buy three boxes per visit.
| Education | Daily | Weekly | Others | Taste | Quality | Self | Others | Quantity | ||
| 1kg | 2kg | 3kg | ||||||||
| Matric | 1 | 1 | 1 | 3 | 0 | 2 | 1 | 1 | 2 | 0 |
| Intermediate | 1 | 0 | 1 | 0 | 2 | 1 | 1 | 1 | 1 | 0 |
| Bachelors | 1 | 1 | 2 | 2 | 2 | 0 | 4 | 3 | 1 | 0 |
| Above | 5 | 3 | 10 | 8 | 10 | 1 | 17 | 10 | 6 | 2 |
| Total | 8 | 5 | 14 | 13 | 14 | 4 | 23 | 15 | 10 | 2 |
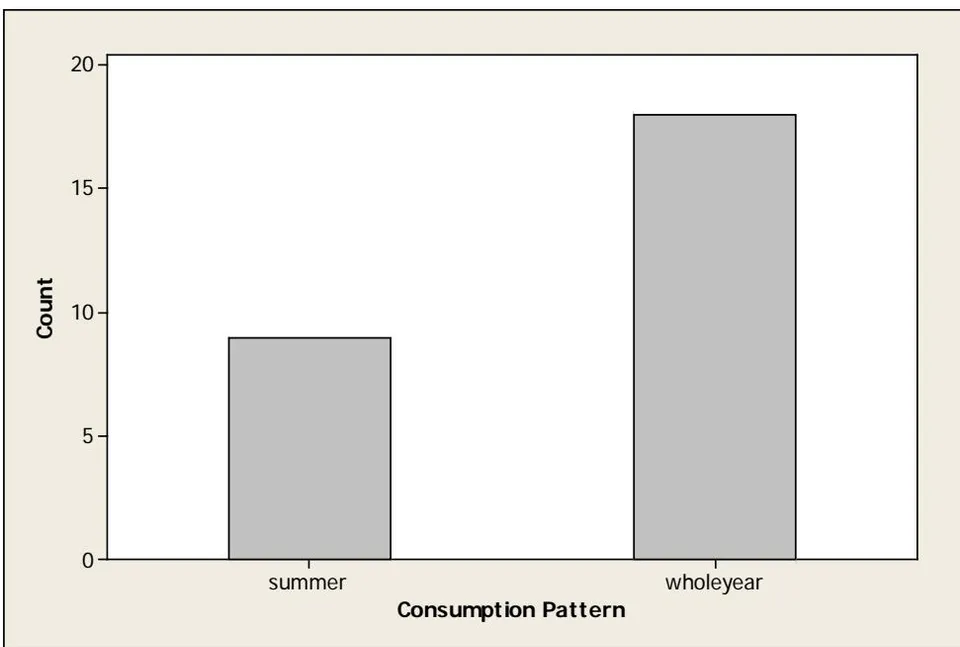
The consumption pattern of yogurt is summarized in Table 4. Mostly, yogurt was consumed by the whole family of NARC employees is 12. Likewise, the majority of outsiders consume yogurt but less than NARC employees (4). It is also apparent from the table that 7 of NARC employees eat yogurt once a day, whereas 4 use it 3 to 6 times a week. On the other hand, the majority (6) of the respondents from outside NARC consume yogurt more than once a day. Also, yogurt is mostly consumed at dinner time by the NARC employees. In contrast, most of the outsiders use it with breakfast or lunch.
| NARC Employees | Yogurt Consumption Pattern | |||||||||
| Male | Female | Whole family | 1 to 2 times a week | 3 to 6 times a week | Once a day | More than once a day | With Breakfast | Lunch | Dinner | |
| Yes | 1 | 3 | 12 | 1 | 4 | 7 | 4 | 5 | 4 | 7 |
| 6.25 | 18.75 | 75 | 6.25 | 25 | 43.75 | 25 | 31.25 | 25 | 43.75 | |
| No | 2 | 0 | 9 | 0 | 3 | 2 | 6 | 5 | 5 | 1 |
| 18.18 | 81.82 | 27.27 | 18.18 | 54.55 | 45.45 | 45.45 | 9.09 | |||
| Total | 3 | 3 | 21 | 1 | 7 | 9 | 10 | 10 | 9 | 8 |
| 11.11 | 11.11 | 77.78 | 3.70 | 25.93 | 33.33 | 37.04 | 37.04 | 33.33 | 29.63 | |
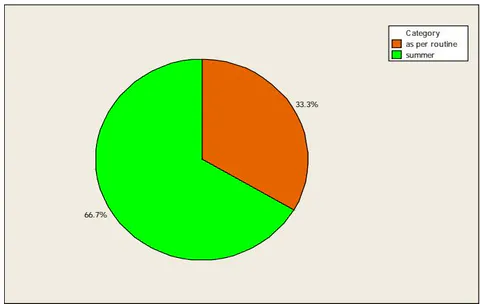
The consumption of yogurt in summer as compared to routine is depicted in Figure 3. It is observed that the consumption of yogurt in summer (66.7%) is higher as compared to as per routine (33.3%).
It is concluded that mostly respondents use yogurt in the summer.
The satisfaction level of respondents about yogurt consumption is illustrated in Table 5. It is apparent from the table that overall acceptance level of yogurt was the most for yogurt buyers from outside NARC (72.27%) highly satisfied. In contrast, yogurt consumers of NARC showed a slightly less satisfaction (68.75%). Similarly, with regards to taste preferences, most of the respondents from NARC (62.50%) were satisfied. However, the low percentage of 54.55% was observed in the high satisfaction levels from outsiders. Additionally, the interest of yogurt buyers in terms of flavor shows that the high percentage of NARC employees is 62.50%, while 54.55% of outsiders were highly satisfied with the flavor. The perception of respondents about price depicted high satisfaction level (72.73%) of yogurt buyers from outside NARC as compared to NARC employees with (62.50%) satisfaction level. Likewise, the opinion of respondents regarding the packing size of yogurt implied a greater percentage (62.50%) of NARC employees as compared to the outsiders with (54.55%) satisfaction level.
| NARC Employees | Overall Acceptability | ||
| Highly Satisfied | Satisfied | Neutral | |
| Yes | 318.75 | 1168.75 | 212.50 |
| No | 872.73 | 218.18 | 19.09 |
| Total | 1140.74 | 1348.15 | 311.11 |
| NARC Employee | Taste | ||
| Highly Satisfied | Satisfied | Neutral | |
| Yes | 531.25 | 1062.50 | 16.25 |
| No | 654.55 | 436.36 | 19.09 |
| Total | 1140.74 | 1451.85 | 27.41 |
| NARC Employee | Flavor | ||
| Highly Satisfied | Satisfied | Neutral | |
| Yes | 531.25 | 1062.50 | 16.25 |
| No | 654.55 | 327.27 | 218.18 |
| Total | 1140.74 | 1348.15 | 311.11 |
| NARC Employee | Appearance | ||
| Highly Satisfied | Satisfied | Neutral | |
| Yes | 531.25 | 1168.5 | 0 |
| No | 872.73 | 218.18 | 19.09 |
| Total | 1348.15 | 1348.15 | 13.70 |
| NARC Employees | Price | ||
| Highly Satisfied | Satisfied | Neutral | |
| Yes | 212.50 | 1062.50 | 425 |
| No | 872.73 | 218.18 | 19.09 |
| Total | 1037.04 | 1244.44 | 518.52 |
| NARC Employees | Packing size | ||
| Highly Satisfied | Satisfied | Neutral | |
| Yes | 212.50 | 1062.50 | 425 |
| No | 654.55 | 327.27 | 218.18 |
| Total | 829.63 | 1348.15 | 622.22 |
IV. CONCLUSION AND RECOMMENDATIONS
The results of this study indicated that most of the 44.4% yogurt buyers belonged to other professions, and 40% were scientists. Chi-square test of significance was employed to test the association between the yogurt buying preferences of NARC employees against the outsiders. The results showed that the buying preferences of NARC employees and outsiders were similar because the Chi-square test value was small, with a P-value greater than 5% level of significance.
Likewise, daily and weekly purchases of yogurt and interest in terms of taste and quality remained the same with or without having children due to low Chi-square test value, and the P-value is greater than 5% level of significance which implied association between the opinions of respondents with regards to buying preference of yogurt. However, the opinions of respondents about whether they purchase yogurt for themselves or others vary because the Chi-square test value is large with a P-value is less than 1% level of significance.
This study shows another interesting finding that most of the respondents had more than 14 years of education. Moreover, the maximum quantity of yogurt was purchased by respondents having above bachelor's degree education. The consumption pattern of yogurt was almost the same for NARC employees and outsiders though the timings of using yogurt varied. NARC employees ate yogurt at dinner time where as outsiders used it in breakfast.
The majority of the respondents were satisfied with regards to the qualitative characteristics of yogurt, for instance, overall acceptance, taste, flavor, price, and packing size. However, few suggestions were made regarding improvement in yogurt quality that it should be maintained, proper packing with good quality packing material, nutritional information should be mentioned, and lastly that PATCO should ensure an adequate supply of yogurt.