This research provides an overview of the transportation system at Alabama A&M University (AAMU) and discusses the Bulldog Transit System (BTS), which operates on campus to facilitate student and staff mobility. The study is being conducted to assess the perspective of AAMU students regarding the performance of the BTS on campus and how it affects their transportation experience. The research questions aim to understand the main transport mode of students, how students perceive the efficiency and effectiveness of the BTS operations, what service(s) students need the BTS to improve in its operation, and the relationship between students’ BTS efficiency rating and drivers’ behaviors/conducts. The study reviewed literature on the importance of public transport, factors that positively influence mode of choice, and the decrease in public transport ridership and a significant shift to private transport and other transport modes. The researcher employed quantitative research methods to collect and analyze data. Simple random sampling was used to distribute questionnaires to undergraduate and graduate students of a university.
## I. GENERAL INTRODUCTION
### a) Introduction
According to the Alabama Agricultural and Mechanical University (AAMU) Campus Master Plan (CMP) of 2014, the Alabama A&M University campus is bounded approximately by Moore Mill Road to the east, Chase Road and J.F. Drake State Technical College to the south, Memorial Parkway to the west, and Industrial Drive to the north.
AAMU secured over 2 million dollars grant from the Federal Transit Authority (FTA) which was used to improve the University's transportation system by creating new parking, re-striping, identify lots, controlled access gates and shuttle service (AAMU CMP, 2014). This aimed at ensuring that people are safe and to reduce accidents on campus (AAMU CMP 2014).
The Bulldog Transit System (BTS) is owned by AAMU Transport Department. Its objective is to make students movement life easier by busing them around the university beautiful campus (AAMU Transport Department Website). The BTS has 15 Bus stops, 8 Bus Stops with Shelter and 1 Transfer Station dotted across campus and residential halls (AAMU Transit Map). The BTS operates five days a week from 7:30am to 10:30pm on Monday through Thursday and 7:30am to 6:30pm on Fridays (AAMU MP 2014). Its movement is scheduled every 15 minutes at each of the bus stops (AAMU MP 2014). The BTS provides special service to the mall and Wal-Mart on Friday afternoon. A research study is being conducted to assess the perspective of AAMU students regarding the performance of the BTS on campus and how it affects their transportation experience.
The noteworthy discoveries of this research will have great importance for campus transportation planning and policy-making. The findings will support universities to design campus transportation systems that are not only efficient but also tailored to the needs and preferences of the campus community. Furthermore, it can have a considerable impact on decisions regarding the enhancement of public transportation services on campus.
### b) Literature Review
Public transport should be encouraged to promote sustainable transport system - they should have a high quality service to attract and satisfy a wide range of passengers (Aydin et al., 2021). Kim and Shaban (2016) conducted research into the influence of bus service satisfaction on university students' mode of choice and revealed that three factors such as bus stop service, bus service, and bus drivers services positively influences mode of choice. They concluded that bus stops that have air condition provide little space that cannot accommodate more than five students on the bench. This makes waiting for bus at the station difficult during summer time when temperature is over $40^{\circ}\mathrm{C}$. The students opt for other alternatives instead of using the bus. University students have a low satisfaction level towards the bus service due to the bad quality of facilities of the buses and bus stations (Hasimah et al., 2021). There has been a decrease in public transport ridership and a significant shift to private transport and other transport modes (Erik & Matej, 2020; Abdallah et al., 2020). Many people use a family car as their predominant source of transportation and only few people use public transportation mode (Marisa et al., 2020).
Campus public bus system has become an important part of university campus transportation system and many universities in their current MPs restrict private vehicular access to campus core and establish Pedestrian Priority Zones that can only be accessed by campus bus system (Clemson University CMP, 2017; Radford University CMP 2020; North Carolina State University CMP, 2023). It is in this particular that the BTS operates on campus to facilitate students and university staff mobility on campus.
### c) Purpose
AAMU students have an option of using the campus BTS to facilitate their mobility on campus. The purpose of this study is to explore students perception about the operations of the campus BTS. The finding will aid students and AAMU transport department to look into the operation of the BTS to adjust its operation policies to maximize operation to better serve the student on and around campus.
## i. Research questions
To understand what the perception of students on BTS is, the research will attempt to find answers to the following research questions
1. What is the main transport mode of students?
2. How do students perceive the efficiency and effectiveness of the BTS operations?
3. What service(s) do students need the BTS to change or add in its operation?
4. What is the relationship between Students BTS Efficiency Rating and DriversBehaviors/Conducts?
Along with other statistical analysis, hypothesis testing of variable will be done to establish relationships to achieve the purpose of this research.
## ii. Hypothesis Testing
1. The null hypothesis states there is no relationship between student's ratings of the BTS efficiency and drivers friendly behavior. i.e. $r = 0$ whereas the research hypothesis says that $r \neq 0$
2. There is no relationship between student ratings of the BTS efficiency and drivers knowledge of Department of Transportation (DOT) safety regulations. i.e. $r = 0$ whereas the research hypothesis says that $r \neq 0$
3. There is no relationship between students' ratings of the BTS efficiency and drivers' excellent communication skills. i.e. $r = 0$ whereas the research hypothesis says that $r \neq 0$
4. There is no relation between students' ratings of the BTS efficiency and drivers excellent driving skills. i.e. $r = 0$ whereas the research hypothesis says that $r \neq 0$
## II. METHODS
### a) Introduction
This chapter introduces us to the methods and procedures to be followed in conducting the research. This study employed the quantitative research method in the collection and analysis of data. Descriptive statistics such as simple frequency distribution, percentages, mean, mode, variance & standard deviation, cross tabulation, graphs and charts will be used in the study. Also correlation and regression analysis will be used to establish relationships between students rating of the BTS efficiency and 4 categories of drivers behaviors.
Descriptive statistics, correlation, and regression analysis were chosen for the study because they offer valuable insights into the relationships between variables and help in understanding patterns and trends in the data. These methods were selected to analyze the data comprehensively, identify patterns, and make informed conclusions based on statistical evidence.
### b) Target Population
The target population of this study involved the entire undergraduate and graduate students of the university. This target population is considered because the BTS was provided particularly to serve them and facilitate their movement on campus. The total of 6,600 students' enrolment for the fall 2023 semester was targeted to get the sample frame of the study.
### c) Sampling Method
reliability of data since every student has equal chance of being selected to answer questionnaire. However, there are also potential drawbacks to consider, such as the risk of sampling bias and the necessity for a sufficiently large sample size in order to ensure representativeness.
### d) Data Collection Techniques
Data collection questionnaire tool was designed using Google forms. It was designed to contain closed ended questions to enable respondents make a choice from variety of alternatives. A link to the questionnaire was shared to the researcher's supervisor and course mates for pilot test and validation before it was shared among the student populace. Students' emails and personal records such as name and phone contacts were not solicited or recorded. This technique ensured the anonymity and confidentiality of respondents.
### e) Data Analysis
Statistical Package for Social Sciences (SPSS) and excel was used for the data analysis. These statistical tool were selected because they offer easily be used to test statistical analysis such as regression, and correlation. In order to make the analyzed data meaningful and easy to interpret, frequency tables, charts, graphs and figures will be used to present the information. Percentages will also be computed to enhance easy understanding of the collected data.
## III. DATA PRESENTATION AND STATISTICAL ANALYSIS
### a) Introduction
This aspect of the research deals with analysis of data and presentation of results.
### b) Demographic Characteristics of Respondents
This aspect deals with the analysis of gender, age category and educational level of the respondents. The results are presented in the table below
Table 1: Gender of respondents
<table><tr><td>Gender</td><td>Frequency</td><td>Percent</td></tr><tr><td>Female</td><td>13</td><td>40.6</td></tr><tr><td>Male</td><td>19</td><td>59.4</td></tr><tr><td>Total</td><td>32</td><td>100.0</td></tr></table>
Table 2: Respondents age category
<table><tr><td>Age Category</td><td>Frequency</td><td>Percent</td></tr><tr><td>Not Responded</td><td>1</td><td>3.1</td></tr><tr><td>15 – 20</td><td>16</td><td>50.0</td></tr><tr><td>21 – 25</td><td>1</td><td>3.1</td></tr><tr><td>26 – 30</td><td>10</td><td>31.2</td></tr><tr><td>31 – 35</td><td>1</td><td>3.1</td></tr><tr><td>36 – 40</td><td>1</td><td>3.1</td></tr><tr><td>46 – Above</td><td>2</td><td>6.2</td></tr><tr><td>Total</td><td>32</td><td>100.0</td></tr></table>
Table 3: Respondents Level of Education
<table><tr><td>Education Level</td><td>Frequency</td><td>Percent</td></tr><tr><td>Doctorate</td><td>5</td><td>15.6</td></tr><tr><td>Freshman</td><td>15</td><td>46.9</td></tr><tr><td>Masters</td><td>11</td><td>34.4</td></tr><tr><td>Sophomore</td><td>1</td><td>3.1</td></tr><tr><td>Total</td><td>32</td><td>100.0</td></tr></table>
### c) Residence and Transport Mode Choice of respondents
This part of the analysis represents the relationship between the off-campus and on-campus residential students in relation to their mode of transport to campus. The results are presented in the bar chart below.
 Figure 1: Residence and Transport Mode Choice of Respondents
### d) Transport Mode and Education Level Cross tabulation
The part analyses the comparison of students' level of education against their mode of transport to campus. The results is presented in the table below
Table 4: Students Transport Mode and Level of Education
<table><tr><td rowspan="2">Transport Mode</td><td colspan="4">Education Level</td><td rowspan="2">Total</td></tr><tr><td>Doctorate</td><td>Freshman</td><td>Masters</td><td>Sophomore</td></tr><tr><td>BTS</td><td>0</td><td>1</td><td>1</td><td>0</td><td>2</td></tr><tr><td>Private Vehicle</td><td>5</td><td>1</td><td>8</td><td>0</td><td>14</td></tr><tr><td>Public Transport</td><td>0</td><td>0</td><td>1</td><td>0</td><td>1</td></tr><tr><td>Walking</td><td>0</td><td>13</td><td>1</td><td>1</td><td>15</td></tr><tr><td>Total</td><td>5</td><td>15</td><td>11</td><td>1</td><td>32</td></tr></table>
### e) Reasons for Transport Mode
This part of the analysis is concerned with understanding the reason why respondents use the transport mode in the above analysis.
Table 5: Reason for Transport Mode
<table><tr><td>Reasons for Transport Mode</td><td>Frequency</td><td>Percent</td></tr><tr><td>It is cost effective</td><td>1</td><td>3.1</td></tr><tr><td>It is fast and convenient</td><td>12</td><td>37.5</td></tr><tr><td>It is fast and convenient; It is cost effective</td><td>2</td><td>6.2</td></tr><tr><td>It is readily available</td><td>5</td><td>15.6</td></tr><tr><td>It is readily available; It is fast and convenient</td><td>4</td><td>12.5</td></tr><tr><td>It is readily available; It is fast and convenient; Itis cost effective</td><td>2</td><td>6.2</td></tr><tr><td>It is readily available; It is fast and convenient; Itis the only option I have. I have no other option</td><td>1</td><td>3.1</td></tr><tr><td>It is readily available; It is the only option I have.I have no other option</td><td>1</td><td>3.1</td></tr><tr><td>It is the only option I have. I have no other option</td><td>4</td><td>12.5</td></tr><tr><td>Total</td><td>32</td><td>100.0</td></tr></table>
### f) Respondents' Choice of Transport Mode and their Reason
The section analysis seeks to understand why participants use the particular mode of transport to school. The result is presented in the table below.
Table 6: Reason for the Choice of Transport Mode
<table><tr><td rowspan="2">Reason for Transport mode choice</td><td colspan="4">Transport Mode</td><td rowspan="2">Total</td></tr><tr><td>BTS</td><td>Private Vehicle</td><td>Public Transport</td><td>Walking</td></tr><tr><td>It is cost effective</td><td>0</td><td>0</td><td>1</td><td>0</td><td>1</td></tr><tr><td>It is fast and convenient</td><td>1</td><td>7</td><td>0</td><td>3</td><td>11</td></tr><tr><td>It is fast and convenient; It is cost effective</td><td>0</td><td>2</td><td>0</td><td>0</td><td>2</td></tr><tr><td>It is fast and convenient; It isn't really convenient but the BTS can be quite slow</td><td>0</td><td>0</td><td>0</td><td>1</td><td>1</td></tr><tr><td>It is readily available</td><td>0</td><td>0</td><td>0</td><td>5</td><td>5</td></tr><tr><td>It is readily available; It is fast and convenient</td><td>0</td><td>2</td><td>0</td><td>2</td><td>4</td></tr><tr><td>It is readily available; It is fast and convenient; It is cost effective</td><td>0</td><td>1</td><td>0</td><td>1</td><td>2</td></tr><tr><td>It is readily available; It is fast and convenient; It is the only option I have. I have no other option</td><td>0</td><td>1</td><td>0</td><td>0</td><td>1</td></tr><tr><td>It is readily available; It is the only option I have. I have no other option</td><td>0</td><td>0</td><td>0</td><td>1</td><td>1</td></tr><tr><td>It is the only option I have. I have no other option</td><td>1</td><td>1</td><td>0</td><td>2</td><td>4</td></tr><tr><td>Total</td><td>2</td><td>14</td><td>1</td><td>15</td><td>32</td></tr></table>
### g) BTS Effectiveness
This section attempts to gauge students thinking about the BTS serving its purpose effectively. The question was asked as follows "The BTS goal is to ensure students' safety and to make students' lives on campus easier by busing them around the university's beautiful campus. Do you think the BTS is serving its purpose effectively?" The results of the responses are presented below in a line graph
BTS Effectiveness Figure 2: Students perception about the BTS serving its purpose effectively
### h) Rating of the Efficiency of the BTS
Students were asked to rate the efficiency of the BTS operations on a scale of 1 to 5 where; 1 means strongly efficient, 2 means fairly efficient, 3 means I am neutral, 4 means fairly inefficient, and 5 means strongly inefficient. The result is presented below.
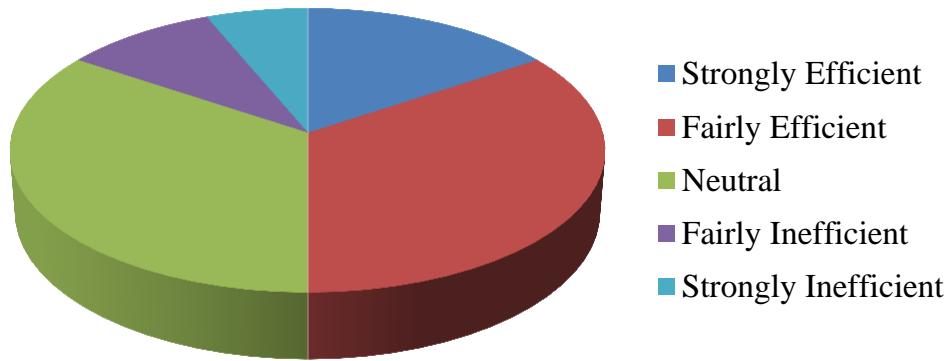 Figure 3: Students Rating of the Efficiency of the BTS Operations
### i) BTS Improvement Recommendation
Students were asked to recommend areas that they think need to improve in the BTS operations. A set of possible recommendations were given for them to select and the results is presented in the table below.
Table 7: Respondents' Recommendation for Improvement in the BTS operations
<table><tr><td>Recommendation</td><td>Frequency</td><td>Percent</td></tr><tr><td>Develop app for students to track bus daily schedule</td><td>10</td><td>31.2</td></tr><tr><td>Establish more Stations, and create new routes</td><td>6</td><td>18.8</td></tr><tr><td>Provide regular off-campus services</td><td>8</td><td>25.0</td></tr><tr><td>Reduce the waiting time at the station</td><td>4</td><td>12.5</td></tr><tr><td>Renovate Bus Stations with Shelter</td><td>4</td><td>12.5</td></tr><tr><td>Total</td><td>32</td><td>100.0</td></tr></table>
### j) Students' Recommendation for BTS Improvement Based on their Residence
The analysis further explored to understand how students will recommend for the BTS operation improvement based on their place of residence - i.e. those residents on campus and off-campus housing using cross tabulation. The result is presented in the table below.
Table 8: Students Recommendation for BTS Improvement based on their residence
<table><tr><td>Recommendation</td><td>Frequency</td><td>Percent</td></tr><tr><td>Develop app for students to track bus daily schedule</td><td>10</td><td>31.2</td></tr><tr><td>Establish more Stations, and create new routes</td><td>6</td><td>18.8</td></tr><tr><td>Provide regular off-campus services</td><td>8</td><td>25.0</td></tr><tr><td>Reduce the waiting time at the station</td><td>4</td><td>12.5</td></tr><tr><td>Renovate Bus Stations with Shelter</td><td>4</td><td>12.5</td></tr><tr><td>Total</td><td>32</td><td>100.0</td></tr></table>
### k) Students Rating of BTS Drivers' Behavior/Conduct
On a scale of strongly agree, Agree, Neutral, Disagree, and strongly Disagree, students were asked to rate the BTS drivers behavior/conduct on variables including Drivers are Friendly, Know DOT safety regulations, Have excellent communication, and Have excellent driving skills.
Table 9: Students Rating of BTS drivers' behavior/conduct
<table><tr><td>Driver behavior</td><td>Strongly Agree</td><td>Agree</td><td>Neutral</td><td>Disagree</td><td>Strongly Disagree</td><td>Total</td></tr><tr><td>Drivers are Friendly</td><td>18(56.2%)</td><td>7(21.9%)</td><td>6(18.8%)</td><td>1(3.10%)</td><td>0(0.0%)</td><td>32(100%)</td></tr><tr><td>Drivers know DOT safety regulations</td><td>17(53.1%)</td><td>8(25.0%)</td><td>7(21.9%)</td><td>0(0.00%)</td><td>0(0.00%)</td><td>32(100%)</td></tr><tr><td>Drivers have excellent communication skills</td><td>14(43.8%)</td><td>8(25.0%)</td><td>10(31.2%)</td><td>0(0.00%)</td><td>0(0.00%)</td><td>32(100%)</td></tr><tr><td>Drivers have excellent driving skills</td><td>19(59.4%)</td><td>9(28.1%)</td><td>4(12.5%)</td><td>0(0.00%)</td><td>0(0.00%)</td><td>32(100%)</td></tr><tr><td>Total</td><td>68(53.1%)</td><td>32(25.0%)</td><td>27(21.1%)</td><td>1(0.8%)</td><td>0(0.00%)</td><td>128(100%)</td></tr></table>
### i) Regression Analysis of Students BTS Efficiency Rating Based on Drivers Behavior
This section uses regression analysis and Analysis of Variance (ANOVA) to test hypothesis and determine the relationship between Students BTS Rating (X) based on their perception of the Drivers behavior (Y). Using excel to run the statistical analysis, the results is presented in the table below.
Table 10: Regression Statistics of Students BTS ratings (X) and Drivers are friendly (Y)
<table><tr><td colspan="2">Regression Statistics</td></tr><tr><td>Regression coefficient (r)</td><td>0.589999</td></tr><tr><td>Coefficient of Determination (r2)</td><td>0.348099</td></tr><tr><td>Coefficient of non-determination</td><td>0.651901</td></tr><tr><td>Standard Error</td><td>0.735210</td></tr><tr><td>Intercept(a)</td><td>0.428571</td></tr><tr><td>Slope (b)</td><td>0.491289</td></tr><tr><td>Observations (N)</td><td>32</td></tr><tr><td>Regression equation model</td><td>Ŷ = 3.71 + 0.41x</td></tr></table>
i. Hypothesis Testing of Drivers Friendly behavior (Y) The null hypothesis states there is no relationship between student ratings of the BTS efficiency and drivers friendly behavior i.e. $r = 0$ whereas the research hypothesis says that $r \neq 0$
Table 11: ANOVA Summary Table for drivers' friendly behavior data
<table><tr><td></td><td>df</td><td>SS</td><td>MS</td><td>F</td><td>Significance F</td></tr><tr><td>Regression</td><td>1</td><td>8.66</td><td>8.66</td><td>16.02</td><td>0.00037932</td></tr><tr><td>Residual Error</td><td>30</td><td>16.22</td><td>0.54</td><td></td><td></td></tr><tr><td>Total</td><td>31</td><td>24.87</td><td></td><td></td><td></td></tr></table>
Table 12: Regression Statistics of Students BTS ratings (X) and Drivers knowledge of DOTsafety regulations (Y)
<table><tr><td colspan="2">Regression Statistics</td></tr><tr><td>Multiple Regression Coefficient (r)</td><td>0.461341146</td></tr><tr><td>Coefficient of Determination (r2)</td><td>0.212835653</td></tr><tr><td>Coefficient of Non-determination</td><td>0.787161347</td></tr><tr><td>Standard Error</td><td>0.7400913</td></tr><tr><td>Intercept (a)</td><td>0.785714286</td></tr><tr><td>Slope (b)</td><td>0.351916376</td></tr><tr><td>Observations</td><td>32</td></tr><tr><td>Regression Equation Model</td><td>Ŷ = 0.79 + 0.35X</td></tr></table>
## ii. Hypothesis Testing of Drivers DOT Safety Knowledge Behavior (Y)
Null Hypothesis: There is no relationship between student ratings of the BTS efficiency and drivers knowledge of DOT safety regulations i.e. $r = 0$ whereas the research hypothesis says that $r \neq 0$.
Table 13: ANOVA Summary Table for drivers' road safety knowledge data
<table><tr><td colspan="2">Regression Statistics</td></tr><tr><td>Regression Coefficient (r)</td><td>0.087552871</td></tr><tr><td>Coefficient of Determination (r2)</td><td>0.007665505</td></tr><tr><td>Coefficient of non-determination</td><td>0.992334495</td></tr><tr><td>Standard Error</td><td>0.953750467</td></tr><tr><td>Intercept (a)</td><td>1.428571429</td></tr><tr><td>Slope (b)</td><td>0.076655052</td></tr><tr><td>Regression Equation Model</td><td>Ŷ = 1.43 + 0.08X</td></tr><tr><td>Observations</td><td>32</td></tr></table>
Table 14: Regression Statistics of Students BTS ratings (X) and Drivers' communication skills(Y)
<table><tr><td colspan="2">Regression Statistics</td></tr><tr><td>Regression Coefficient (r)</td><td>0.087552871</td></tr><tr><td>Coefficient of Determination (r2)</td><td>0.007665505</td></tr><tr><td>Coefficient of non-determination</td><td>0.992334495</td></tr><tr><td>Standard Error</td><td>0.953750467</td></tr><tr><td>Intercept (a)</td><td>1.428571429</td></tr><tr><td>Slope (b)</td><td>0.076655052</td></tr><tr><td>Regression Equation Model</td><td>Ŷ = 1.43 + 0.08X</td></tr><tr><td>Observations</td><td>32</td></tr></table>
## iii. Hypothesis Testing of Drivers Excellent Communication Skills
There is no relationship between students' ratings of the BTS efficiency and drivers excellent communication skills i.e. $r = 0$ whereas the research hypothesis says that $r \neq 0$
Table 15: ANOVA Summary table for Drivers Excellent Communication Skills
<table><tr><td></td><td>df</td><td>SS</td><td>MS</td><td>F</td><td>Significance F</td></tr><tr><td>Regression</td><td>1</td><td>0.210801394</td><td>0.210801394</td><td>0.231741573</td><td>0.633728395</td></tr><tr><td>Residual</td><td>30</td><td>27.28919861</td><td>0.909639954</td><td></td><td></td></tr><tr><td>Total</td><td>31</td><td>27.5</td><td></td><td></td><td></td></tr></table>
Table 16: Regression Statistics of Students BTS ratings (X) and Drivers' excellent driving skills
<table><tr><td colspan="2">Regression Statistics</td></tr><tr><td>Regression coefficient (r)</td><td>0.436078899</td></tr><tr><td>Coefficient of Determination (r2)</td><td>0.190164806</td></tr><tr><td>Coefficient of non-determination</td><td>0.809835194</td></tr><tr><td>Standard Error</td><td>0.65655809</td></tr><tr><td>Intercept (a)</td><td>0.785714286</td></tr><tr><td>Slope (a)</td><td>0.290940767</td></tr><tr><td>Regression Equation Model</td><td>Y = 0.79 + 0.29X</td></tr><tr><td>Observations</td><td>32</td></tr></table>
## iv. Hypothesis Testing of Drivers Excellent Driving Skills
There is no relation between students' ratings of the BTS efficiency and drivers excellent drivingskills i.e. $r = 0$ whereas the research hypothesis says that $r \neq 0$
Table 17: ANOVA Summary table for Drivers Excellent driving Skills
<table><tr><td>df</td><td></td><td>SS</td><td>MS</td><td>F</td><td>Significance F</td></tr><tr><td>Regression</td><td>1</td><td>3.036694251</td><td>3.036694251</td><td>7.044574296</td><td>0.012595765</td></tr><tr><td>Residual</td><td>30</td><td>12.93205575</td><td>0.431068525</td><td></td><td></td></tr><tr><td>Total</td><td>31</td><td>15.96875</td><td></td><td></td><td></td></tr></table>
## IV. DISCUSSIONS
### a) Introduction
This part of the research discusses the findings of the analysis and results in the data presentation and statistical analysis sections.
### b) Discussion of Demographics
The data presented in Table 1 reveals that out of the total respondents, $59.4\%$ were males, whereas $40.6\%$ were females. Moving on to Table 2, which highlights the age distribution of the respondents, it was found that $50\%$ of the respondents fell under the age group of 15-20, which was the modal class. This suggests that most respondents were young adults who had just entered the early stages of adulthood. The age group of 26-30 had 10 respondents, representing $31.2\%$ of the total, indicating that a significant portion of the respondents belonged to the age group that is typically considered to be in the prime of their lives. On the other hand, the age group of 46 and above had only 2 respondents, representing $6.2\%$ of the total. This suggests that there were very few respondents who were older adults. The remaining age groups of 21-25, 31-35, and 36-40 had 1 respondent each, representing $3.1\%$ of the total. It is worth mentioning that one respondent did not provide their age, which could impact the overall findings.
Moreover, Table 3 provides insights into the respondents' education level. It was found that $46.9\%$ of the respondents were first-year students, indicating that most were in their first year of college or university. This suggests that the sample was comprised primarily of first-time college students. In addition, $34.4\%$ were master's students, indicating that a significant portion of the respondents were pursuing graduate-level studies. Furthermore, $15.6\%$ were pursuing a doctorate, meaning that a few respondents were in the final stages of their academic careers. Interestingly, only $3.1\%$ were sophomores, which suggest that very few respondents were in their second year of college or university. No respondents were at a junior or senior level, which indicates that first-year and graduate-level students dominated the sample.
### c) Discussion of the Residence and Transport Mode Choice of Respondents
In examining the Figure 1 bar chart, it is evident that a significant proportion of students who reside in on-campus residential apartments (44%) prefer to walk to campus, while only a small percentage (6%) use the BTS. Only one respondent uses a private vehicle. In contrast, most off- campus residential students (41.1%) generally use private cars to commute to campus, with only one using public transport and another student walking to campus.
From these findings, it can be concluded that on-campus students prefer walking over utilizing the bus system to commute to campus. In contrast, off-campus students favor private means of transport over public transport.
The implications of the on-campus preference for walking could mean increased active mobility on campus, which could help prevent the creation of heat islands as fewer vehicles are used. This aligns with the active mobility objectives outlined in the 2014 campus master plan of the university and the net zero policy of the Huntsville city plan. However, this approach also presents serious concerns related to pedestrian safety, as it combines pedestrian mobility with vehicular traffic on campus. Overall, these findings could inform transportation policies and decisions on infrastructure development, such as bike lanes, pedestrian walkways, or bike-share services to promote sustainable and active mobility on campus while reducing carbon emissions and promoting a healthier lifestyle for students.
### d) Discussion of the Transport Mode and Education Level Cross tabulation
Based on the data presented in Table 4, it is evident that the preferred mode of transportation to campus varies among different academic levels. Most freshmen students, comprising 13 out of 15 respondents, equivalent to $87\%$, prefer walking to campus. In contrast, only one student each, which accounts for $7\%$, uses the BTS or private vehicles. Interestingly, none of the doctorate students use any other mode of transportation except for private vehicles, while almost $73\%$ of the master's students, comprising eight out of eleven respondents, prefer using private vehicles. Out of all the master's students, only one student each, which is equivalent to $9\%$, opt for the BTS, public transportation, and walking, respectively. As for sophomores, the only respondent included in the data prefers to walk to campus.
In conclusion, the data suggests that first-year students usually walk to campus. In contrast, students at higher academic levels, such as master's and doctorate students, tend to prefer using private vehicles. The data also indicates that the BTS and public transportation are not popular choices among the respondents.
### e) Discussion of the Reasons for Respondents' Transport Mode
According to the findings presented in Table 5, a majority of 12 students, which accounts for $37.5\%$ of the total respondents, stated that they use their current mode of transport because it is fast and convenient. Additionally, 5 students $(15.6\%)$ mentioned that the reason for their current mode of transport is that it is readily available. 4 students $(12.5\%)$ reported that they use their current transport mode because it is readily available, fast, and convenient, whereas another 4 students $(12.5\%)$ stated that they use it because they have no other option.
Furthermore, 2 students $(6.2\%)$ selected each of the following categories: "it is fast and convenient; it is cost-effective" and "It is readily available; it is fast and convenient; it is cost-effective". These findings provide valuable insights into the factors that influence students' transportation decisions.
### f) Discussion of Respondents' choice of Transport Mode and their Reason
According to the findings presented in Table 6, it can be deduced that out of all the respondents, only two of them use the BTS as their mode of transportation to campus. One of the respondents indicated that using BTS was their only option and that it is fast and convenient. On the other hand, among the 14 students who use a private mode of transport, seven of them (47%) believe that it is fast and convenient, while two of them (13%) mentioned that it is cost-effective. An additional two students (13%) stated that private transport is readily available. The only student who uses public transportation thinks that it is cost-effective.
Furthermore, when it comes to students who prefer walking to the campus, the majority of five students (33%) considered walking as a readily available mode of transportation, while three students (20%) found it fast and convenient. Interestingly, one student who walks to the campus indicated that it is faster than the BTS.
To sum up, the research findings suggest that students prioritize fast movement and convenience when selecting their mode of transportation to campus. It also shows that there is a perception among students that the BTS is relatively slow. Perceptions of BTS speed are crucial as they impact the overall satisfaction and usage of public transportation services on campus.
Addressing concerns about speed can lead to improvements in service frequency, route optimization, and overall efficiency, enhancing the attractiveness of public transportation as a viable option for campus commuters.
### g) Discussion of Student Perception of BTS Effectiveness
According to the results depicted in Figure 2, most students surveyed have a positive perception of the BTS. Out of the total number of respondents, which was 32, 19 students $(59.38\%)$ answered "yes" when asked if they believe the BTS is serving its purpose effectively. On the other hand, 11 students $(34.38\%)$ answered "maybe," while only 2 students $(6.25\%)$ answered "no." These results suggest that the general consensus among students is that the BTS is functioning well and serving its intended purpose.
However, it is important to note that the number of students who participated in the survey may not necessarily represent the views of the entire student population. Additionally, even though the BTS is perceived to be effective, the low number of students who use it suggests a need for further promotion or improvements to increase its usage.
### h) Discussion of Students' Rating of the Efficiency of the BTS
From the figure 3, $11(34.4\%)$ think the BTS operations is fairly efficient, while another $11(34.4\%)$ indicated they are indifferent. $5(15.6\%)$ think its operation is strongly efficient. Only 5 disagree and indicated it is fairly inefficient $(9.4\%)$ and strongly inefficient $(6.2\%)$. Therefore, this finding suggests that students think generally the BTS operation is efficient.
### i) Discussion of BTS Improvement Recommendation
According to the findings presented in Table 7, the majority of the surveyed students, comprising $31.2\%$ or 10 students expressed their desire for the BTS management to develop an app that would enable them to track the daily schedule and movement of the buses. $25\%$ or 8 students, on the other hand, opined that BTS should provide regular off-campus services. $18.8\%$ or 6 students suggested that the management should establish more stations and create new routes. Meanwhile, $12.5\%$ or 4 students each wanted the management to reduce the waiting time at the stations and renovate the bus stations with proper shelter.
Based on these results, there is a strong demand among the students for the development of an app to track the movement schedules of the buses, as well as for the provision of regular off- campus services. Such an app can provide real-time information on transportation schedules, routes, and vehicle locations, improving the overall convenience and efficiency of campus transportation services. Integrating technology-driven solutions like tracking apps can enhance user satisfaction and promote the use of sustainable transportation modes.
The data obtained from Table 8 shows that $46.7\%$, which is equivalent to 7 out of the 15 students who stay off-campus, are in favor of the BTS providing regular off-campus services. This suggests that a significant proportion of off-campus students rely on private transportation as there are currently no reliable regular off-campus services available. Furthermore, $26.7\%$ of the off-campus students (4 in number) recommend developing an app that can help them track the daily movement schedule of buses.
Meanwhile, $20\%$ (3 students) suggest that the bus stations should be renovated to provide shelter, and only $6.7\%$ (1 student) recommend reducing the waiting time at the stations.
On the other hand, the majority of on-campus residential students, which is $35.3\%$ (6 in number), recommended developing an app that can help track the daily movement schedule of buses. They also suggested establishing more service stations and creating new routes. Additionally, $17.6\%$ (3 students) of the on-campus residential students recommended reducing the waiting time at the stations. In comparison, only $5.9\%$ (1 student) recommended providing off-campus services and renovating bus stations with shelter.
From this analysis, we can infer that students who stay on campus want more service stations and routes and an app to track bus movement. This is because they might not be able to track the whereabouts of buses, and would rather walk than miss their schedules if the buses do not appear on time (refer to figure 1). The desire for a tracking app highlights the importance of technology in enhancing the overall transportation experience. On the other hand, students who stay off- campus recommend regular off-campus services because they might be relying on private means of transportation (refer to figure 1), because there are currently no reliable off-campus regular services available.
### k) Discussion of Students' Rating of BTS Drivers' Behavior/Conduct
According to the results presented in Table 9, the perception of the students regarding various variables related to the drivers' performance has been analyzed. The data shows that a majority of the students strongly agree that the drivers are friendly, with $56.2\%$ of the respondents confirming this statement. Additionally, $21.9\%$ of the students agree with this statement, while only $18.8\%$ remained neutral. Only a small percentage of students, $3.10\%$, disagreed with the statement, and none of them strongly disagreed with it.
When it comes to the drivers' knowledge about DOT safety regulations, $53.1\%$ of the respondents strongly agree that the drivers possess this knowledge. Similarly, $25\%$ agreed with this statement, while $21.9\%$ stayed neutral towards it. Interestingly, no student disagreed or strongly disagreed with this statement.
Similarly, for the variable of "drivers have excellent communication skills," a majority of the students agreed with the statement, with $43.8\%$ strongly agreeing and $25\%$ agreeing. On the other hand, $31\%$ of the respondents selected a neutral response. However, no student disagreed or strongly disagreed with this statement.
Regarding the drivers' driving skills, $59.4\%$ of the respondents strongly agreed that the drivers have excellent driving skills. $28.1\%$ agreed with the statement, while $12.5\%$ opted for a neutral response. In general, the responses showed that $53.1\%$ of the respondents strongly agreed with the statements, $25\%$ agreed, and $21.1\%$ remained neutral. Only a negligible percentage of $0.8\%$ of the responses disagreed with the statements.
Overall, the analysis of the data suggests that the students generally agree that the drivers are friendly, knowledgeable about safety regulations; possess excellent communication skills, and driving skills.
These positive perceptions can contribute to overall student satisfaction with the university's transportation services. When students have positive experiences with drivers and efficient transportation services, it can enhance their overall satisfaction with the university's transportation system. The potential implications for the university's transportation management include the need to prioritize driver training and behavior management to maintain positive perceptions among the students.
### i) Discussion of Regression Statistics of Students BTS ratings and Drivers are friendly
According to the information in table 10, the correlation coefficient (r value) between drivers being friendly and students' rating of BTS efficiency is 0.60, indicating a strong positive correlation between these two factors. Furthermore, the coefficient of determination (r2) reveals that $35\%$ of the variance in drivers' friendly behavior can be attributed to students' evaluations of BTS operation efficiency. However, the remaining $65\%$ of the residual variance cannot be explained by this factor alone. This suggests that other factors might be influencing the drivers' behaviors, such as their communication skills, driving abilities, or knowledge of the Department of Transportation (DOT) safety regulations. Overall, this information suggests that while students' evaluations of BTS efficiency can explain a significant portion of drivers' friendly behavior, there are likely other factors at play as well.
### j) Discussion of Hypothesis Testing Results of Drivers Friendly Behavior (Y)
Based on the analysis of Table 11, it has been observed that the calculated F value of 16.02 is considerably higher than the critical value. This indicates that the independent variable, which is students' ratings of BTS efficiency, is a significant contributor to the variance in students' perception of the BTS drivers being friendly. As a result, there is a strong correlation between the two variables.
Therefore, it can be concluded that the research hypothesis, which suggests a relationship between students' perception of the drivers being friendly and their rating of BTS operation efficiency, is valid and can be accepted. This finding highlights the importance of effective BTS operation management in creating a positive image of drivers among students and improving their efficiency.
### k) Discussion of Regression Statistics Results of Students BTS Ratings (X) and Drivers Knowledge of DOT Safety Regulations (Y)
The statistical analysis of the data presented in Table 12 reveals a moderate positive correlation between drivers' knowledge of DOT safety regulations and students' rating of the BTS efficiency, with an r-value of 0.46. This suggests that as students' ratings of the BTS operation efficiency increase, so does their perception of drivers' knowledge of safety regulations. The coefficient of determination $(r^2)$ indicates that approximately $21\%$ of the variation in drivers' safety knowledge can be explained by the ratings of the BTS operation efficiency provided by the students. However, the coefficient of non-determination of $79\%$ implies that a significant amount of variance in drivers' road safety knowledge remains unexplained by students' ratings of the BTS operation efficiency. This could be the reason why the correlation, while positive, is not particularly strong.
Furthermore, the intercept (a) of the regression equation suggests that if a student did not rate the BTS efficiency (i.e., X equals zero), they would still give the driver's knowledge of safety regulations (Y) a rating of 0.79. The slope (b) of the regression equation indicates that for each additional rating of the BTS efficiency a student provides, they tend to give 0.35 more rating of the drivers' knowledge of safety regulations.
Overall, these findings suggest that while students' ratings of the BTS operation efficiency may be a useful indicator of drivers' knowledge of safety regulations, there are other factors that contribute to drivers' safety knowledge that are not captured by this measure.
### l) Discussion of Hypothesis Testing Results of Drivers DOT Safety Knowledge Behavior
The analysis results in Table 13 reveal that the calculated F value, which is 8.11, is significantly higher than the critical value of F at both the 0.05 and 0.01 significance levels, that is, 4.17. This indicates that the independent variable, which in this case is the students' rating of BTS efficiency, explains a significant amount of the variance in the students' perception of the BTS drivers' knowledge of road safety regulations.
Therefore, we can conclude that the research hypothesis that there is a relationship between the two variables is valid. Specifically, it can be said that the students' perception of the drivers' knowledge of road safety rules plays a significant role in how they rate the overall efficiency of the BTS operation.
### m) Discussion of Regression Statistics of Students BTS ratings (X) and Drivers' Communication Skills (Y)
According to the data presented in Table 14, there is a positive weak correlation (0.09) between the efficiency ratings of students regarding the BTS operation (X) and the communication skills of drivers (Y). The r2 value of $0.76\%$ suggests that only a small portion of the variance in drivers' excellent communication skills can be explained by the students' ratings of the BTS operation efficiency.
On the other hand, the coefficient of non-determination of $99.23\%$ indicates that a significant portion of the variance in drivers' excellent communication skills remains unexplained by the students' ratings of the BTS operation efficiency. Additionally, the large standard error of $95.37\%$ suggests that the results may not be representative of the entire population.
### n) Discussion of Hypothesis Testing results of Drivers Excellent Communication Skills
Based on the analysis of the data provided in Table 15, it has been observed that the calculated F value is 0.23, which is less than the critical value of F at the.05 and.01 significance levels, i.e., 4.17. This implies that the significance F (0.63) is greater than the calculated F value, indicating that the independent variable (students' ratings of BTS efficiency) explains an insignificant variance in students' perception of the BTS drivers' knowledge of road safety regulations. Therefore, there is no significant relationship between these two variables. This further affirms the weak correlation between the two variables.
Based on the above observation, we can conclude that we accept the null hypothesis, which states that there is no relationship between students' perception of the efficiency of the BTS operation and the drivers' communication skills. In other words, the data does not provide evidence to support the assumption that there is a significant relationship between these two variables.
### o) Discussion of Regression Statistics of Students BTS ratings (X) and Drivers' Excellent Driving Skills
The statistical analysis conducted on the data in Table 16 revealed that the correlation between students' ratings of BTS efficiency and drivers' driving skills is moderately positive, with an r value of 0.44. This means that as the students' ratings of BTS efficiency go up, so do their ratingsof the drivers' driving skills.
Additionally, the r-squared value of 0.19 (19%) indicates that $19\%$ of the variance in drivers' driving skills can be explained by the students' ratings of BTS efficiency. In other words, taking into account the students' ratings of BTS efficiency can reduce the error in predicting their perception of the drivers' driving skills by $19\%$.
However, it is important to note that the coefficient of non-determination of 0.81 (81%) indicates that the remaining $81\%$ of the variance in drivers' excellent driving skills is not explained or accounted for by the students' ratings of BTS operation efficiency.
Lastly, the standard error of $66\%$ represents the discrepancy or deviation in establishing the relationship between the students' BTS ratings and drivers' driving skills. This suggests that theremay be other factors that influence students' ratings of drivers' driving skills, and that this relationship should be interpreted with caution.
### p) Discussion of Hypothesis Testing Results of Drivers Excellent Driving Skills
Based on the data presented in Table 17, a calculated F value of 7.04 was obtained. Comparing this value with the critical value of F at the.05 and.01 significance levels (4.17), it was found that the calculated F value was greater than the critical value. This means that the result is statistically significant and falls outside the null hypothesis acceptance zone. Consequently, the researcher's hypothesis that there is a relationship between students' ratings of the BTS efficiency and drivers' driving skills is accepted. It should be noted that the relationship is moderate in nature. In summary, the obtained findings suggest that there is indeed a significant relationship between students' ratings of the BTS efficiency and drivers' driving skills, even though this relationship is not very strong.
### q) Summary of Research Discussion Findings
1. Students who stay on campus majority of whom are freshmen prefer to walk than to use the bus system to campus. However, off-campus students usually made of masters and doctorate students prefer using private means to campus to the public transport. Reasons were that both public transport and the BTS are not fast and reliable.
2. Students prioritize fast movement and convenience in selecting their transport mode to campus giving a perception that the BTS is quiet slow even though they perceived the BTS to be serving its purpose effectively and operates efficiently.
3. Students want management to develop app to track the buses movement schedules and provide off-campus regular services because majority of off-
campus students use their private means because there is no reliable off campus regular services.
4. Students generally agree that drivers are friendly, know safety regulations, and have excellent communication and driving skills.
5. There is a strong positive relationship between students' perception that the drivers are friendly and their rating of the BTS operation efficiency.
6. Students' perception that the drivers' knowledge of road safety rules has an influence on how they rate the BTS operation efficiency – there is a moderate positive relationship.
7. However, the analysis found no relationship between students perception of the efficiency of the BTS operation and drivers communication skills.
8. There is a moderate positive relationship between students' ratings of the BTS efficiency and drivers driving skills.
9. Even though there are somewhat relationships the standard predictor errors were high suggesting that the data used in the analysis may not be a sufficient representation of accurate predictions for the entire student population.
### r) Conclusion
Students generally have a positive perception of the BTS operations even though many of them do not use it to move around campus. Also, students agree that drivers are friendly, know road safety regulations, and have excellent communication and driving skills. The research results also established a positive correlation between the efficiency and effectiveness of the bus system and how students perceive it.
However, it is worth that there were varying degrees of strength in these relationships, with high standard errors among the dependent variables. In other words, while the survey findings suggest that students generally view the BTS system favorably, their perception of its efficiency and effectiveness is influenced by several factors. Incorporating these findings into planning and policy-making processes can lead to more effective and user-centric transportation solutions for the campus.
## V. RECOMMENDATIONS FOR FURTHER RESEARCH
1. An extension of the research could be done to explore the reasons behind the positive perception despite low BTS usage.
2. Research can be done to explore other factors that could have influenced the respondents' choice of transportation mode, such as distance from campus or availability of parking spaces.
3. Further research can be done to evaluate the safety of pedestrians and cyclists on campus.
4. Lastly, with the increasing awareness of the need for sustainable development, finding ways to reduce carbon emissions and promote eco-friendly transportation modes is essential. Therefore, research can be done to assess the environmental impacts of transportation to help mitigate its effects.
## VI. LIST OF ABBREVIATIONS
AAMU. Alabama Agricultural and Mechanical University
Campus Master Plan
FTA..Federal Transit Authority
BTS. Bulldog Transit System
DOT............Department of Transportation
SPSS. Statistical Package for Social Sciences
ANOVA. Analysis of Variance
Generating HTML Viewer...
References
5 Cites in Article
Aamu (2014). Alabama A&M University Master Plan.
Aamu (2014). Alabama A&M University Transit Map.
Muhammad Abdullah,Charitha Dias,Deepti Muley,M Shahin (2020). Exploring the impacts of COVID-19 on travel behavior and mode preferences.
S Aydın,K Gündoğdu,S Dubela,S Moslim (2021). Evaluating Public Transport Quality using Picture Fuzzy Analytic Hierachy Proccess and Linear Assignment Model.
(2017). The Magnesium Chelation Step in Chlorophyll Biosynthesis.
Explore published articles in an immersive Augmented Reality environment. Our platform converts research papers into interactive 3D books, allowing readers to view and interact with content using AR and VR compatible devices.
Your published article is automatically converted into a realistic 3D book. Flip through pages and read research papers in a more engaging and interactive format.
Our website is actively being updated, and changes may occur frequently. Please clear your browser cache if needed. For feedback or error reporting, please email [email protected]
Thank you for connecting with us. We will respond to you shortly.