## I. INTRODUCTION
Two worldwide events opened novel reflections in a highly vast scientific literature concerning a universal concept like that of "data", namely as the results of observations, either experimental or human mind generated: the "big data" and the universal use of informatics, related to each other and both in exponential increase.
The capacity and speed of modern computers allowed us obtaining such immense amounts of data, both from experimental setups or from the elaboration of algorithms, either human-built or through AI. Their handling too is necessarily operated via informatics means, considered distinct from mathematical means. Apparently, these facts have disconnected data evaluation from traditional fields, not only of science but also in the way to take decisions based on them.
The paper contains reflections on the properties and meaning of (numerical) data in their-self, specifically as the vehicle of information almost universally necessary to make decisions, the latter being a frame that is often prevalent in the literature about big data.
In particular, it will tackle the issue of the concept of "uncertainty" in some of the new frames, necessarily related to the "quality" that also must be associated to the decisions, ${}^{1}$ as what is commonly called risk.
## II. FROM A SINGLE DATUM TO THE BIG DATA
The reflections in the paper will be restricted to data arising from the information acquired from the "external" world, i.e. each datum will be considered here to be the exclusive elementary component of human knowledge in its numerical form. In Section 3, its distinct origin is considered, of being the result of a mind reflection generating, e.g., scientific theories, the above two being the basic frames of our (limited) knowledge.
A datum, obtained from the observation of the external world, is commonly considered a "fact", meaning an objective piece of information—further, most often expressed by a number—as opposed to a mind reflection, taken as subjective. The interested reader is directed to a previous author's paper on the limits of this distinction. [^1]
Each datum is an element of a "series", which can be of different nature and kind according to a well-established set of classifications. [^2] The first kind is typically obtained "experimentally", i.e. from an "observation" expressed most often—exclusively in the following—in numerical form. These data are treated by a discipline called "measurement science" setting "a process intended to share common ways to transmit the knowledge to the Community that is not limited to a single generation of scientists and practitioners, and is intended to obtain the necessary consensus". [3] Different tools are used, one of the foremost being statistics.
Big data are series of data, in principle of both origins, so much more extensive than the "historical series" that they can only be treated and analyzed by employing informatics, primarily since the available modern ones are exceptionally performing from the point of view of speed and memory capacity. As a consequence, they can only (also) be elaborated with informatics, a discipline that in many respects is presently considered by many of its users as distinct from measurement science. Such a distinction is certainly true as to the technicalities and the apparatuses. Additionally, it is a fact that most of the activities of experimental science are today based on computers.
Big data are apparently a collation of raw data, meaning for raw that no specific "qualification" is associated with each datum, but only the source of the complete series is provided. A consequence, in what one can find in the literature, is, e.g., the fact that the discussion on the big data is limited to a mere analysis of the dataset, very seldom on their "quality".
## III. DATA FROM MODELS VS. EMPIRICAL DATA
With the rapid diffusion of informatics, the use of computer models has rapidly grown—becoming one of the preferred tools in Internet socials for "informing" people. This preference for models has pushed an increasing number of scientists—namely economists—to exercise in their use. However, that is a field potentially risky, namely because in it the limit between science and economics/politics is almost invisible, certainly quite uncertain.
Typically, "data is interpreted and processed by a priori established models", [4] assumed to be based on them. On the other hand, the models might, conversely, also be considered an important generators of big data, especially when concerning simulation: a (generally) mathematical modeling of a phenomenon. Conversely, modeling can be directly based on existing databases (extended or not) and are customarily used for the prediction of future behavior of an observed phenomenon. However, since prediction does not usually make use of random types of mathematical representations—a forecast is mainly aimed to address decisions—but of deterministic functions, the future trends obtained from these functions cannot be considered as independent datasets.
Instead, the big datasets of empirical data tend today to even replace analytical models. Due to that, "the predictive capabilities of such models entirely lies in data itself" [4] a form of dataism (see later). In this respect, such a tendency concerning prediction often masks a critical misunderstanding about the meaning and the use of data. [5] In fact, the expected validity duration of a prediction depends first of all on the observed and estimated "law(s)": in the case of mechanics, e.g., of the orbit of the sky big bodies like the Earth, a forecast can confidently be provided for extremely long periods. The same level of confidence is not available for thermodynamics in physics, basically dominating natural events or for economics.
Problems may arise from the fact that no (set of) mathematical function used as a model is indefinitely "flexible", i.e. apt to "correctly" interpolate any cluster of data—namely the less when less are the parameters of the function(s). There is a vast literature on this subject matter, for example, to detect a "changing point" in a trend. Fitting is considered a good technique when merely is a reasonable balance between the best "copying" of behavior with time (like when the function has to match a given profile) and a satisfactory "averaging" of the behavior supplied by experimental values—and the more the more extended is the period and without "masking" of changing points.
As a consequence, usually, a sort of balance should always exist between the number of data already available—plus the length of the period during which they were taken—and those collected in a future period. Only in that case the function so obtained is apt to be "safely" extrapolated, and considered providing a sufficiently good forecast—i.e., by remaining accurate without the support of any constraints, except those (purely mathematical) set by the function. Big data could partially compensate for their more extensive number of data, but only when related to a short extension in time of the extrapolation.
For example, if the "safe" observation time is considered to be 30 years, it is hardly possible to assume any sensible extrapolation to a further period of the same length—the shorter the shorter is the reference period. In fact, for the more rapidly increasing (or decreasing) of the function derivatives—or for nonsimple shapes of the function—the more the variation in the extrapolated period becomes problematic.
Further, a qualification that is often absent in the information supplied together with the extrapolations is the quality of the available dataset. Instead, the existing data uncertainty—whose information must always be provided as it determines quality—must be taken into consideration, since the quality of the fitting on the available data is vital for the quality of the subsequent extrapolation. Again, the size of big data series has in itself no influence on data precision. There are even instances where original data quality is so low that is already sufficient to make one understanding that their fit would be unreliable and the extrapolation meaningless.[^2]
Accordingly, the forecast almost always consists of a trend area (typically increasing its width with time) where the future determinations are assumed to fall within an assigned probability. Most often, the trend is monotonic because usually changing points cannot be predicted, but, in a few cases, the extrapolation may also show a change in sign of the first or/and of the second derivative—e.g., for trend causes foreseen to become exhausted, or instead be born in future.
## IV. DATAISM VS. MEASUREMENT SCIENCE
The existence of big data induced the creation of a new frame called "dataism" by the New York Times journalist that created it in 2013, David Brooks. [6,7] Subsequently, a discussion started, especially on Internet sites, considering it as a replacement for "humanism" or even thinking that a scientific revolution has taken place. Also in the frame of philosophy of science the issue raised some interests regards to the concept of "measurement" when "data science" is pretended to replace measurement science. [4,8]
According to [8], dataism: (italics added)
- " - perceives the entire world as a flow of data;
- believes that data provide a fair and exhaustive representation of reality;
- has unconditioned confidence in data and bases their everyday judgments only on data;
- believes that artificial intelligence will overcome human intellect".
It looks like a new form of "objectivism" (the belief that certain things/situations exist independently of human knowledge or perception of them), certainly contrasting (current) modern science/economic theory.
Even without reaching such an extreme, in the field of data expressed in numerical form one can observe in the scientific/economic literature how the information about the data origin is more and more omitted. In other cases went lost in procedures based on informatics, even though with the consciousness of the importance, in particular, of the fact that each dataset has a quality that must remain explicit. However, what is going frequently lost is the fact that to each datum the uncertainty is associated since its first record having an influence of the whole dataset. Then, in order to be reliable, each datum should have been obtained in strict compliance with the rules established by science.
## V. METROLOGICAL ANALYSIS OF BIG DATA
The notable and peculiar issue in the big data literature is that, in the discussion about the set, terms are used based on several disciplines, namely intended for decision taking, more concerning the discipline of economics than that of measurement science.
Another peculiar characteristic, found in the elaborations of big data, was that, basically, only the dispersion of the values with respect some kind of smoothing or fit is reported to characterize the "quality" of the set—and/or to discuss the role of dataset quality in respect to decisions to be taken by using them. [9]
However, dataism should not mean that the big data analysis could start from the recorded numerical values, omitting first the analysis of their quality and assigning to each or group or set of them a degree of confidence - and an analysis of their uncertainty components bringing to the overall quality. Increasing the number, or the frequency, of observations, cannot in itself be sufficient for mitigating uncertainty. The increase of the number of observations or their acquisition frequency does not ensure an increase in the quality of the collected information.
Therefore, dataism neither can mean an overestimation of the importance of basing science (and suggestions/decisions) on data, including their use in the economic discipline: they are to be treated as partial knowledge, though often the most reliable available but often also far from being univocally meaningful. They cannot replace theory. [9] In fact, the information content of data, the only important one, should be evaluated in terms of its "quality", a property that is not intrinsic in any data but that has to be verified. According to [4](italics added):
"The dimensions of information quality include (and is valid for any discipline):
1. Consistency: the condition that data is within the assumed value domain and is not duplicated;
2. Availability: the fraction of time that data is made available by the system that stores it;
3. Currency and timeliness: the degree to which data is updated and readily available for use, respectively;
4. Specificity: a condition related to the quantity of syntactical information: stating, e.g., that a length is in the interval $(10.5 \pm 0.1) \mathrm{m}$ is more specific, and therefore of better quality, than stating that it is in the interval $(10 \pm 1) \mathrm{m}$; when referring to measurement results, specificity is also called precision;
5. Trueness: a condition related to the faithfulness of semantic information: were, e.g., 10.55 m the value of a length provided by the best independent method, stating that the length is 10.50 m is truer, and therefore of better quality, than stating that it is 10.40 m as synthesized in terms of accuracy in metrology". [2, 10]
In the big data literature, almost all scientific terms are lacking, decorating the meaning of the term "uncertainty" and "quality", still commonly used in it though often related only to the decisions to be taken.
## VI. TYPES OF DECISIONS AND EXAMPLES OF POSSIBLE "DATAISM-SYNDROME" IN BIG
## DATA ANALYSES AND USE: SOME CONSEQUENCES IN TAKING DECISIONS
According to the previously provided base definition of "decision", decisions can be technical (rarely strictly scientific) or strictly economic or rather more political, i.e. related to the concern about local/general Society.
As basically a scientist, the author cannot pretend to be an authority in all the above fields, but he has been for several decades personally involved in the societal position of his profession in the Italian Society, and consequently he also got some expertise about social and economic aspects, either in a Society or in the World.
In all instances, measurement science is multidisciplinary, so that many of its scientific evaluations can be performed irrespective to their specific kind or origin.
One field where immense data collations exist today is the one concerning Earth parameters, especially in the current period where the climate became a dominant and critical activity of vast Communities of scientists. It mainly involves the disciplines of physics and chemistry—meteorology and environment being part of them—but many of the relevant observed effects then need decisions of political and economic nature. A couple of examples are taken in the following from fields that the author recently has already partially explored from his metrologist's point of view. One is the Global Mean Surface Temperature (GMST)—temperature metrology being one of the specific professional expertise of the author. [11, 12]
The GMST is probably the most popular climate parameter that is commonly used to support decisions recommended by International Organizations, namely the IPCC, HadCRUT, etc. It is computed from the data obtained by the meteorological stations of the WMO network, amounting to millions, whose distribution on the Earth's surface is however quite non-homogeneous [13]. The resulting database can be considered a big data one consisting of the recorded numerical values of surface air temperature according to the WMO protocol for the meteorological stations.
The only direct statistical information that the database supplies is obtained in the literature by the fitting of datasets with a suitable function in order to obtain the trend for a period: the information one gets basically consists in the dispersion of the data (through the parameter standard deviation or similar). However, that is not the uncertainty of the dataset, but only one of the several uncertainty components of the collected data.
Instead, the IPCC, e.g., only describes by words the statistical/informational procedure used to get the final evaluation of the GMST, in the total absence of the resulting values of each single uncertainty component of the data used, before and after several data manipulations: sampling, interpolation where data are lacking, normalization, adaptation, smoothing, homogenization, etc.
It is scholarly known that, with sufficient and competent statistical methods, it is possible to get an estimate of a set of sparse values having a resulting much lower dispersion and higher coherence/consistency. However, each of the required many manipulations (not only methodological/computational, though today computer-based, requiring choices) and assumptions, add an uncertainty component to the final precision: each and all contribute to the overall uncertainty.
In this case, one has even billions of data, produced by temperature sensors (of medium-low quality, of both of the contact or radiation types) affected by an original uncertainty and all placed in different and distant locations of the Earth. One is metrologically unable to mitigate or reduce their original uncertainty, arising from calibration/traceability (two pillar procedures of measuring science) and from the measuring-system uncertainties. Instead, the above analysis does not include this initial step. The above means that, to get a $\pm (0.05 - 0.1)^{\circ}\mathrm{C}$ overall uncertainty—values published by IPCC—most uncertainty components would need to be at a level of $0.01^{\circ}\mathrm{C}$ or less, which sounds be simple impossible to occur. Thus for the GMST, the probably most difficult parameter to evaluate, also because it is based on local information, an uncertainty as the above one today—and of a few tenths of a degree one Century back—is by far not representing the metrological capabilities nor the status of the meteorological stations in most of regions/countries of the World, by a factor not less than $\times 10$, often more.
Having studied the literature and examined some of those databases [14], no evidence of application of the basic metrological requirements were found, namely supported by a published Budget of Uncertainty, applied to the immense work done by the hundreds of authors involved in that frame.
The consequences of a lack in trust are heavy and even possibly unexpected: examples follow about forecast.
It is difficult to disagree that a forecast is less reliable when the uncertainty of the to date available data is higher. Consequently, forecasts of 80 years ahead for the GMST, are assumed to be safe in showing an increase from the present one $+0.12^{\circ}\mathrm{C}$ to $+(2 - 3)^{\circ}\mathrm{C}$, are certainly much less reliable and credible if the supporting data are affected, at best, by an uncertainty of $\pm (0.5 - 1)^{\circ}\mathrm{C}$ —especially when also using data decades-old—considering their further quick increase in uncertainty, having the progress of thermometry and meteorology been relatively recent (in addition, not even the uncertainty arising from the forecast modeling had been considered).
The GMST record from 1850 is reported in Fig. 1. Its trend is not a simple one even not considering the clear effect of the II World War, and becomes a clear rise only after $\approx 1970$ (but from year $\approx 1950$ human population increased from 2 to 8 billion). Notice that the HadCRUT (14) (SQUARE BRACKETS) value indicated value of the standard deviation (s.d.) for a confidence level of $97.5\%$ was $\pm 0.12^{\circ}\mathrm{C}$: the author of this paper, for the 1970-2021 fit of the same data, got, again for the $97.5\%$ confidence level, a s.d. of $\pm 0.27^{\circ}\mathrm{C}$. For the GMST values computed for the IX century, 1850-1900, the uncertainty indicated in Fig. 1. $0.5 - 0.7^{\circ}\mathrm{C}$ (apart some very high sparse values during a limited number of initial years), while the author's fit of the same data in the same period for the GMST change of $-0.32^{\circ}\mathrm{C}$, brings to $\pm 0.36^{\circ}\mathrm{C}$ again for the $97.5\%$ of confidence level, rather optimistic in both cases for that period where the imprecision of the temperature measurement was certainly much higher (and the World-data availability certainly quite lower). Note that the above reported s.d. values are only meaning the reproducibility, not the quite larger precision, of the GMST trend.
A similar attitude concerning the reliability of the forecasts was found concerning other climate parameters. For example, the author recomputed a parameter linked to the forecast about the melting of the ice on the Earth's surface, the ice/snow annual coverage in the past 20 years, from a NASA public source. [15] While the results of the retrieval from the original video were consistent with the overall estimate made by the official bodies, it was found no evidence of a claimed acceleration in time of the ice melting speed—incidentally, in the Report of the EEA, the responsible body for Europe, the uncertainty of the data in their website is not reported and uncertainty was labeled "not applicable".
Linked to the former parameter is the forecast of the future increase of the mean water level in the oceans.
The current estimated increase is about $+10$ cm, with no uncertainty associated to this value. In this case, two decades of previous forecasts are available, reported here in Fig. 2, showing a forecast reduction of the increase by 7 times. More recently, the forecast has been pushed to 2300 (Fig. 3), where the estimate is of a rise up to 50 times with respect to the present one—according to the tallest indicated models. What is evident is that such a formidable extrapolation is totally depending on the mathematical properties of the adopted model, because the present data trend looks quite irrelevant—physical models are also by definition a forecast.
## VII. FINAL REMARKS
The massive increase of data bringing to the very extended databases called "big data" forced the users to concentrate on the informatics methods concerning not only the storage an retrieval but also the complementing of the traditional tools used in science, for qualifying and making use of the information that they supply be means of totally informatics ones. Actually, most of the literature on big data comes just from the informatics discipline and from Institutions dedicated to it, instead from metrological Institutions.
That feature favored the expansion of the use of terms of the latter discipline, in most cases, replacing the traditional in measurement science. The critical issue put in evidence in this paper is that, in too many cases, the scientific terms used in the latter discipline, which define the way a measurement can be conducted and then analyzed in a scientifically reliable way, are ignored, or at least omitted.
That way to deal with data does not only involve and affect the credibility of the analyses performed on the data, but also the frame of decisions, which is, in most cases, the main reason of the analyses. A decision should obviously be based as much as possible on credible information, but that can be maximized only by increasing the reliability of the data on which the decision is taken.
Data do not fit a "purpose" but a need. The need is not to proof a position but to reach the understanding of a situation or the reason of the need. They are supposed to describe, to support or to disclose a situation or a scenario needing a decision, e.g., social or economic or both.
Consider the case of an emergency, e.g., as the recent COVID pandemic: were the big data useful to make provisions and to resolve or accelerate a mitigation of the related problems? Similarly, can the big data on climate help in understanding if its variations are significant toward a mitigation of the related problems? Are the big data useful as a guidance concerning local/World Communities in advising about a new sustainable economy?
Dataism assumes that data directly originate from reality: this is a too strong assumption, as, in fact, political inference can instead be dominant with respect to "neutral" technical aspects. Trust on data cannot turn to become a kind of "faith" on data: faith is not science.
The above is a too frequent misunderstanding that arises from blind confidence in the data as objective facts—when not even replacing the decision tool as the dataism do. However, a lack of complying with the rules of decision-taking cannot be mitigated by the amount of data available—often in a short time.
Data uncertainty is not ignored, but the discussion on it, in general, omits resorting to most important fundamental parameters of measurement science. In a word, it is enough to summarize the situation with the fact of the total absence of published quantitative "uncertainty budget". [5]
## VIII. CONCLUSIONS
In western tradition, decisions come from evidence of facts, at least non-strictly, or not necessarily, in political or economical frames like, e.g., in social frames.
The present big-data frame has no reasons in itself for derogating from the above context/foundation.
However, it might happen that it makes easier false manipulations if not correctly and strictly handled according to scientific standards.
In that respect, big data do not deserve a higher authority in taking decisions with respect to previous critically-formed datasets of more limited extensions. They are a mere technicality. Big does not mean necessarily better or more powerful with respect to qualified information, also concerning decisions.
 Panel label: Figure Captions.
 Fig. 1: GMST behavior (blue dots) between 1850 and 2021 according to HadCRUT (database downloaded and analyzed by the author). [14] The red dots are the upper and lower values of the standard deviation for a confidence level of
$97.5\%$. Notice the clear effect of the II World War. Note also that $T(1850) \approx T(1970)$ across two World wars Fig. 2: Sea mean level forecasts for years from 1990 to 2017 [15]: for 2020 +5 cm; current estimate for 2020: +10 cm.
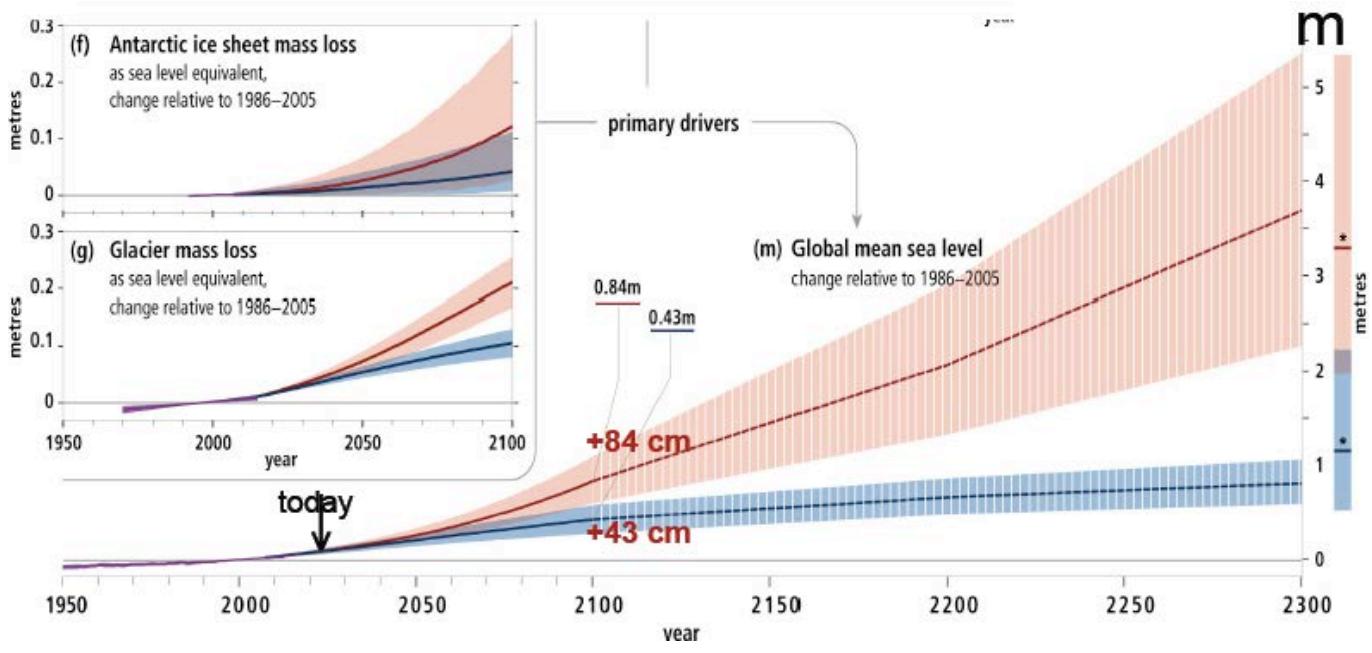 Fig. 3: Same in AR5 [16] up to year 2300: the max
$+35$ cm in year 2035 (Fig. 2) is not anymore included in the forecast; the current forecast is $+43 - 84$ cm for 2100—while the 2300 forecast is $+(85 \pm 25)$ to $+(550 \pm 130)$ cm
[^1]: Decision is "a conclusion or resolution reached after consideration". _(p.1)_
[^2]: Frequently, supplying the results from more than one model is preferred, as a multiplicity can be able to allow an indirect evaluation of the possible variability of the forecast. The comparison of models can certainly mitigate the risk of false extrapolations, if made with different fitting (set of) equations—and of different complexity—on the same data, but places other problems—such as the choice of the "best" model, and the fact that all are, in general, deterministic functions _(p.2)_
Generating HTML Viewer...
References
14 Cites in Article
F Pavese (2009). On the degree of objectivity of uncertainty evaluation in metrology and testing.
Marc Priel (2012). Vocabulaire de la métrologie.
Franco Pavese (2021). Comment to: L. Mari “Is our understanding of measurement evolving?”.
Luca Mari,Dario Petri (2017). The metrological culture in the context of big data: managing data-driven decision confidence.
Franco Pavese (2022). Uncertainty in case of lack of information: extrapolating data over time, with examples of climate forecast models.
D Brooks Unknown Title.
Y Harari (2016). Homo Deus: A Brief History of Tomorrow.
Dario Petri (2020). Big Data in Instrumentation and Measurement [Guest Editorial].
C Anderson (1994). The end of theory: the data deluge makes the scientific method obsolete.
F Pavese (2020). Graphic method for retrieval of quantitative data from computer-mapped qualitative information, with a NASA video as an example.
F Pavese (2023). The choice of cartographic system on the calculation of Earth's surface parameters from maps, namely of the GMST.
C Morice,J Kennedy,N Rayner,J Winn,E Hogan,R Killick,R Dunn,T Osborn,P Jones,I Simpson An Updated Assessment of Near-Surface Temperature Change From 1850: The HadCRUT5 Data Set.
No ethics committee approval was required for this article type.
Data Availability
Not applicable for this article.
How to Cite This Article
Franco Pavese. 2026. \u201cDecisions at the time of Big Data\u201d. Global Journal of Science Frontier Research - A: Physics & Space Science GJSFR-A Volume 23 (GJSFR Volume 23 Issue A7).
Explore published articles in an immersive Augmented Reality environment. Our platform converts research papers into interactive 3D books, allowing readers to view and interact with content using AR and VR compatible devices.
Your published article is automatically converted into a realistic 3D book. Flip through pages and read research papers in a more engaging and interactive format.
Our website is actively being updated, and changes may occur frequently. Please clear your browser cache if needed. For feedback or error reporting, please email [email protected]
Thank you for connecting with us. We will respond to you shortly.