I. INTRODUCTION
Image quality assessment is a subject of extensive analysis over the last four decades. Different multimedia applications streaming images and videos like Netflix, Amazon Prime Video, Twitter, Face book, Share Chat, etc. are gaining more popularity day by day. With the increasing availability of Internet all over the world, the usage of these applications is increasing rapidly. So, these applications requires quality assessment to be done on their content so that they can provide quality content on their platform. This helps to improve customer visual experience on their respective plat- forms. The main aim of image quality assessment is to quantitatively measure the perceived quality of digital and natural photographs. The acquisition, transmission, storage, post-processing, or compression of images brings different distortions, such as Gaussian blur (GB), Gaussian white noise (WN), or blocking artifacts. WN is added while taking pictures at night with a mobile, GB occurs if not focusing correctly before taking the shot.
Based on IQA results, decisions can be taken on compression ratio for these digital images before storing them in servers for streaming purpose as well as deciding which image will be good to be published on the online platform. A dependable IQA technique can help assess the quality of photos downloaded from the web, as well as measure the accuracy of image processing techniques precisely, such as super-resolution and image compression from a human's perspective. The IQA algorithms are categorized into 3 groups, based upon the usage of reference image: no reference IQA (NR-IQA), reduced-reference IQA (RR-IQA) and full-reference IQA (FR-IQA). The performance of these algorithms is NR-IQA, RR-IQA, and FR-IQA, in order of increasing accuracy. However, since pristine images are not available in most of the real time situation, NR-IQA is most suitable method. The image quality assessed using no-reference (NR) IQA algorithms does not require knowledge of the original image. The image quality assessed using reduced-reference (RR) IQA methods requires only a few details about the original image. Full-reference (FR) algorithms need both a distorted image and a reference image as input and produce a quality rating for the distorted image in comparison to the original image. The most common technique to FR-IQA is to first calculate the local pixel-wise differences between reference image and distorted image. Finally, combine these local calculations into a single scalar value to represent the overall quality difference. Example of FR-IQA algorithms are: Structural Similarity Index Mean (SSIM), the peak signal-to-noise ratio (PSNR) and mean-squared error (MSE). Unlike FR-IQA, in NR-IQA the quality is measured using the features obtained from the distorted images and the subjective quality scores.
II. RELATED WORK
This section provides a brief detail of the existing no-reference and reference image quality assessment techniques. Li et al. [1] proposed a new multiscale directional transform, basically a shearlet transform used to extract simple features from distorted images. Then these primary features are used to explain the nature of original images and distorted images.
Then, stacked autoencoders are used to amplify the primary features and make them more distinguishable.
Mittal et al. [2] proposed a NSS-based distortion-generic IQA model. This model works best in the spatial domain. BRISQUE does not calculate the distortion-specific features, such as blur, blocking, or ringing. Rather, it uses scene statistics of locally normalized luminance coefficients to quantify losses of naturalness in the image.
Li et al. [3] trained a general regression neural network (GRNN) to assess the quality of image, relative to the human subjective opinion, across a diverse range of distortion types. The features used for assessing the quality of the image include gradient of the distorted image, entropy of phase congruency image, mean value of the phase congruency image, and entropy of the distorted image.
Moorthy and Bovik [4] introduced DIIVINE (Distortion Identification-based Image Verity and INte grity Evaluation). This algorithm evaluates the quality of a distorted image without the original images. It is a 2-stage based technique where image distortion identification is done first and then image quality assessment is done based on distortion type.
Tang et al. [5] presented a framework, where potentially neither the degradation process nor the ground truth image is known. The method is based on a set of low-level image features. The image quality characteristics are derived from original image measurement and texture statistics. Here, a machine learning technique is used to learn a mapping from these features to the subjective quality scores.
Doermann et al. [6] obtained the basic feature set by the extraction of local features. Then, using the features from the CSIQ database, by adopting K-means clustering, the codebooks with 100 centers was retained. In the mean time, the method proposes high order features: variance, mean, and skewness. The input features are used to get distances to K clusters. Then the method performs regression over three distances. It is sensitive to diverse distortion types.
Fang et al. [7] proposed a quality assessment methodology based on statistical structural and luminance features (NRSL). The evaluations were done on 4 synthetically and 3 naturally distorted image datasets. In terms of high correlation with human subjective judgments, the employed NRSL metric compares favorably to relevant BIQA models. Support vector regression was used to establish the complex nonlinear relationship between feature space and quality score. It was unable to use NRSL for various distortions in chromatic component of the image.
Kim and Lee [8] proposed Deep Image Quality Assessment (DeepQA) where the behavior of HVS is analyzed from the data distribution of IQA datasets. The sensitivity maps were evaluated for various distortion types and degrees of distortion. Subjective score requires reference images.
Y. Li et al. [9] proposed SESANIA where shearlet transform and deep neural networks (stacked autoencoders) is used instead of conventional regression machines. This framework is enhanced to calculate the quality of image in local regions. Liu, Weijer, and Bagdanov [10] used Siamese Network for ranking images in order of image quality. The relative image quality is known for which synthetically generated distortions are used. This helps to solve the issue of the limited size of the IQA dataset. These ranking image sets can be constructed automatically without the requirement of painful effort of labeling by human. This technique uses synthetic images. Saad et al. [11] introduced a Natural Scene Statistics (NSS) based methodology which uses discrete cosine transform (DCT) technique. This method was based on a Bayesian technique to evaluate the image quality scores when features retrieved from the image is given.
Kede Ma et al. [12] proposed an optimized neural network for assessing blind image quality. First, distortion is identified and then the quality prediction is done using the features obtained during distortion identification.
Fei Gao et al. [13] proposed Deep Similarity for image quality assessment (Deep Sim) framework. First, the features of the original and tested images are received from Image Net pretrained VGGNet without any further training. Then, the local similarities between the features of those corresponding images are calculated. At last, the local quality indices are eventually pooled altogether to evaluate the quality index.
Min et al. [14] proposed the concept of multiple pseudo reference images, which are generated from distorted images by applying various levels of distortion. As a result, the quality of a pseudo reference image (PRI) is generally lower than that of its distorted counterpart. The idea behind this methodology is to generate a series of PRI by further degrading the distorted image, and then use local binary patterns (LBP) to calculate the similarity between them to evaluate its quality.
Talebi and Milanfar [15] proposed a convolutional neural network based methodology known as NIMA which is used to predict the distribution of human opinion scores. The network may be used to score images in a way that closely resembles human perception. Its goal is to forecast image technical and aesthetic attributes.
Hou et al. [16] proposed a blind IQA that directly learns qualitative evaluation and predicts scalar values for general usage and fair comparison. Here, the natural scene statistics features are used to represent the images. A discriminative model is trained to distinguish the characteristics into five ranks, that correlate with five rational notion, i.e., bad, poor, fair, good and excellent.
Bose et al. [17] proposed a neural network based method for IQA that enables feature learning and regression in an end-to-end framework. A siamese network using CNN is used with both original and distorted images as input for FR-IQA whereas one branch of siamese network is discarded where the distorted image is used as input for NR-IQA. It incorporates a weighted average patch aggregation that implements a method for pooling local patch qualities to global image quality.
Based on selected feature similarity and ensemble learning, Hammou et al. [18] suggested an ensemble of gradient boosting (EGB) measure. To characterise the perceptual quality distance between the pristine and distorted/processed images, the features obtained from various layers of deep CNN are analyzed. Kang et al. [19] proposed a compact CNN for calculating image quality and identifying distortions. The parameter reduction at the fully connected layers makes this model less prone to overfitting.
III. MOTIVATION
The main motivation behind image quality assessment is to quantify visual perception of humans for image quality so that quality evaluation of images can be done. Digital images intend to degrade during the process from generation to consumption. Different kind of distortions are introduced in the process of transmission, post processing, or compression of images such as white noise, Gaussian blur, or impeding artifacts. This affects the visual experience of users while seeing image content on various online websites. A depend-able IQA algorithm can assist in quantifying the quality of images acquired from the web and also helps to measure the performance of image processing algorithms precisely, such as image-compression and super-resolution, from the point view of a human.
a) Drawbacks of Using CNNs to NR-IQA
Because of its high representation capability and improved performance, convolutional neural networks are the most popular type of neural networks for working with image data. The quantity of the training dataset has a major impact on the performance of neural networks. However, compared to the most frequent computer vision dataset, the currently available IQA datasets are substantially smaller. In contrast to classification datasets, IQA datasets necessitate a time-consuming and sophisticated psychometric experiment. Various data augmentation techniques, such as horizontal reflection, rotation, and cropping, can be employed to enhance the size of the training dataset. The human visual system's (HVS) perception process is made up of several complex processes. It makes training a deep learning model more difficult with a limited dataset. The visual sensitivity of the HVS changes with the spatial frequency of stimuli, and texture prevents concurrent picture alterations.
b) Applications of IQA
IQA has a diverse variety of computer vision and image processing usage. For example:
For quantization, an image compression algorithm can use quality as an optimization parameter.
Image transmission systems can be created to assess quality and distribute different streaming resources accordingly.
Image recommendation algorithms can be created to rank photos according to perceptual image quality.
Depending on the image quality desired, several device characteristics for digital cameras can be modified.
IV. PROBLEM STATEMENT
Image Quality Assessment is different from other image processing applications. Unlike segmentation, object detection or classification, preparing IQA dataset is time-consuming and requires complicated psychometric experiments. Therefore, the generation of huge datasets is costly because it requires the supervision of experts which are responsible of ensuring the correct implementation of the experiments. The next drawback is that data augmentation is not preferred because the pixel structure of original images must not be changed. In this paper, an image quality assessment model is developed to calculate the quality of blind images. The distorted images and their ground-truth subjective scores are used for training the CNN model.
V. METHODOLOGY
a) Image Normalization
Image normalization is required because it ensures that the data distribution of each input pixel in the image is consistent. This aids in convergence while doing the training of the neural network. The mean is subtracted from each pixel value, and the result is divided by the standard deviation. Such data would be distributed in a Gaussian distribution centered at zero. The pixel numbers for image input must be positive. As a result, the normalized data must be scaled in the range [0,1] or [0,255]. First, preprocessing is done where the input images are transformed into grayscale, and then they are reduced from their low-pass filtered images. The low-frequency image is retrieved by downscaling the input image to 1/4 and upscaling it again to the original image size. A Gaussian low-pass filter along with subsampling was used to resize the images. The reasons for this kind of normalization is that image distortion doesn't affect the low-frequency component in images. For instance, GB removes high-frequency details, white noise (WN) introduces random high-frequency components to images, and blocking artifacts introduces high-frequency edges. The distortions caused by JPEG is due to excessive image compression. The human visual sensitivity (HVS) is not sensitive to a change in the low-frequency component of the image. The sensitivity reduces rapidly at low frequency.
There is the possibility of losing information while applying a normalization scheme.
b) Architecture
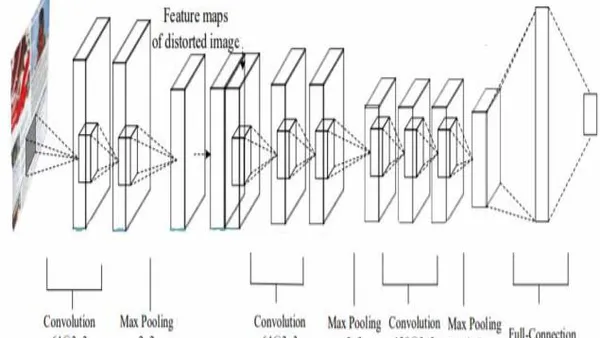
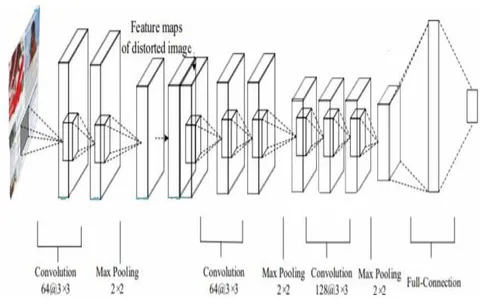
Model for Non-Screen Content IQA: Here a blind image quality assessment method based on CNN is proposed. The features from the CNN are used for a final quality prediction. The design of the network resembles the design of VGG-16 network. The architecture of CNN for synthetic distortion is shown below in figure 1. The existing dataset consists of a subjective score for each distorted image. The model is fine-tuned to evaluate the subjective scores once the training of neural network is completed with enough training data set. The proposed model is fine-tuned on target subject-specific datasets using a variation of stochastic gradient descent.
The kernel size of the convolutions is . A kernel size of two is used in order to diminish the spatial density in both directions by half. The nonlinear activation function ReLU is used. The feature activations of the final convolution layer's are averaged globally across spatial locations. At the end of the network, three fully connected layers and the ReLU layer are added.
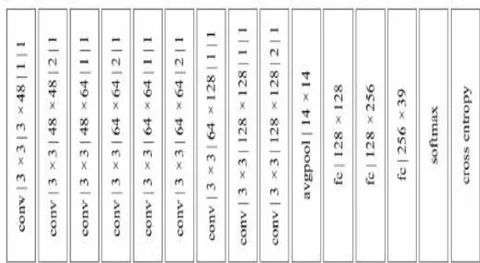
Model for Screen Content IQA: Here a model based on neural network for screen content image quality assessment called SCIQA is used. The SCI CNN architecture is shown in figure 2. It consists of 8 convolution layers, 4 max-pooling layers, and 2 fully connected layers. All convolution layers have a filter size of 3 x 3 with stride of 1 pixel. A 2 x 2 pixel kernel with stride of 2 pixels is used in each pooling layer. Each convolutional layer's boundary is padded with zeros to improve network speed.
c) Subjective Score
After the model has been trained, it is used to predict subjective scores for the distorted image. As illustrated in Fig. 2, the trained network is connected to a global average pooling layer before the fully connected layers. A 128-dimensional feature vector is created by averaging the feature map over the spatial domain. The adaptive moment estimation optimizer (ADAM) was used to change the normal stochastic gradient descent approach for better optimization convergence.
VI. EXPERIMENT RESULTS AND ANALYSIS
a) Hardware and Software
The experiments has been conducted, and the results were obtained with a laptop with Intel Processor, 8 GB RAM, and 512 GB SDD. As for software, we have used Python as the programming language, and the libraries such as TensorFlow, Keras, SciPy, Matplotlib, etc. in the Jupyter Notebook. The input pipeline for the model is created using TFDS API.
b) IQA Dataset
The IQA datasets consists of distorted images along with their corresponding pristine images. It also have subjective quality scores for distorted images which is obtained after conducting a psychometric experiments using human subjects. Human opinions are taken for these distorted images with reference to pristine images using some pre-defined range for quality measurement. Various IQA datasets were utilized to measure the performance of the proposed algorithm: LIVE IQA dataset, LIVE multiply distorted (LIVE MD) dataset, and UniMiB MD-IVL dataset. The summary of datasets is given in Table I.
The LIVE IQA dataset consists of following types of distortion: WN, JP2K compression, GB, and Rayleigh fast-fading channel distortion [20][21][22].
The LIVE MD dataset consists of two categories of images based on distortion combinations applied. First category has images distorted by GB along with JPEG and the second category has images distorted by combination of WN and GB [23].
The IVL dataset is generated from 10 reference images which is selected from various samples both in terms of low-level features (frequencies, colors) and high level features [24]. This dataset consists of multiple distorted images with 400 images distorted by noise and JPEG distortions.
Cardinal rating is provided by human observer for all distorted images corresponding to their reference images in the dataset from a pre-defined scale which is considered as Mean Opinion Score (MOS). Hence, each distorted image in the dataset has a corresponding ground-truth subjective quality score.
| Dataset | References | Distortion | Total Samples |
| LIVE IQA | 29 | 5 | 982 |
| LIVE MD | 15 | 2 | 450 |
| MD-IVL | 10 | 2 | 400 |
c) Evaluation Metrics
Unlike traditional pixel-based metrics like PSNR, SSIM, etc. which were used in the past for evaluating IQA algorithms, here the evaluation of the IQA algorithm is done using two statistical measures: SROCC and PLCC i.e., Spearman's rank-order correlation coefficient and Pearson's linear correlation coefficient respectively. The PLCC is calculated using the following formula:
where S^i and Si are the predicted and ground-truth subjective scores of the ith image, and S^ and S denote the mean of each. The SROCC is calculated using the following formula:
where n denotes the number of images and is the difference between predicted score and ground-truth score of image.
d) Results and Analysis
i. Performance on Individual Distortion Types
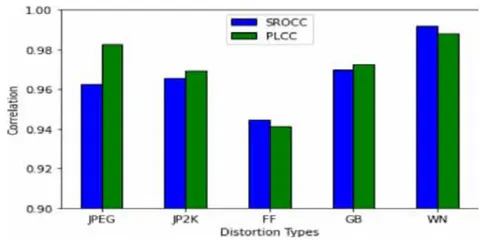
There are 5 distortion types in LIVE IQA dataset. The distortion types are Fast Fading (FF), JPEG, Gaussian Blur (GB), JP2K, and White Noise (WN). The PLCC and SROCC values for each individual distortion type is evaluated using the DIQA [25] framework. In Table II the PLCC and SROCC values are compared based on the individual distortion type using DIQA framework. For WN, the PLCC and SROCC values are highest whereas for JPEG, it is the lowest. Since JPEG affects the image less compared to other distortion types, so the highest values are for WN distortion type.
| Distortion Type | PLCC | SROCC |
| JPEG | 0.9713 | 0.9551 |
| JP2K | 0.9759 | 0.9686 |
| GB | 0.9767 | 0.9713 |
| WN | 0.9881 | 0.9918 |
| FF | 0.9748 | 0.9622 |
| Distortion Type | PLCC | SROCC |
| JPEG | 0.9827 | 0.9624 |
| JP2K | 0.9693 | 0.9656 |
| GB | 0.9727 | 0.9697 |
| WN | 0.9881 | 0.9918 |
| FF | 0.9413 | 0.9447 |
Model Depth PLCC SROCC 5 0.9699 0.9649 6 0.9769 0.9712 7 0.9799 0.9752 8 0.9809 0.9742 9 0.9767 0.9738 10 0.9792 0.9730
ii. Effect of Model Depth
To determine the influence of model depth, six models with different numbers of convolution layers of DIQA [25] was used.
Convolution layers 1 to 4 and convolution layer 8 was used for the shortest setting. After the Conv6 layer, two convolution layers with 64 filters were appended in the longest setting. Figure 4 shows the accuracy comparison among the models on the LIVE IQA dataset.
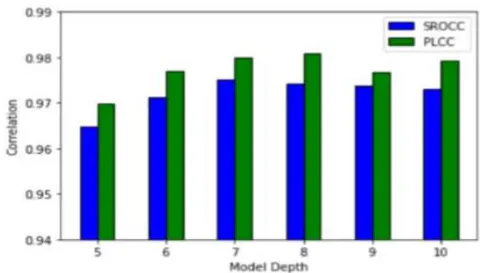
Table III shows the PLCC and SROCC values for different model depth. When the depth was 5, the PLCC and SROCC values were the lowest. When the depth is increased, the correlation coefficient got saturated around 0.97. This may cause overfitting when more convolution layers are used. Hence, it is concluded that the 8 convolutional layers are good enough for the proposed framework.
iii. Performance on Individual Datasets
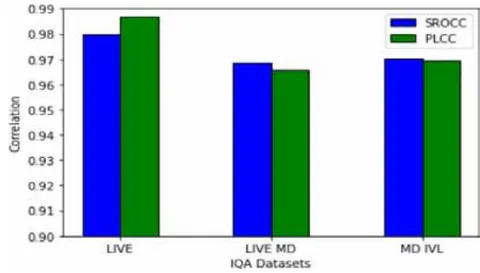
The different datasets are used for evaluating the proposed algorithm. The evaluation metrics such as PLCC and SROCC are used. The datasets are having various types of distortions. In some datasets, various distortion types are combine to produce the distorted image. The DIQA method is evaluated on three different IQA dataset individually. The datasets used are LIVE IQA, LIVE MD and MD IVL. Table V shows the comparison of PLCC and SROCC values for individual datasets using DIQA method. For LIVE IQA dataset, the PLCC and SROCC values are highest
| Dataset | PLCC | SROCC |
| LIVE IQA | 0.9809 | 0.9742 |
| LIVE MD | 0.9545 | 0.9561 |
| MD IVL | 0.9622 | 0.9617 |
| Dataset | PLCC | SRCC |
| LIVE IQA | 0.9867 | 0.9799 |
| LIVE MD | 0.9656 | 0.9685 |
| MD IVL | 0.9696 | 0.9702 |
The PLCC and SROCC values are compared for various IQA datasets like LIVE, LIVE MD and MD IVL in figure 5.
To find the effect of reliability map, the outputs of various configuration is shown in Table VII. It shows that there is an improvement in performance when reliability map is used. Reliability map helps to create homogeneity across the image irrespective of low-frequency components or high-frequency components in the distorted image. This provides the information about the importance of reliability map.
| Reliability Map | PLCC | SROCC |
| w/o | 0.9545 | 0.9561 |
| w | 0.9809 | 0.9742 |
v. NR-IQA Methods
In Table VIII, the PLCC and SROCC metrics of different methods are compared. The different methods are Deep CNN Based Blind Image Quality Predictor (DIQA) [25], Synthetic Convolutional Neural Network (S-CNN) and Screen Content Image Quality Assessment
| Method | PLCC | SROCC |
| DIQA | 0.9809 | 0.9742 |
| S-CNN | 0.9867 | 0.9799 |
| SCIQA | 0.9338 | 0.9229 |
Figure 6 shows the reference image on the left and distorted image with gaussian blur on the right. The image is obtained from LIVE IQA dataset.
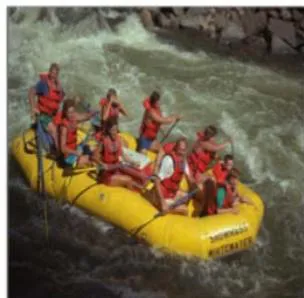

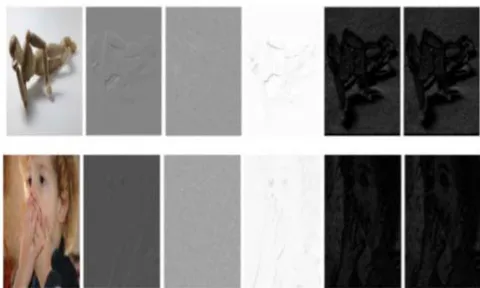
Figure 7 shows the reference image, distorted image in grayscale, error map, reliability map, perceptual error map and sensitivity map in this order. The image is obtained from LIVE IQA dataset.
vi. Correlation Plot
Correlation plot shows the correlation between any numerical variables. The correlation coefficient is calculated to determine the correlation between two variables.
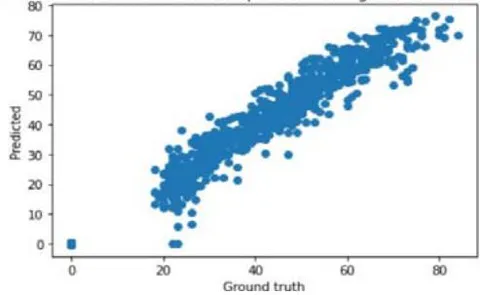
Figure 8 shows the correlation plot of ground truth and predicted subjective scores. The ground truth scores are pro-vided in the dataset for each distorted image and DNSSCIQ
vii. Loss Graph
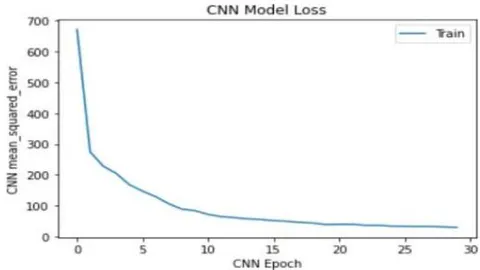
Figure 9 shows loss vs. epoch graph. Here mean squared error is used as loss function. The loss decreases as the number of epochs increases during training. The performance of the model improves with decrease in the loss.
VII. CONCLUSION
A deep CNN-based approach for Non-Screen Content and Screen Content IQA called DNSSCIQ is proposed. In the DNSSCIQ, the input normalization for the distorted images are done first. Then, the distorted image along with its ground-truth subjective score is provided to the neural network for training to obtain more meaningful feature maps. Once the training is completed, the feature maps are globally average pooled and fed the fully connected layers to get the final subjective score of the distorted image. The performance of the DNSSCIQ is good irrespective of the dataset selected is shown by using various datasets from different sources for training and final quality prediction. In addition to this, distortion-specific evaluation of different datasets is done and the output is compared.